. 2013 Mar;109(6):1571-8.
doi: 10.1152/jn.00522.2012. Epub 2012 Dec 19.

Reversed synaptic effects of hypocretin and NPY mediated by excitatory GABA-dependent synaptic activity in developing MCH neurons

Affiliations

Reversed synaptic effects of hypocretin and NPY mediated by excitatory GABA-dependent synaptic activity in developing MCH neurons

Ying Li et al. J Neurophysiol. 2013 Mar.

Abstract

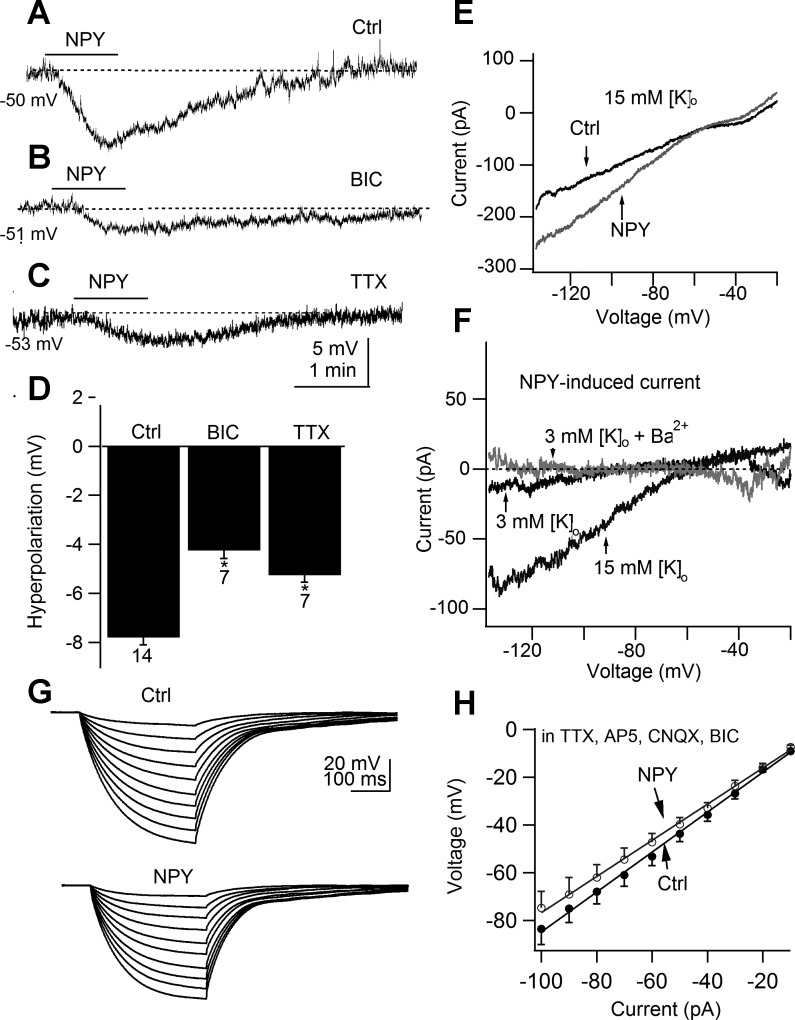
In mature neurons, GABA is the primary inhibitory neurotransmitter. In contrast, in developing neurons, GABA exerts excitatory actions, and in some neurons GABA-mediated excitatory synaptic activity is more prevalent than glutamate-mediated excitation. Hypothalamic neuropeptides that modulate cognitive arousal and energy homeostasis, hypocretin/orexin and neuropeptide Y (NPY), evoked reversed effects on synaptic actions that were dependent on presynaptic GABA release onto melanin-concentrating hormone (MCH) neurons. MCH neurons were identified by selective green fluorescent protein (GFP) expression in transgenic mice. In adults, hypocretin increased GABA release leading to reduced excitation. In contrast, in the developing brain as studied here with analysis of miniature excitatory postsynaptic currents, paired-pulse ratios, and evoked potentials, hypocretin acted presynaptically to enhance the excitatory actions of GABA. The ability of hypocretin to enhance GABA release increases inhibition in adult neurons but paradoxically enhances excitation in developing MCH neurons. In contrast, NPY attenuation of GABA release reduced inhibition in mature neurons but enhanced inhibition during development by attenuating GABA excitation. Both hypocretin and NPY also evoked direct actions on developing MCH neurons. Hypocretin excited MCH cells by activating a sodium-calcium exchanger and by reducing potassium currents; NPY reduced activity by increasing an inwardly rectifying potassium current. These data for the first time show that both hypocretin and NPY receptors are functional presynaptically during early postnatal hypothalamic development and that both neuropeptides modulate GABA actions during development with a valence of enhanced excitation or inhibition opposite to that of the adult state, potentially allowing neuropeptide modulation of use-dependent synapse stabilization.


Figures

Fig. 1.
Fig. 1.
Hypocretin (HCRT) depolarizes developing melanin-concentrating hormone (MCH) neurons by direct and indirect mechanisms. A–C: examples from 3 cells showing hypocretin (1 μM) depolarizing a developing MCH neuron in normal artificial cerebrospinal fluid [ACSF; A; Ctrl (Control); resting membrane potential (RMP), −55 mV] using perforated-patch and whole cell recording. The amplitude was smaller in the presence of bicuculline (BIC; 30 μM; B; RMP, −60 mV) and in the presence of TTX (1 μM; C; RMP, −59 mV). D and E: in the presence of TTX (1 μM), dl-2-amino-5-phosphonovaleric acid (AP5; 50 μM), 6-cyano-7-nitroquinoxaline-2,3-dione (CNQX; 10 μM), and BIC (30 μM) and with normal whole cell recording, the membrane depolarization evoked by hypocretin was attenuated when 80% of extracellular Na+ was replaced by Li+ (D; RMP, −62 mV). Similarly, treatment with 2-[[4-[(4-nitrophenyl)methoxy]phenyl]methyl]-4-thiazolidinecarboxylic acid ethyl ester (SN-6; 10 μM) for 5–10 min attenuated the response (E; RMP, −61 mV). Whole cell recording was used in these experiments. F: bar graph shows the mean effect of hypocretin-induced depolarization under different conditions in developing MCH neurons. The number over each bar is the number of neurons recorded. All test groups were significantly different from their control (P < 0.05). Example traces from these experiments are shown above in A–C. G: bar graph shows the mean effect of hypocretin-induced depolarization in the presence of TTX (1 μM), AP5 (50 μM), CNQX (10 μM), and BIC (30 μM) under different conditions. H: in voltage ramps, hypocretin evoked a mean inward current at voltages negative to −20 mV in the presence of TTX (1 μM), AP5 (50 μM), CNQX (10 μM), BIC (30 μM), and CdCl2 (200 μM) with Cs+ replacing K+ in the pipette solution. Traces show the current responses to the voltage ramps before (Ctrl; middle trace) and during hypocretin (1 μM; bottom trace) and the hypocretin-induced current by subtraction of control from hypocretin (HCRT-induced current; top trace). I: traces show the mean currents (n = 5) evoked by 800-ms voltage ramps from −140 to 0 mV before (Ctrl) and during hypocretin (1 μM) in the presence of TTX (1 μM), AP5 (50 μM), CNQX (10 μM), BIC (30 μM), CdCl2 (200 μM), and SN-6 (10 μM) with whole cell recording with K+ in the pipette. J: the net mean hypocretin-induced current was obtained by subtracting control from hypocretin currents (K+ pipette solution; n = 5) and was abolished when intracellular K+ was replaced with Cs+ (Cs+ pipette solution; n = 4). *P < 0.05.
Fig. 2.
Fig. 2.
Hypocretin enhances GABA-mediated postsynaptic currents (PSCs) in developing MCH neurons. A: a trace (−60-mV holding potential) from a representative experiment shows hypocretin (1 μM) increased the amplitude and frequency of PSCs with whole cell recording. BIC (30 μM) completely blocked all PSCs. The PSC block recovers with BIC washout. B: similar data as in A with expanded time and current scale showing 10 s of control baseline, hypocretin, and hypocretin + BIC. C: bar graph shows the mean effect on the frequency and amplitude of PSCs under the same conditions as A. Error bars indicate SE, and the asterisk indicates that the test group was significantly different from control (P < 0.05; n = 6).
Fig. 3.
Fig. 3.
Presynaptic enhancement of GABA excitation by hypocretin in developing MCH neurons. A: a representative trace shows that hypocretin (1 μM) increased the amplitude of the electrically evoked (50–100 μA, 0.2–0.5 ms, 0.1–0.2 Hz) excitatory postsynaptic potential (eEPSP; RMP, −49 mV) using perforated-patch recording. The increased amplitude of eEPSP recovered after peptide washout. B: bar graph shows the mean effect on evoked EPSP amplitude before (Ctrl), during, and after application of hypocretin. C: traces of miniature excitatory PSCs (mEPSC; −60-mV holding potential) before, during, and after application of hypocretin (1 μM) in the presence of TTX (1 μM), AP5 (50 μM), and CNQX (10 μM) and with whole cell recording. Hypocretin increased mEPSC frequency. D: bar graph shows the mean effect of hypocretin on the frequency of mEPSC, as in C. E: cumulative probability of mEPSC amplitude distribution from a single MCH neuron before and during hypocretin application. F: traces show the muscimol (30 μM)-induced current before (left) and after (right) treatment with hypocretin using perforated-patch recording. Hypocretin was added 60 s before application of muscimol and hypocretin. G: bar graph shows the mean effect of hypocretin on the muscimol (30 μM)-induced current. *P < 0.05.
Fig. 4.
Fig. 4.
Neuropeptide Y (NPY) hyperpolarizes developing MCH neurons. A–C: NPY hyperpolarized the membrane potential (Control; A; RMP, −50 mV) as determined with both perforated- and whole cell-patch recording with similar data from both methods; the hyperpolarization was reduced by BIC (30 μM; B; RMP, −53 mV) and reduced by TTX (1 μM; C; RMP −51 mV). D: bar graph shows the mean shift in membrane potential induced by NPY in the control buffer (Control) or in the presence of BIC or TTX, respectively. Each bar shows the hyperpolarization induced by NPY under the 3 conditions. Membrane potentials were not adjusted back to control levels after introduction of BIC or TTX. E: traces show the currents evoked by 800-ms voltage ramps from −140 to −20 mV before (Ctrl) and in NPY (1 μM) in the presence of TTX (1 μM), AP5 (50 μM), CNQX (10 μM), BIC (30 μM), and CdCl2 (200 μM) with K+ intracellular solution. High K+ (15 mM) was used for this experiment. F: the NPY-induced net current was smaller in 3 mM (3 mM [K+]o; middle trace) than in 15 mM (15 mM [K+]o; bottom trace) and was abolished with Ba2+ (3 mM [K+]o + Ba2+; top trace), consistent with a dependence on K+-channel opening. G: the current-voltage relationship was studied before and during NPY (1 μM) by injecting a series of square-wave negative current steps (200-ms duration) from −100 to −10 pA in 10-pA increments in the presence of TTX (1 μM), AP5 (50 μM), CNQX (10 μM), and BIC (30 μM). H: the mean input resistance was calculated based on slope of the linear part of the current-voltage curve (n = 7; bars show SE). *P < 0.05.
Fig. 5.
Fig. 5.
NPY reduces GABA-mediated PSCs in developing MCH neurons. A: a trace was recorded (−60-mV holding potential) from a typical MCH cell showing that NPY reduces synaptic activity, which recovers after washout, using whole cell recording. BIC (30 μM) completely blocked synaptic activity. B: similar traces to those in A with expanded time and current scale showing 10 s of control, NPY, peptide washout, and BIC traces. C: bar graph shows the mean effect on the frequency and amplitude of PSCs as shown in the example in A. Error bars indicate SE, and the asterisk indicates that the test group was significantly different from control (P < 0.05; n = 8).
Fig. 6.
Fig. 6.
Presynaptic inhibition of GABA excitation by NPY in developing MCH neurons. A: traces show that NPY (1 μM) decreased the amplitude of the evoked (50–100 μA, 0.2–0.5 ms, and 0.1–0.2 Hz) EPSP (RMP, −50 mV) using perforated-patch recording. The decreased amplitude of the eEPSP recovered after peptide washout. B: bar graph shows the mean effect on the eEPSP amplitude before, during, and after application of NPY. C: traces of mEPSCs (−60-mV holding potential; whole cell recording) before, during, and after washout of NPY (1 μM) in the presence of TTX (1 μM). NPY decreased mEPSC frequency. D: bar graph shows the mean effect of NPY on the frequency of mEPSCs as in C. E: traces show muscimol (30 μM)-induced current before (left) and after (right) treatment with NPY using perforated-patch recording. NPY was applied continuously for 30 s before coapplication of muscimol and NPY. F: bar graph shows the mean effect of NPY on muscimol (30 μM)-induced currents. *P < 0.05.

Similar articles

Cited by

References

    1. Beloosesky R, Gayle DA, Amidi F, Ahanya SN, Desai M, Ross MG. Ontogenic expression of putative feeding peptides in the rat fetal brain and placenta. Nutr Neurosci 9: 33–40, 2006 - PubMed
    1. Ben-Ari Y, Cherubini E, Corradetti R, Gaiarsa JL. Giant synaptic potentials in immature rat CA3 hippocampal neurones. J Physiol 416: 303–325, 1989 - PMC - PubMed
    1. Bittencourt JC, Presse F, Arias C, Peto C, Vaughan J, Nahon JL, Vale W, Sawchenko PE. The melanin-concentrating hormone system of the rat brain: an immuno- and hybridization histochemical characterization. J Comp Neurol 319: 218–245, 1992 - PubMed
    1. Botchkina GI, Morin LP. Organization of permanent and transient neuropeptide Y-immunoreactive neuron groups and fiber systems in the developing hamster diencephalon. J Comp Neurol 357: 573–602, 1995 - PubMed
    1. Broberger C, De Lecea L, Sutcliffe JG, Hökfelt T. Hypocretin/orexin- and melanin-concentrating hormone-expressing cells form distinct populations in the rodent lateral hypothalamus: relationship to the neuropeptide Y and agouti gene-related protein systems. J Comp Neurol 402: 460–474, 1998 - PubMed

Publication types

MeSH terms

LinkOut - more resources