Comparative Study
. 2012 Dec 18;12(13):15.
doi: 10.1167/12.13.15.

Detecting natural occlusion boundaries using local cues

Affiliations
Comparative Study

Detecting natural occlusion boundaries using local cues

Christopher DiMattina et al. J Vis. .

Abstract

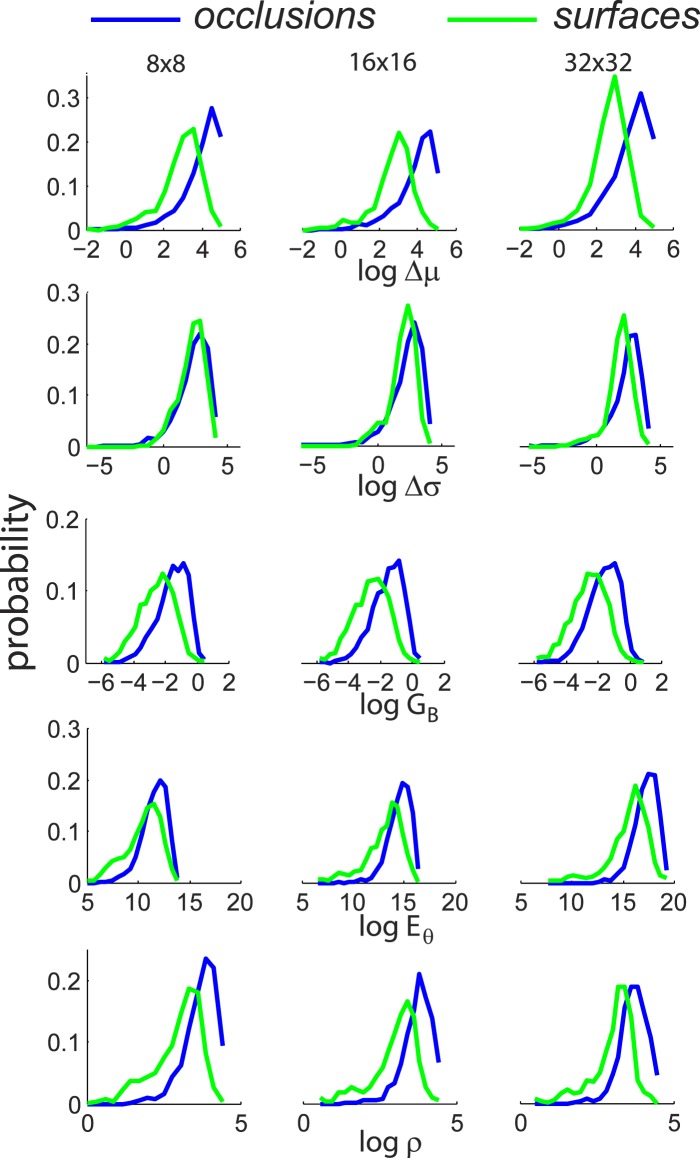
Occlusion boundaries and junctions provide important cues for inferring three-dimensional scene organization from two-dimensional images. Although several investigators in machine vision have developed algorithms for detecting occlusions and other edges in natural images, relatively few psychophysics or neurophysiology studies have investigated what features are used by the visual system to detect natural occlusions. In this study, we addressed this question using a psychophysical experiment where subjects discriminated image patches containing occlusions from patches containing surfaces. Image patches were drawn from a novel occlusion database containing labeled occlusion boundaries and textured surfaces in a variety of natural scenes. Consistent with related previous work, we found that relatively large image patches were needed to attain reliable performance, suggesting that human subjects integrate complex information over a large spatial region to detect natural occlusions. By defining machine observers using a set of previously studied features measured from natural occlusions and surfaces, we demonstrate that simple features defined at the spatial scale of the image patch are insufficient to account for human performance in the task. To define machine observers using a more biologically plausible multiscale feature set, we trained standard linear and neural network classifiers on the rectified outputs of a Gabor filter bank applied to the image patches. We found that simple linear classifiers could not match human performance, while a neural network classifier combining filter information across location and spatial scale compared well. These results demonstrate the importance of combining a variety of cues defined at multiple spatial scales for detecting natural occlusions.


Figures

Figure 1
Figure 1
Occlusion of one surface by another in depth gives rise to image patches containing occlusion edges (magenta circle) and junctions (cyan and purple circles).
Figure 2
Figure 2
Representative images from the occlusion boundary database, together with subject occlusion labelings. Left: Original color images. Middle: Grayscale images with overlaid pixels labeled as occlusions (white lines) and examples of surface regions (magenta squares). Right: Overlaid plots of subject occlusion labelings taken from an 87 × 115 pixel central region of images (indicated by cyan squares in middle column). Darker pixels were labeled by more subjects, lighter pixels by fewer subjects.
Figure 3
Figure 3
Examples of 32 × 32 occlusions (left), surfaces (right), and shadow edges not defined by occlusions (bottom).
Figure 4
Figure 4
Illustration of stimuli used in the psychophysical experiments. (a) Original color and grayscale occlusion edge (top, middle) and its region label (bottom). The region label divides the patch into regions corresponding to the two surfaces (white, gray) as well as the boundary (black). (b) Top: Grayscale image patch with texture information removed. Middle: Occlusion patch with boundary removed. Bottom: Boundary and luminance information removed.
Figure 5
Figure 5
Illustration of the multiscale classifier analysis using the outputs of rectified Gabor filters. (a) Gabor functions learned using ICA form an efficient code for natural images, which maximize statistical independence of filter responses. (b) Grayscale image patches are decomposed by a bank of multiscale Gabor filters resembling simple cells, and their rectified outputs transformed by an intermediate layer of representation whose outputs are passed to a linear classifier.
Figure 6
Figure 6
Schematic of the two-alternative forced choice experiment. A patch was presented to the subject, who decided whether an occlusion passes through the imaginary intersection of the crosshairs. After the decision, the subject was given positive or negative feedback.
Figure 7
Figure 7
Labeling occlusions directly marks fewer pixels than inferring occlusions from image segmentations and yields greater agreement between subjects. (a) Top: An image from our database (left) together with the labeling (middle) by the most conservative subject (MCS). The right panel shows a binary mask of all pixels near the MCS labeling (10 pixel radius). Bottom: Product of MCS mask with labelings from three other subjects. (b) Histogram of the fraction of pixels labeled as edges in the COB (red) and BSD (blue) databases across all images and all subjects. (c) Histogram of the subject consistency index for edgemaps obtained from the COB (red) and BSD (blue) databases for γ = 10. (d) Precision-recall analysis also demonstrates better consistency (F-measure) for COB (red) than BSD (blue).
Figure 8
Figure 8
Power spectra of 32 × 32 patches. Left: Median power spectrum of occlusions (blue) and surfaces (green). Thin dashed lines show the 25th and 75th percentiles. Right: Power-spectrum slopes for occlusions (blue) and surfaces (green).
Figure 9
Figure 9
Univariate distributions of grayscale visual features G1-G5 (see Methods) for occlusions (blue) and textures (green). When plotted on a log scale, these distributions are well described by Gaussians and exhibit separation for occlusions and textures.
Figure 10
Figure 10
Performance of human subjects at the occlusion detection task for 8 × 8, 16 × 16, and 32 × 32 image patches. (a) Subject performance for grayscale image patches. Thin dashed lines denote 95% confidence intervals. Note how performance significantly improves with increasing patch size. (b) Subject performance for color image patches is significantly better than for grayscale at all patch sizes.
Figure 11
Figure 11
Subject performance for grayscale image patches with various cues removed. Dashed lines indicate the average performance for unaltered image patches, solid lines performance in the cue-removed case. (a) Removal of texture cues significantly impairs subject performance for larger image patches. (b) Removal of the boundary and luminance cues substantially impairs subject performance at all patch sizes. (c) Removal of the boundary cue alone without altering texture cues or luminance cues does not affect subject performance.
Figure 12
Figure 12
Subject performance for unaltered color image patches (dashed line) and with texture cues removed (solid line).
Figure 13
Figure 13
Comparison of subject and quadratic classifier performance for grayscale image patches. (a) Classifier defined using all grayscale features (thick blue line) does not accurately model human performance on the task with unmodified patches (black line). (b) Classifier defined using only luminance cues accurately models human performance in the texture-removed condition where luminance differences are the only available cue.
Figure 14
Figure 14
Comparison of subject and quadratic classifier performance for color image patches. (a) Classifier defined using all color features (thick blue line) does not accurately model human performance (black line) on the task with unmodified patches. (b) Classifier defined using only luminance and color contrast more accurately models human performance in the texture-removed condition.
Figure 15
Figure 15
Quadratic classifier performance on 32 × 32 patches as a function of number of features. Feature sets of varying lengths are defined by ranking individual dimensions by their d′ measures and adding them in order from highest to lowest.
Figure 16
Figure 16
Performance of humans and classifiers defined on multiscale Gabor feature set. We see that a simple linear classifier (blue line) does not account for human performance (black dashed line) in the task, a neural network classifier having an additional hidden layer of processing (red line) compares well with human performance.
Figure 17
Figure 17
Schematic illustration of weights learned by the linear classifier. We see that the linear classifier learns strong positive weights (hot colors) with Gabor filters having low spatial frequencies (long lines) located in the center of the image patch.
Figure 18
Figure 18
Hypothetical neural models for detecting occlusion edges defined by textural differences. (a) Hypothetical unit which detects texture edges defined by differences in orientation energy. (b) Hypothetical unit that detects texture edges defined by spatial frequency differences.

References

    1. Abdou I., Pratt W. (1979). Quantitative design and evaluation of enhancement/thresholding edge detectors. Proceedings of the IEEE , 67, 753–763.
    1. Acharya T., Ray A. K. (2005). Image processing: Principles and applications. Hoboken, NJ: Wiley-Interscience.
    1. Arsenault E., Yoonessi A., Baker C. L. (2011). Higher-order texture statistics impair contrast boundary segmentation. Journal of Vision , 11(10):15 1–15, http://www.journalofvision.org/content/11/10/14, doi:10.1167/11.10.14 [PubMed] [Article] - PubMed
    1. Baddeley R. J., Tatler B. W. (2006). High frequency edges (but not contrast) predict where we fixate: A Bayesian system identification analysis. Vision Research , 46, 2824–2833. - PubMed
    1. Baker C. L., Mareschal I. (2001). Processing of second-order stimuli in the visual cortex. Progress in Brain Research , 134, 1–21. - PubMed

Publication types