

Review
doi: 10.2214/AJR.12.9543.
Perfusion MRI: the five most frequently asked technical questions
Affiliations
- PMID: 23255738
- PMCID: PMC3593114
- DOI: 10.2214/AJR.12.9543
Item in Clipboard
Review
Perfusion MRI: the five most frequently asked technical questions
AJR Am J Roentgenol.
2013 Jan.
Abstract
Objective: This and its companion article address the 10 most frequently asked questions that radiologists face when planning, performing, processing, and interpreting different MR perfusion studies in CNS imaging.
Conclusion: Perfusion MRI is a promising tool in assessing stroke, brain tumors, and patients with neurodegenerative diseases. Most of the impediments that have limited the use of perfusion MRI can be overcome to allow integration of these methods into modern neuroimaging protocols.
Figures
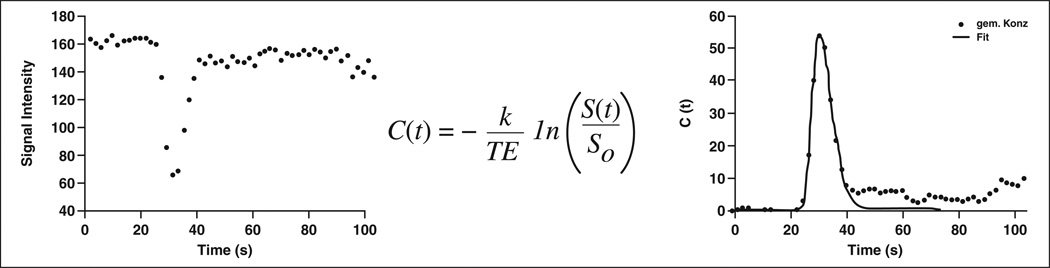
Graphs show transformation of measured signal intensity–time curve into concentration-time curve that can be used to quantify regional cerebral blood volume and cerebral blood flow using equations of indicator dilution theory. C(t) = concentration over time, k = correction factor, TE = echo time, S(t) = signal intensity change after contrast agent administration, SO = baseline signal intensity, gem.Konz = measured concentration.
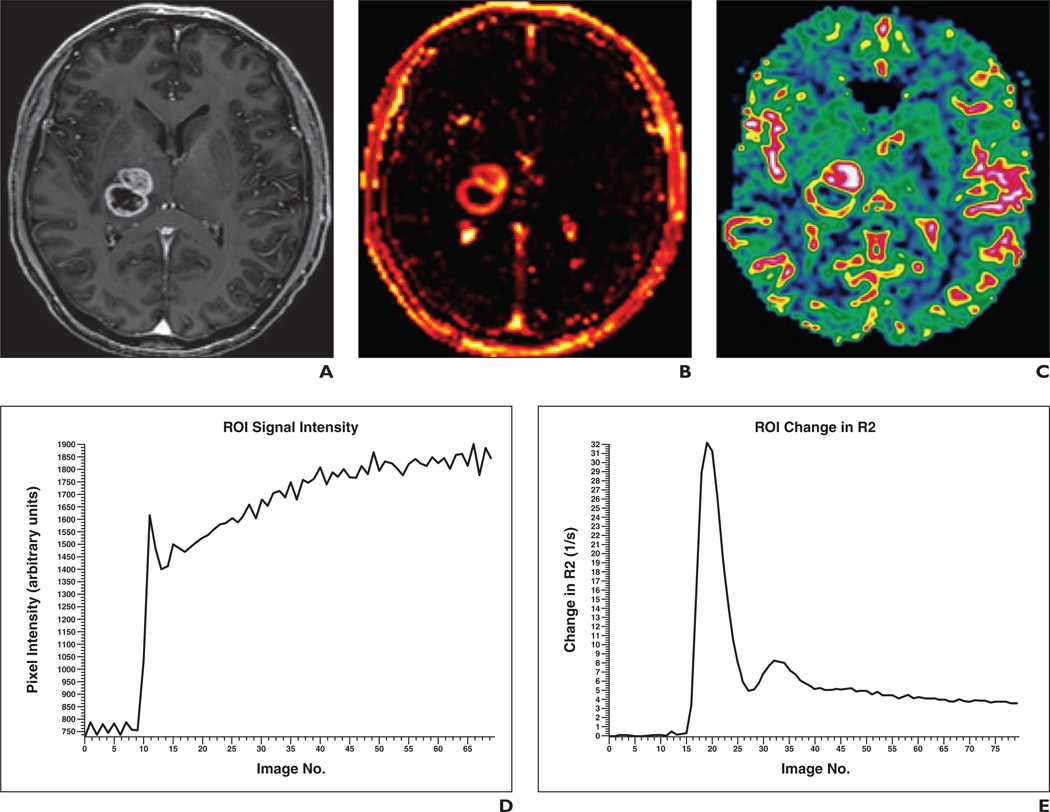
49-year-old patient with high-grade glioma who underwent combined 3-T MR perfusion protocol. A, Contrast-enhanced gradient-recalled echo T1-weighted image shows cystic rim-enhancing lesion with solid frontal parts. B and C, In accordance with the Standardization of Acquisition and Post-Processing study, combined protocol of dynamic contrast-enhanced (DCE) MR perfusion (transfer constant map, B) was obtained first with 0.05 mmol/kg gadobutrol at 2 mL/s and 20 mL saline flush followed by dynamic susceptibility contrast-enhanced (DSC) MR perfusion imaging (relative cerebral blood volume map, C) with 0.05 mmol/kg gadobutrol at 5 mL/s and 20 mL saline flush. D, Although small amount of contrast medium was used, signal intensity–time curve for DCE MR perfusion shows excellent contrast enhancement, resulting in high-quality perfusion maps. E, Concentration-time curve for DSC MR perfusion shows short and sufficient bolus geometry and was not influenced by preload of contrast medium.
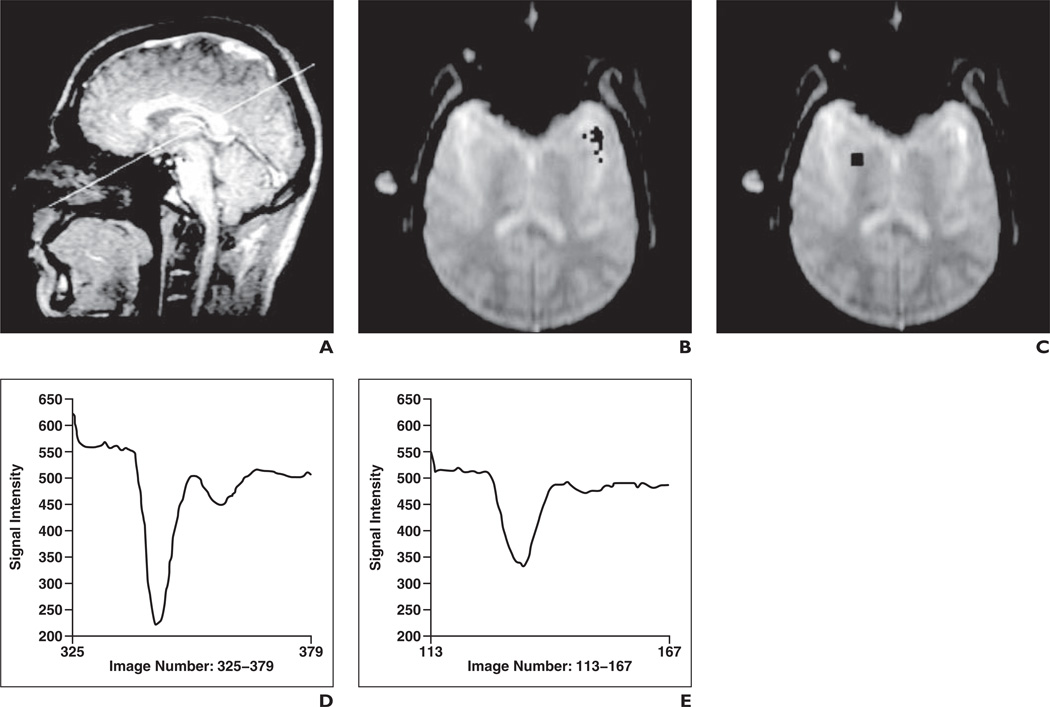
29-year-old male volunteer. (Reprinted with permission from [49]) A–C, Sagittal scout MR image (A) shows paraxial position (line) of images in B and C, which are transverse single-section dynamic susceptibility gradient-echo MR images of middle cerebral artery, putamen, cortex, and white matter. Regions of interest marked for arterial input function (B) and in putamen (C) are shown. D and E, Signal intensity–time curves show 28 mL of 1.0 mol/L gadobutrol formulation (D) and 56 mL of 0.5 mol/L gadobutrol formulation (E) in putamen.
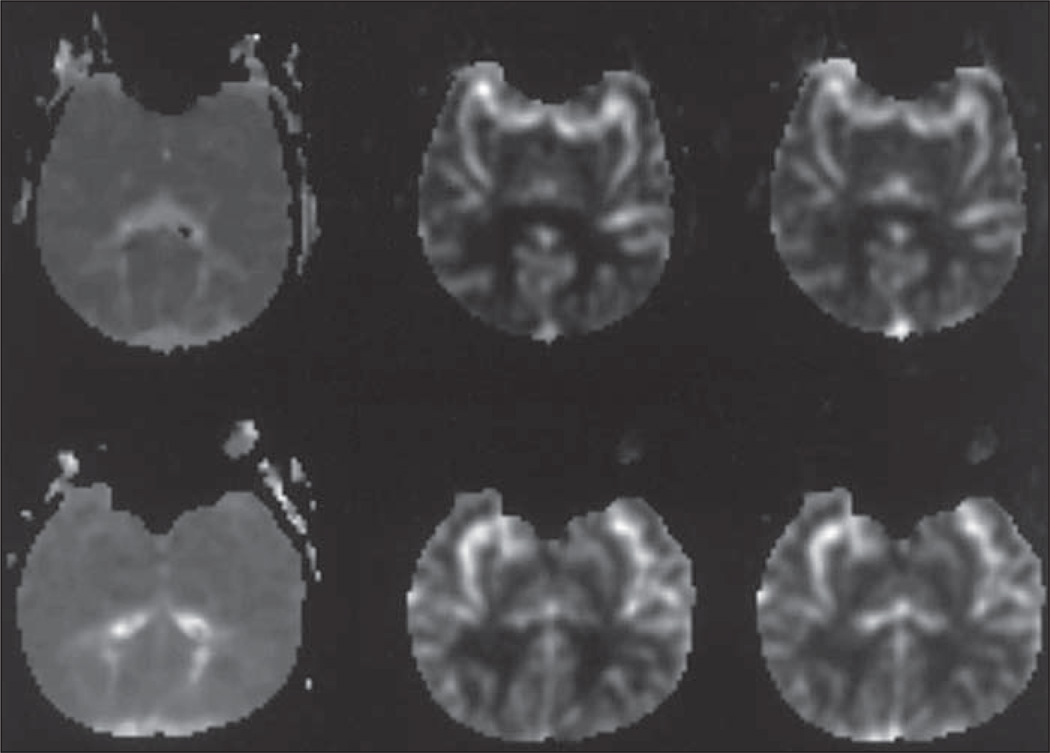
Mean transit time (left), relative cerebral blood flow (middle), and relative cerebral blood volume (right) maps obtained in 36-year-old man after administration of 0.5 mol/L (top) and 1.0 mol/L (bottom) gadobutrol formulations. Dynamic susceptibility contrast-enhanced MRI T2* (delay of 6 minutes based on Hu et al. [72]). Acquisition time was 45–60 seconds. If measuring T2 relaxation time (R2), then measure up to 2.5 min. (Reprinted from [49])
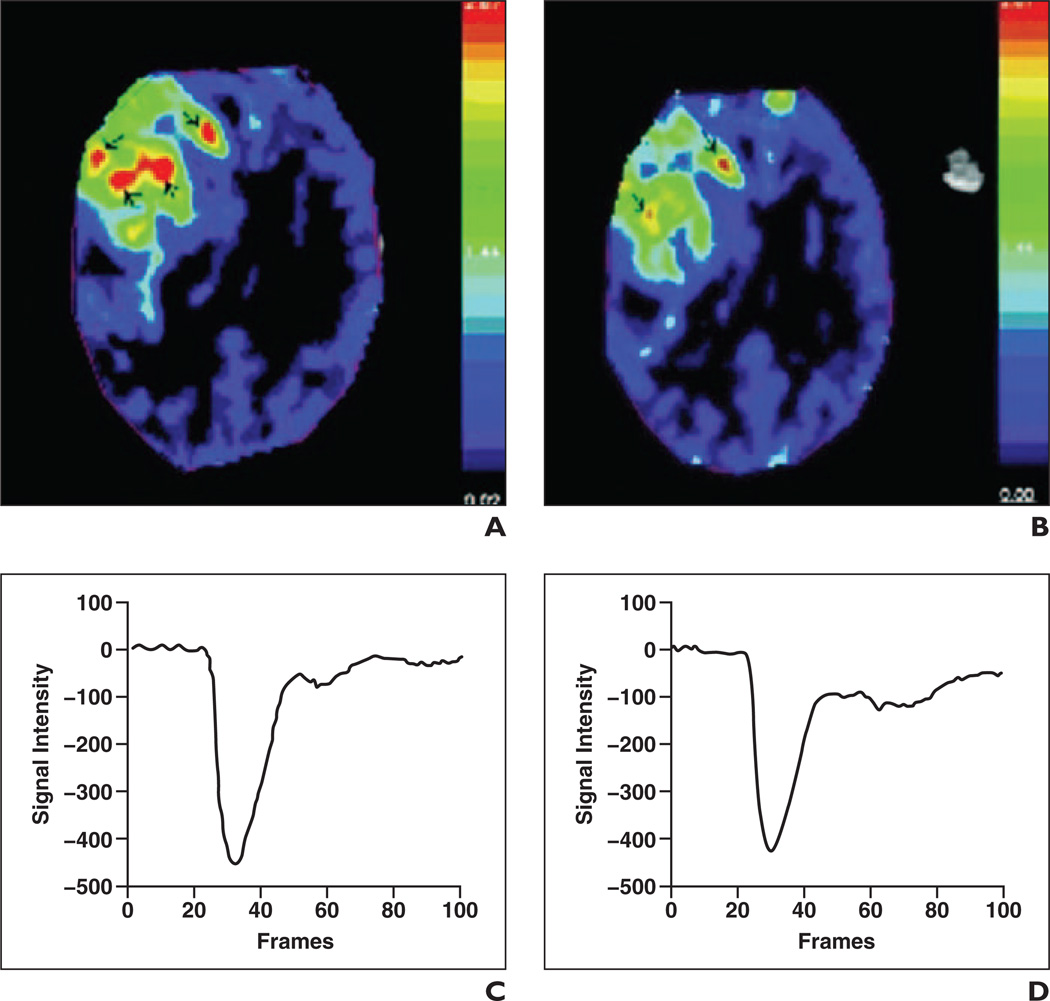
Intraindividual comparison between gadobutrol and gadopentetate dimeglumine for MR perfusion in intracranial tumor at 3 T. (Reprinted with permission from [5]) A and B, Maximum concentration color maps show perfusion-weighted images with gadobutrol (A) and gadopentetate dimeglumine (B). C and D, Graphs show signal intensity–time curves for whole tumor with gadobutrol (maximum signal drop, 446.98; full width at half-maximum [FWHM], 15.14) (C) and gadopentetate dimeglumine (maximum signal drop, 421.59; FWHM, 13.82) (D).
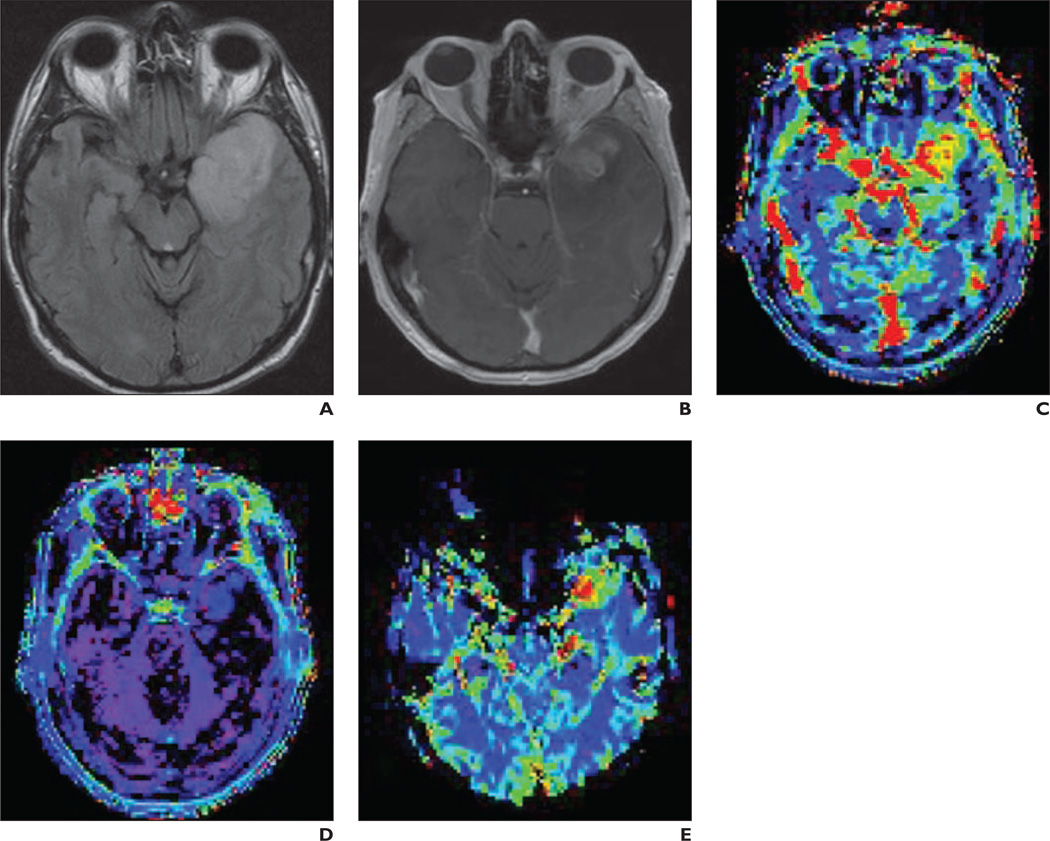
Left temporal grade 3 glioma imaged in accordance with Standardization of Acquisition and Post-Processing study protocol. A–E, Nonenhancing part of lesion (A and B) shows mild increase in plasma volume (vp) image (C). Transfer constant (ktrans) (D) shows no abnormality whereas relative cerebral blood volume image (E) clearly shows high value as marker of anaplastic transformation.
References
-
- Essig M, Lodemann KP, Le-Huu M, Brüning R, Kirchin M, Reith W. Intraindividual comparison of gadobenate dimeglumine and gadobutrol for cerebral magnetic resonance perfusion imaging at 1.5 T. Invest Radiol. 2006;41:256–263. - PubMed
-
- Lacerda S, Law M. Magnetic resonance perfusion and permeability imaging in brain tumors. Neuroimaging Clin N Am. 2009;19:527–557. - PubMed
-
- Shiroishi MS, Habibi M, Rajderkar D, et al. Perfusion and permeability MR imaging of gliomas. Technol Cancer Res Treat. 2011;10:59–71. - PubMed
-
- Giesel FL, Mehndiratta A, Risse F, et al. Intraindividual comparison between gadopentetate dimeglumine and gadobutrol for magnetic resonance perfusion in normal brain and intracranial tumors at 3 Tesla. Acta Radiol. 2009;50:521–530. - PubMed
Publication types
MeSH terms
Substances
Grants and funding
LinkOut - more resources
Full Text Sources
Other Literature Sources
Medical
