Review
. 2013 Jan 15;177(2):103-15.
doi: 10.1093/aje/kws297. Epub 2012 Dec 19.

Meta-analysis investigating associations between healthy diet and fasting glucose and insulin levels and modification by loci associated with glucose homeostasis in data from 15 cohorts

Affiliations
Review

Meta-analysis investigating associations between healthy diet and fasting glucose and insulin levels and modification by loci associated with glucose homeostasis in data from 15 cohorts

Jennifer A Nettleton et al. Am J Epidemiol. .

Abstract

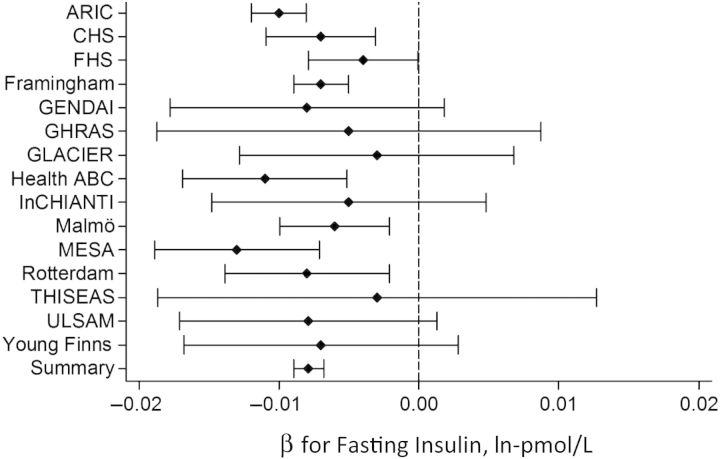
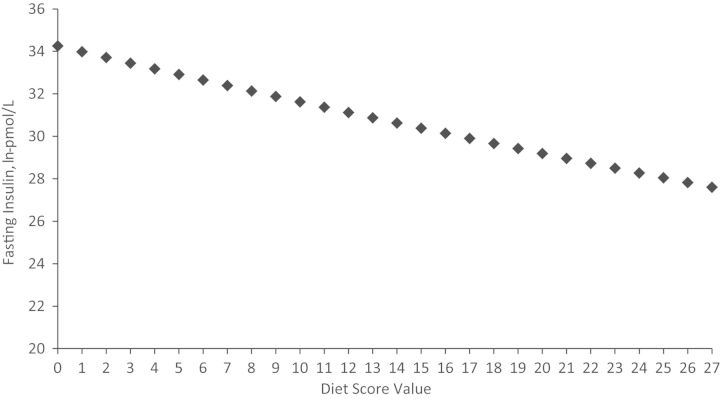
Whether loci that influence fasting glucose (FG) and fasting insulin (FI) levels, as identified by genome-wide association studies, modify associations of diet with FG or FI is unknown. We utilized data from 15 U.S. and European cohort studies comprising 51,289 persons without diabetes to test whether genotype and diet interact to influence FG or FI concentration. We constructed a diet score using study-specific quartile rankings for intakes of whole grains, fish, fruits, vegetables, and nuts/seeds (favorable) and red/processed meats, sweets, sugared beverages, and fried potatoes (unfavorable). We used linear regression within studies, followed by inverse-variance-weighted meta-analysis, to quantify 1) associations of diet score with FG and FI levels and 2) interactions of diet score with 16 FG-associated loci and 2 FI-associated loci. Diet score (per unit increase) was inversely associated with FG (β = -0.004 mmol/L, 95% confidence interval: -0.005, -0.003) and FI (β = -0.008 ln-pmol/L, 95% confidence interval: -0.009, -0.007) levels after adjustment for demographic factors, lifestyle, and body mass index. Genotype variation at the studied loci did not modify these associations. Healthier diets were associated with lower FG and FI concentrations regardless of genotype at previously replicated FG- and FI-associated loci. Studies focusing on genomic regions that do not yield highly statistically significant associations from main-effect genome-wide association studies may be more fruitful in identifying diet-gene interactions.


Figures

Figure 1.
Figure 1.
Associations between diet score and fasting glucose concentration in a meta-analysis of data from 15 cohort studies, CHARGE (Cohorts for Heart and Aging Research in Genomic Epidemiology) Consortium. Regression coefficients (β) for each of the 15 cohorts and the total association, summarized across all 15 cohorts, represent the difference in fasting glucose level (mmol/L) per 1-unit increase in diet score after adjustment for the model 3 covariates: energy intake, age, sex, field center (in Health ABC, CHS, ARIC, FHS, and InCHIANTI), population substructure (by principal components in CHS, FHS, Framingham, MESA, and Young Finns), smoking, physical activity level, highest attained educational level, alcohol consumption, and body mass index. Bars, 95% confidence interval. (ARIC, Atherosclerosis Risk in Communities Study; CHS, Cardiovascular Health Study, FHS, Family Heart Study; Framingham, Framingham Generation 5 and Offspring Studies; GENDAI, Gene-Diet Attica Investigation on Childhood Obesity; GHRAS, Greek Health Randomized Aging Study; GLACIER, Gene-Lifestyle Interactions and Complex Traits in Elevated Disease Risk; Health ABC, Health, Aging and Body Composition Study; InCHIANTI, Invecchiare in Chianti [Aging in the Chianti Area]; Malmö, Malmö Diet and Cancer Study (cardiovascular cohort); MESA, Multi-Ethnic Study of Atherosclerosis; Rotterdam, Rotterdam Study; SNP, single nucleotide polymorphism; THISEAS, The Hellenic Study of Interactions between SNPs and Eating in Atherosclerosis Susceptibility; ULSAM, Uppsala Longitudinal Study of Adult Men; Young Finns, Young Finns Study).
Figure 2.
Figure 2.
Associations between diet score and fasting insulin concentration in a meta-analysis of data from 15 cohort studies, CHARGE (Cohorts for Heart and Aging Research in Genomic Epidemiology) Consortium. Regression coefficients (β) for each of the 15 cohorts and the total association, summarized across all 15 cohorts, represent the difference in fasting insulin level (ln-pmol/L) per 1-unit increase in diet score after adjustment for the model 3 covariates: energy intake, age, sex, field center (in Health ABC, CHS, ARIC, FHS, and InCHIANTI), population substructure (by principal components in CHS, FHS, Framingham, MESA, and Young Finns), smoking, physical activity level, highest attained educational level, alcohol consumption, and body mass index. Bars, 95% confidence interval. (ARIC, Atherosclerosis Risk in Communities Study; CHS, Cardiovascular Health Study, FHS, Family Heart Study; Framingham, Framingham Generation 5 and Offspring Studies; GENDAI, Gene-Diet Attica Investigation on Childhood Obesity; GHRAS, Greek Health Randomized Aging Study; GLACIER, Gene-Lifestyle Interactions and Complex Traits in Elevated Disease Risk; Health ABC, Health, Aging and Body Composition Study; InCHIANTI, Invecchiare in Chianti [Aging in the Chianti Area]; Malmö, Malmö Diet and Cancer Study (cardiovascular cohort); MESA, Multi-Ethnic Study of Atherosclerosis; Rotterdam, Rotterdam Study; SNP, single nucleotide polymorphism; THISEAS, The Hellenic Study of Interactions between SNPs and Eating in Atherosclerosis Susceptibility; ULSAM, Uppsala Longitudinal Study of Adult Men; Young Finns, Young Finns Study).
Figure 3.
Figure 3.
Predicted fasting glucose concentration according to diet score in a meta-analysis of data from 15 cohort studies, CHARGE (Cohorts for Heart and Aging Research in Genomic Epidemiology) Consortium. The graph shows predicted fasting glucose concentrations across the spectrum of possible diet score values (0–27), where a diet score of 13 is set to the across-cohorts mean fasting glucose level (5.28 mmol/L), fasting glucose concentrations are 0.004 mmol/L (the regression coefficient generated from model 3) lower per successively higher diet score value, and fasting glucose concentrations are 0.004 mmol/L higher per successively lower diet score value. The model 3 covariates included energy intake, age, sex, field center (in the Health, Aging and Body Composition Study, the Cardiovascular Health Study, the Atherosclerosis Risk in Communities Study, the Family Heart Study, and Invecchiare in Chianti), population substructure (by principal components in the Cardiovascular Heath Study, the Family Heart Study, the Framingham Generation 5 and Offspring Studies, the Multi-Ethnic Study of Atherosclerosis, and the Young Finns Study), smoking, physical activity level, highest attained educational level, alcohol consumption, and body mass index.
Figure 4.
Figure 4.
Predicted fasting insulin concentration according to diet score in a meta-analysis of data from 15 cohort studies, CHARGE (Cohorts for Heart and Aging Research in Genomic Epidemiology) Consortium. The graph shows predicted fasting insulin concentrations across the spectrum of possible diet score values (0–27), where a diet score of 13 is set to the across-cohorts mean fasting insulin level (3.43 ln-pmol/L), fasting insulin concentrations are 0.008 ln-pmol/L (the regression coefficient generated from model 3) lower per successively higher diet score value, and fasting insulin concentrations are 0.008 ln-pmol/L higher per successively lower diet score value. The plotted values are the result of exponentiating the ln-pmol/L estimates. The model 3 covariates included energy intake, age, sex, field center (in the Health, Aging and Body Composition Study, the Cardiovascular Health Study, the Atherosclerosis Risk in Communities Study, the Family Heart Study, and Invecchiare in Chianti), population substructure (by principal components in the Cardiovascular Heath Study, the Family Heart Study, the Framingham Generation 5 and Offspring Studies, the Multi-Ethnic Study of Atherosclerosis, and the Young Finns Study), smoking, physical activity level, highest attained educational level, alcohol consumption, and body mass index.

References

    1. Frayling TM. Genome-wide association studies provide new insights into type 2 diabetes aetiology. Nat Rev Genet. 2007;8(9):657–662. - PubMed
    1. Grant RW, Moore AF, Florez JC. Genetic architecture of type 2 diabetes: recent progress and clinical implications. Diabetes Care. 2009;32(6):1107–1114. - PMC - PubMed
    1. Dupuis J, Langenberg C, Prokopenko I, et al. New genetic loci implicated in fasting glucose homeostasis and their impact on type 2 diabetes risk. Nat Genet. 2010;42(2):105–116. - PMC - PubMed
    1. Pearson H. Genetic testing for everyone. Nature. 2008;453(7195):570–571. - PubMed
    1. Hunter DJ, Khoury MJ, Drazen JM. Letting the genome out of the bottle—will we get our wish? N Engl J Med. 2008;358(2):105–107. - PubMed