. 2013 Mar;87(5):2597-607.
doi: 10.1128/JVI.02885-12. Epub 2012 Dec 19.

Tropism and infectivity of influenza virus, including highly pathogenic avian H5N1 virus, in ferret tracheal differentiated primary epithelial cell cultures

Affiliations

Tropism and infectivity of influenza virus, including highly pathogenic avian H5N1 virus, in ferret tracheal differentiated primary epithelial cell cultures

Hui Zeng et al. J Virol. 2013 Mar.

Abstract

Tropism and adaptation of influenza viruses to new hosts is partly dependent on the distribution of the sialic acid (SA) receptors to which the viral hemagglutinin (HA) binds. Ferrets have been established as a valuable in vivo model of influenza virus pathogenesis and transmission because of similarities to humans in the distribution of HA receptors and in clinical signs of infection. In this study, we developed a ferret tracheal differentiated primary epithelial cell culture model that consisted of a layered epithelium structure with ciliated and nonciliated cells on its apical surface. We found that human-like (α2,6-linked) receptors predominated on ciliated cells, whereas avian-like (α2,3-linked) receptors, which were less abundant, were presented on nonciliated cells. When we compared the tropism and infectivity of three human (H1 and H3) and two avian (H1 and H5) influenza viruses, we observed that the human influenza viruses primarily infected ciliated cells and replicated efficiently, whereas a highly pathogenic avian H5N1 virus (A/Vietnam/1203/2004) replicated efficiently within nonciliated cells despite a low initial infection rate. Furthermore, compared to other influenza viruses tested, VN/1203 virus replicated more efficiently in cells isolated from the lower trachea and at a higher temperature (37°C) compared to a lower temperature (33°C). VN/1203 virus infection also induced higher levels of immune mediator genes and cell death, and virus was recovered from the basolateral side of the cell monolayer. This ferret tracheal differentiated primary epithelial cell culture system provides a valuable in vitro model for studying cellular tropism, infectivity, and the pathogenesis of influenza viruses.


Figures
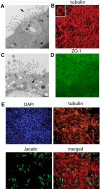
Fig 1
Fig 1
Structural characterization of ferret tracheal differentiated primary epithelial cell cultures (FTE) by TEM and immunofluorescence microscopy. (A) Multiple cell types in fully differentiated primary FTE cell cultures (TEM). The arrow marks a ciliated cell and the arrowhead, a basal cell. Scale bar, 2 μm. (B) Immunofluorescent staining of cilia using anti-β tubulin IV antibody (tubulin) (red) (magnification, ×100). An enlarged ciliated cell is shown in the inset. (C) Ultrastructure of a ciliated cell and a tight junction marked by an arrowhead (TEM). Bar, 500 nm. (D) Immunofluorescent staining of tight junctions using anti-ZO-1 antibody (green) (×400). (E) Characterization of cell surface markers on differentiated FTE cells. Double immunofluorescent staining of tubulin (red) and Jacalin (green) was performed in tandem with DAPI for nuclear staining (×400).
Fig 2
Fig 2
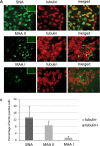
Distribution of α2,6-linked and α2,3-linked SA receptors on the surface of differentiated primary FTE cells. (A) Cells were stained (green) with SNA (which binds to α2,6-linked SA), and MAA I and II (specific for α2,3-linked SA), followed by cilia staining of tubulin (red) (×400). (B) Quantification of lectin staining on the surface of ciliated (tubulin+) and nonciliated (tubulin−) cells. Values represent the mean of the lectin-positive cells in cultures derived from six different animals with the standard deviation indicated.
Fig 3
Fig 3
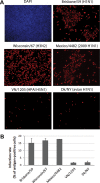
Influenza virus infection in differentiated primary FTE cells. FTE cells were infected with virus at an MOI of 1. Cells were fixed at 8 h p.i., stained for viral nuclear protein (NP, red), and compared to DAPI staining that indicated cellular nuclei (blue). (A) Immunofluorescent detection of influenza virus NP in infected cells (×100). (B) Quantification of NP-positive cells during infection. NP-positive cells and total cells were counted at higher magnification (×400) for the generation of infection rates. Values represent the mean of independent experiments from four different animals with the standard deviation indicated.
Fig 4
Fig 4
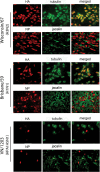
Cellular tropism of influenza virus infection in differentiated primary FTE cells. Cells were infected apically with virus at an MOI of 1 and fixed at 8 h p.i. Cells were stained to identify influenza virus HA or NP (red) and to identify ciliated cells (tubulin, green) and secretory cells (Jacalin, green) (×400).
Fig 5
Fig 5
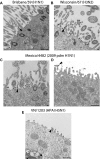
TEM demonstrates the release and cellular tropism of influenza virus. Differentiated primary FTE cells were infected apically with virus at an MOI of 1 and fixed at 24 h p.i. Spherical virions are shown by the arrowhead. Scale bars, 500 nm (A, D, and E) and 100 nm (B and C).
Fig 6
Fig 6
Replication of influenza virus in differentiated primary FTE cells. The experiment was done in triplicate with cells from three individual animals. Cells were infected apically with virus at an MOI of 0.01. Cell supernatants were collected at the indicated time points from both apical and basolateral sides of the monolayer, and virus titers were determined by plaque assay. Values represent the mean of three independent wells with the standard deviation indicated. (A) Replication kinetics of influenza virus (both apical and basolateral sides). (B) Assessment of virus recovered from either apical or basolateral side. (C) Evaluation of the integrity of the infected monolayer and the presence of ciliated cells. FTE cells were infected with virus at an MOI of 0.01 and fixed at 120 h p.i. Cells were stained to identify influenza virus NP (yellow) and ciliated cells (tubulin, green) (×100). A white asterisk indicates the damaged area of the monolayer. (D) Determination of cell death during influenza virus infection in differentiated FTE cells. Cells were infected apically with virus at an MOI of 1, and the cell lysates and supernatants were analyzed to determine the level of apoptosis and necrosis, respectively. Values (absorbance) represent the mean of three independent treatments with standard deviation indicated. Significantly higher necrosis induced by VN/1203 virus is noted (*, P < 0.01).
Fig 7
Fig 7
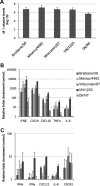
Evaluation of host immune mediator expression to influenza virus infection in differentiated primary FTE cells. The experiment was done in triplicate with cells from three individual animals. Cells were infected apically with virus at an MOI of 1, and RNA was extracted at 24 h p.i. and examined by real-time PCR. (A) Expression of M1 viral gene in infected cells. (B and C) Expression of immune mediator genes during influenza virus infection. Values represent the mean of three independent treatments with the standard deviation indicated.
Fig 8
Fig 8
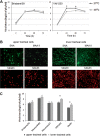
Evaluation of virus replication at different temperature and in FTE cells derived from different portion of trachea. (A) Comparison of virus replication at 37 and 33°C. Asterisks indicate statistically significant differences in virus titer between the two temperatures. (B) Staining of lectins (green) and tubulin (red) on FTE cells isolated from the upper half and lower half of the trachea (×100). DAPI staining showed monolayers with similar confluences for these cultures (data not shown). (C) Comparison of virus replication in upper and lower FTE cells. The images shown represent three individual ferrets. The significance is noted (*, P < 0.05) in virus titers of avian viruses between upper and lower tracheal cells.

Similar articles

Cited by

References

    1. Monto AS, Gravenstein S, Elliott M, Colopy M, Schweinle J. 2000. Clinical signs and symptoms predicting influenza infection. Arch. Intern. Med. 160:3243–3247 - PubMed
    1. Shinya K, Ebina M, Yamada S, Ono M, Kasai N, Kawaoka Y. 2006. Avian flu: influenza virus receptors in the human airway. Nature 440:435–436 - PubMed
    1. Abdel-Ghafar AN, Chotpitayasunondh T, Gao Z, Hayden FG, Nguyen DH, de Jong MD, Naghdaliyev A, Peiris JS, Shindo N, Soeroso S, Uyeki TM. 2008. Update on avian influenza A (H5N1) virus infection in humans. N. Engl. J. Med. 358:261–273 - PubMed
    1. de Jong MD, Simmons CP, Thanh TT, Hien VM, Smith GJ, Chau TN, Hoang DM, Chau NV, Khanh TH, Dong VC, Qui PT, Cam BV, do Q Ha, Guan Y, Peiris JS, Chinh NT, Hien TT, Farrar J. 2006. Fatal outcome of human influenza A (H5N1) is associated with high viral load and hypercytokinemia. Nat. Med. 12:1203–1207 - PMC - PubMed
    1. Baum LG, Paulson JC. 1990. Sialyloligosaccharides of the respiratory epithelium in the selection of human influenza virus receptor specificity. Acta Histochem. Suppl. 40:35–38 - PubMed

MeSH terms

LinkOut - more resources