

MRI manifestations of persistent microvascular obstruction and acute left ventricular remodeling in an experimental reperfused myocardial infarction
- PMID: 23256056
- PMCID: PMC3496497
- DOI: 10.3978/j.issn.2223-4292.2011.12.02
MRI manifestations of persistent microvascular obstruction and acute left ventricular remodeling in an experimental reperfused myocardial infarction
Abstract
Purpose: To investigate varied manifestations of persistent microvascular obstruction (PMO) and acute left ventricular (LV) remodeling in an experimental reperfused myocardial infarction (MI) using MRI.
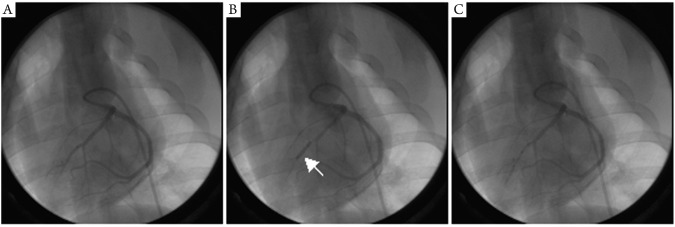
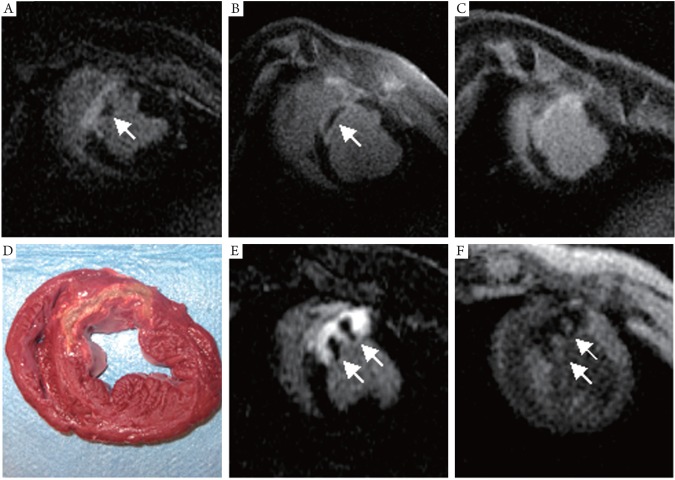
Methods: In eleven Yorkshire pigs an acute MI was produced through a 90-minute balloon occlusion of the middle left anterior descending coronary artery, followed by reperfusion. All animals underwent MRI examinations on a 1.5T system including a SSFP functional study, first pass myocardial perfusion (FPMP), T1 preparation Look-Locker and delayed contrast-enhanced MRI (DE-MRI). Imaging was performed immediately post-intervention (day 0) and at days 7-9. In four animals a repeat MRI examination was performed at day 2 as well. Upon study completion, animals underwent histological analysis including infarct assessment with triphenyltetrazolium chloride (TTC).
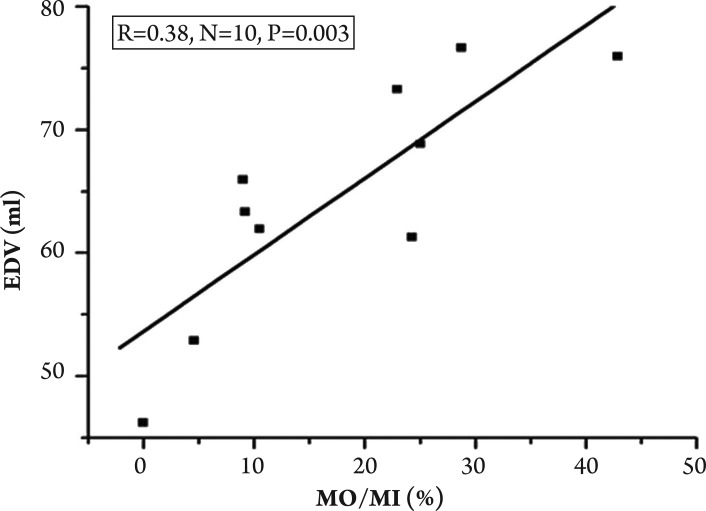
Results: Following reperfusion, Thrombolysis In Myocardial Infarction (TIMI) Flow grade 3 was achieved in all animals, demonstrated by repeat angiography following balloon deflation (day 0). Various MR appearances of PMO were noticed including predominance in the subendocardial region, a central core within the infarcted tissue and also multiple separate clusters. In ten of eleven animals PMO was demonstrated as a persistent hypo-enhanced area in FPMP and DE-MRI, and identified as bright regions in later T1 difference images. In one animal PMO was identified only at day 2. At day 7-9 PMO could be identified on early DE-MRI at 5-15 minutes post Gd injection but not on late DE-MRI and T1 difference images after 45-60 minutes post-contrast. A larger volume of PMO and MI at day 2 was noted in comparison to data from day 0 but the difference was not statistically significant. An increased end-diastolic LV volume (EDV) without changes in end-systolic LV volume (ESV) and LV mass at end-diastolic phase (LVM) was observed at day 7-9 in comparison to data from day 0. There was good correlation between the relative extent of persistent MO in the infarcted myocardium (% MO/MI) and EDV at day 7-9 (r=0.83, n=10, P=0.003). MI was confirmed in all animals by TTC staining and/or histology.
Conclusion: A variable MR appearance of persistent microvascular obstruction is observed during a short time course MRI study of reperfused acute MI. Acute negative LV remodeling was closely related to the relative extent of persistent microvascular obstruction within the infarct myocardium.
Keywords: Microvascular obstruction; T1 difference image; contrast-enhanced MRI; left ventricular remodeling.
Conflict of interest statement
No potential conflict of interest.
Figures
References
-
- Kloner RA. Foreword-No-reflow: Basic science to a clinical phenomenon. Basic Res Cardiol. 2006;10:357–8.
-
- Luo AK, Wu KC. Imaging microvascular obstruction and its clinical significance following acute myocardial infarction. Heart Fail Rev. 2006;11:305–12. - PubMed
-
- Reffelmann T, Kloner RA. The no-reflow phenomenon: A basic mechanism of myocardial ischemia and reperfusion. Basic Res Cardiol. 2006;101:359–72. - PubMed
-
- Young JJ, Cox DA, Stuckey T, et al. Prospective, multicenter study of thrombectomy in patients with acute myocardial infarction: the X-Tract AMI registry. J Interv Cardiol. 2007;20:44–50. - PubMed
LinkOut - more resources
Full Text Sources