. 2013 Jan;123(1):469-78.
doi: 10.1172/JCI64209. Epub 2012 Dec 21.

p62 links β-adrenergic input to mitochondrial function and thermogenesis

Affiliations

p62 links β-adrenergic input to mitochondrial function and thermogenesis

Timo D Müller et al. J Clin Invest. 2013 Jan.

Abstract

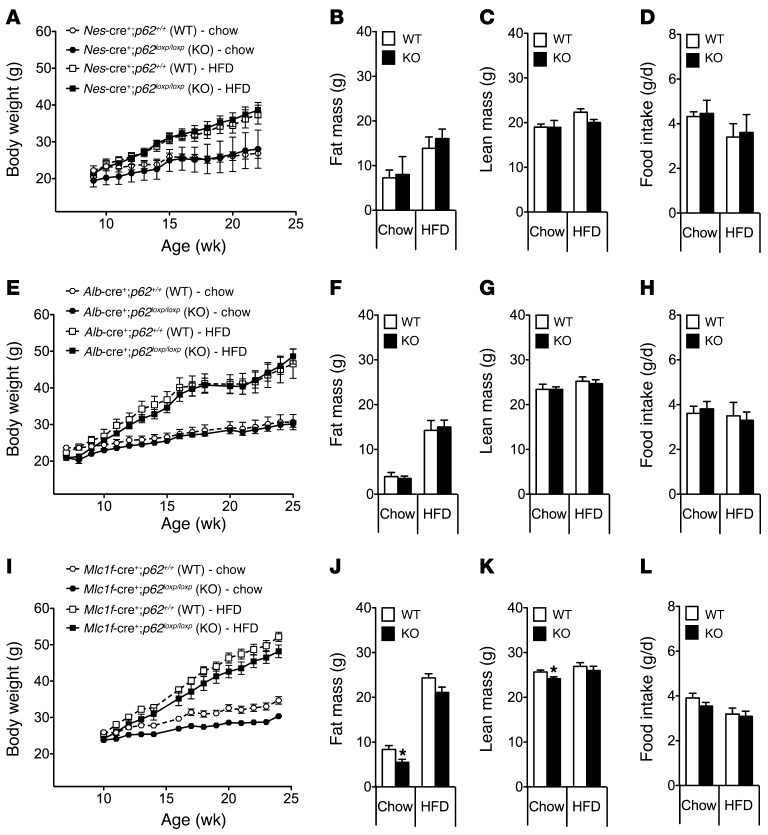
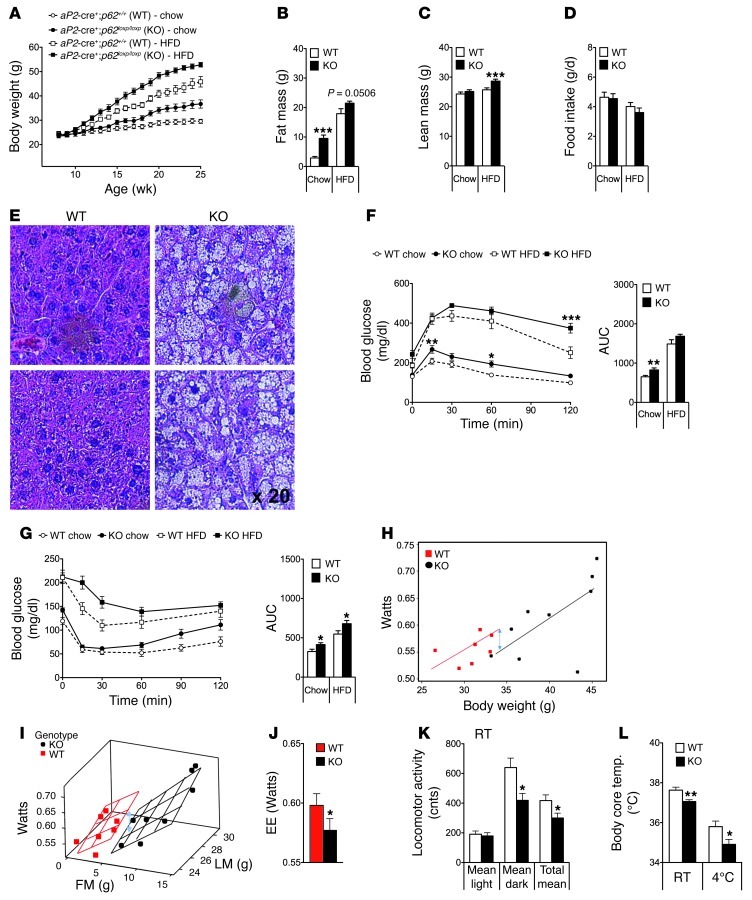
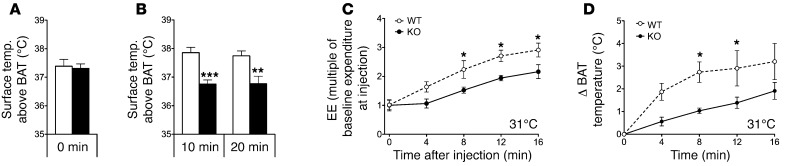
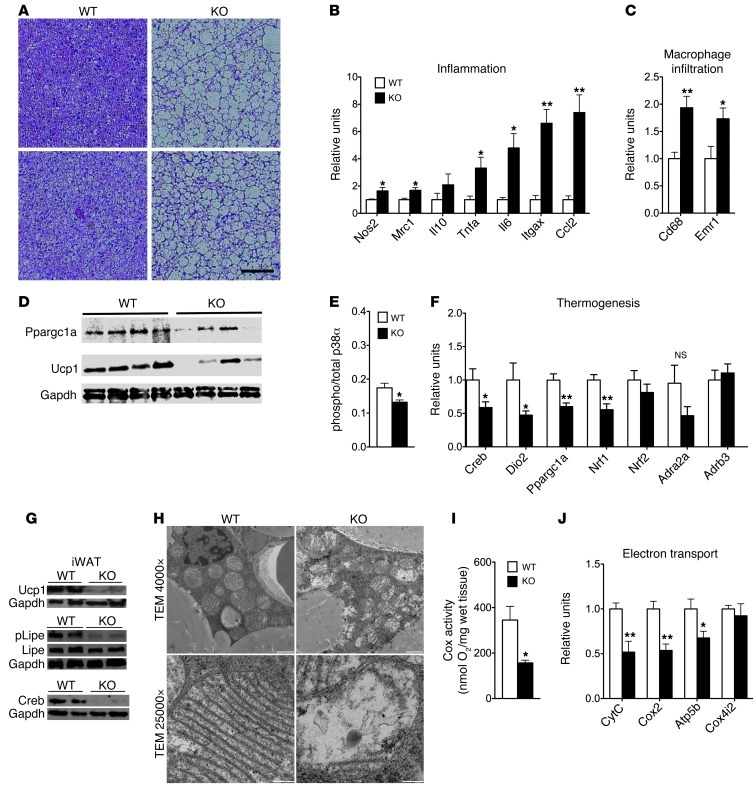
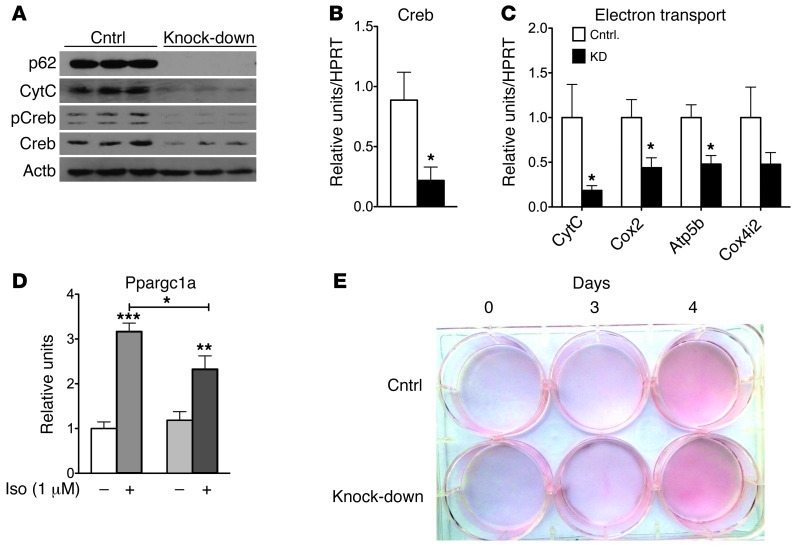
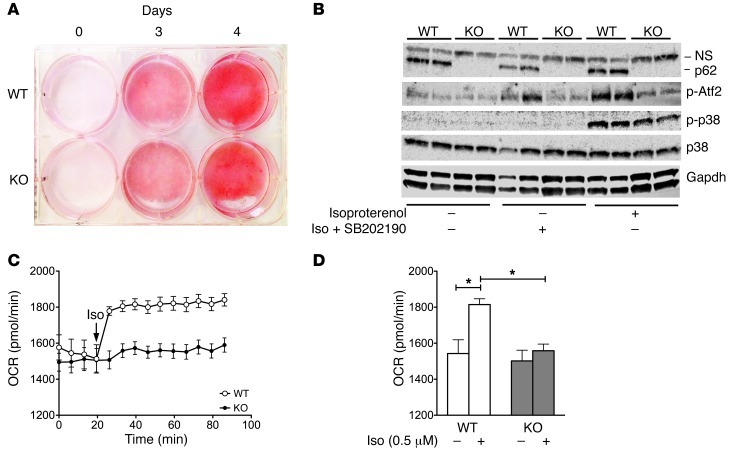
The scaffold protein p62 (sequestosome 1; SQSTM1) is an emerging key molecular link among the metabolic, immune, and proliferative processes of the cell. Here, we report that adipocyte-specific, but not CNS-, liver-, muscle-, or myeloid-specific p62-deficient mice are obese and exhibit a decreased metabolic rate caused by impaired nonshivering thermogenesis. Our results show that p62 regulates energy metabolism via control of mitochondrial function in brown adipose tissue (BAT). Accordingly, adipocyte-specific p62 deficiency led to impaired mitochondrial function, causing BAT to become unresponsive to β-adrenergic stimuli. Ablation of p62 leads to decreased activation of p38 targets, affecting signaling molecules that control mitochondrial function, such as ATF2, CREB, PGC1α, DIO2, NRF1, CYTC, COX2, ATP5β, and UCP1. p62 ablation in HIB1B and BAT primary cells demonstrated that p62 controls thermogenesis in a cell-autonomous manner, independently of brown adipocyte development or differentiation. Together, our data identify p62 as a novel regulator of mitochondrial function and brown fat thermogenesis.


Figures

Figure 1
Figure 1. Mice with tissue-specific deletion of p62 in the CNS, liver, or skeletal muscles do not show a metabolically relevant phenotype.
Body weight, body composition (fat and lean tissue mass), and food intake of male mice that lack p62 selectively in the CNS (AD), the liver (EH), or the skeletal muscles (IL). Fat and lean tissue mass was measured at an age of 23 weeks (A), 22 weeks (B), or 24 weeks (C). n = 8–10 mice each group. Data represent mean ± SEM. *P < 0.05.
Figure 2
Figure 2. Metabolic phenotype of adipocyte-specific p62–/– mice.
Body weight (A), body composition at an age of 26 weeks (B and C), and food intake (D) of adipocyte-specific p62–/– and control mice fed either with a standard chow diet (5.6% fat) or HFD (58% kcal fat). H&E staining of liver samples from 35-week-old chow-fed adipocyte-specific p62–/– and WT mice (E). Glucose tolerance (F) and insulin sensitivity (G) of 17-week-old chow-fed adipocyte-specific p62–/– and WT mice. Energy expenditure (EE). (HJ) and locomotor activity (K) of 33-week-old chow-fed adipocyte-specific p62–/– and WT mice at room temperature (23 ± 2°C). Body core temperature of 35-week-old chow-fed adipocyte-specific p62–/– and WT mice at room temperature and during acute cold exposure (16 hours at 4°C) (L). n = 7–11 mice each group. Data represent mean ± SEM. *P < 0.05; **P < 0.01; ***P < 0.001.
Figure 3
Figure 3. Impaired response to β-adrenergic receptor stimulation in adipocyte-specific p62–/– mice.
Body surface temperature above the BAT, measured with an IR camera, of obese adipocyte-specific p62–/– mice before (A) and after (B) i.p. treatment with CL-316,243 (0.6 mg/kg). Measurement of energy expenditure (expressed as multiple of baseline expenditure at injection) (C) and increase of BAT temperature (measured using implanted temperature sensors) at different time points after s.c. treatment with norepinephrine (1 mg/kg) (D). n = 7–11 mice per group (A and B); n = 4 mice each group (C and D). Data represent mean ± SEM. *P < 0.05; **P < 0.01; ***P < 0.001.
Figure 4
Figure 4. Impaired mitochondrial function in BAT of chow-fed adipocyte-specific p62–/– mice.
H&E staining of BAT (A). Expression of genes related to inflammation (B) and macrophage infiltration (C) in BAT. Western blot analysis of Ppargc1a and Ucp1 (D) and ratio between levels of total and phosphorylated levels of p38α in BAT (E). Expression of genes related to thermogenesis (F). Western blot analysis of Ucp1, Lipe, and Creb in the inguinal WAT (G). Electron micrograph of brown adipocytes (H), Cox activity (I), and mRNA expression levels of genes related to mitochondrial electron transport (J) in BAT of adipocyte-specific p62–/– and WT mice. Cox4i2, COX subunit 4b. Measurement of gene expression was performed in n = 7–8 mice of each genotype. Cox activity and protein levels of p38α were assessed in n = 4 mice of each genotype. Scale bars: 25 μm (A); 1 μm (H, original magnification ×4,000); 200 nm (H; original magnification, ×25,000. Data represent mean ± SEM. *P < 0.05; **P < 0.01.
Figure 5
Figure 5. Cell autonomous effect of p62 on mitochondrial function in HIB1B cells.
Western blot analysis of p62, CytC,and total and phosphorylated Creb (A) and mRNA level of Creb (B) and genes related to mitochondrial electron transport (C) in HIB1B cells lacking p62 and controls. mRNA levels of Ppargc1a in p62-deficient HIB1B cells after 6 hours stimulation with isoproterenol (1 μM) (D). Oil red O staining in p62-deficient HIB1B cells (E). *P < 0.05; **P < 0.01; ***P < 0.001.
Figure 6
Figure 6. Cell autonomous effect of p62 on mitochondrial function in BAT primary cells.
Oil red O staining in p62-deficient BAT primary cells obtained from global p62–/– and WT control mice (A). Western blot analysis of p62, p38, and phosphorylated levels of p38 and Atf2 in 5-day–differentiated BAT primary cells treated for 30 minutes with isoproterenol (0.5 μM) or pretreated for 30 minutes with the p38 inhibitor SB202190 (10 μM) followed by 30 minutes treatment of isoproterenol (0.5 μM) plus SB202190 (10 μM) (B). Measurement of OCR of 2-day–differentiated BAT primary cells obtained from global p62–/– mice and WT controls in response to isoproterenol (0.5 μM) (C and D). *P < 0.05.

References

    1. Cannon B, Nedergaard J. Brown adipose tissue: function and physiological significance. Physiol Rev. 2004;84(1):277–359. doi: 10.1152/physrev.00015.2003. - DOI - PubMed
    1. Kajimura S, Seale P, Spiegelman BM. Transcriptional control of brown fat development. Cell Metab. 2010;11(4):257–262. doi: 10.1016/j.cmet.2010.03.005. - DOI - PMC - PubMed
    1. Cypess AM, et al. Identification and importance of brown adipose tissue in adult humans. N Engl J Med. 2009;360(15):1509–1517. doi: 10.1056/NEJMoa0810780. - DOI - PMC - PubMed
    1. Nedergaard J, Bengtsson T, Cannon B. Unexpected evidence for active brown adipose tissue in adult humans. Am J Physiol Endocrinol Metab. 2007;293(2):E444–E452. doi: 10.1152/ajpendo.00691.2006. - DOI - PubMed
    1. van Marken Lichtenbelt WD, et al. Cold-activated brown adipose tissue in healthy men. N Engl J Med. 2009;360(15):1500–1508. doi: 10.1056/NEJMoa0808718. - DOI - PubMed

MeSH terms

Substances