Randomized Controlled Trial
. 2013;161(1):65-73.
doi: 10.1159/000343031. Epub 2012 Dec 14.

Sputum hyaluronan and versican in severe eosinophilic asthma

Affiliations
Randomized Controlled Trial

Sputum hyaluronan and versican in severe eosinophilic asthma

Andrew G Ayars et al. Int Arch Allergy Immunol. 2013.

Abstract

Background: We examined levels of hyaluronan, a matrix glycosaminoglycan and versican, a matrix proteoglycan, in the sputum of asthmatics treated with mepolizumab (anti-IL-5 monoclonal antibody) versus placebo to evaluate the utility of these measurements as possible biomarkers of asthma control and airway remodeling.

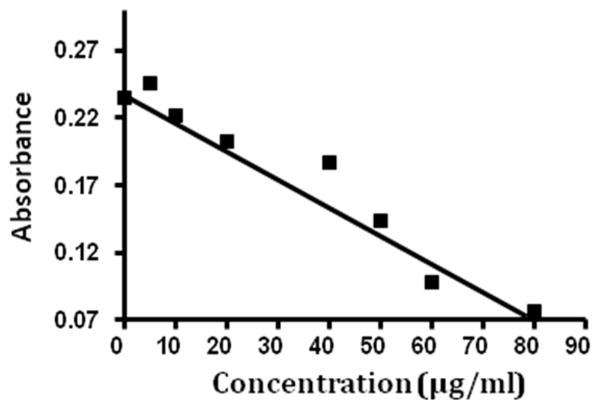
Methods: Patients with severe, prednisone-dependent asthma received either mepolizumab or placebo as described in a previously published randomized, double-blind, placebo-controlled study. We measured hyaluronan and versican levels by enzyme-linked immunosorbent assay in sputum collected before and after the 16-week treatment phase. Patients underwent a predefined prednisone tapering schedule if they remained exacerbation free, and sputum eosinophil percentage, asthma control questionnaire (ACQ) and spirometry were monitored.

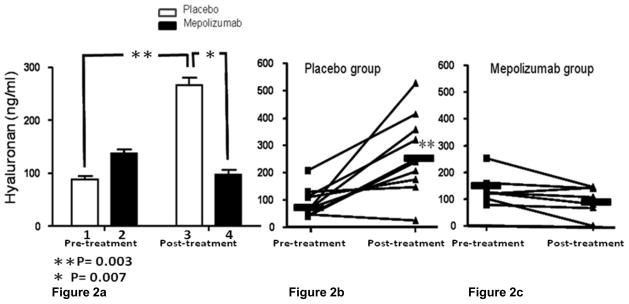
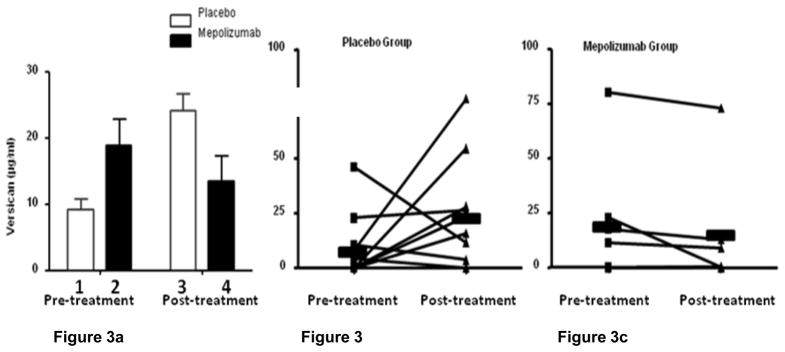
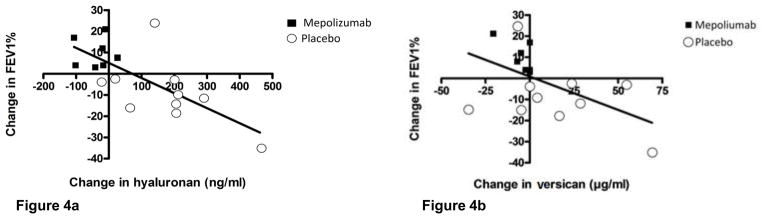
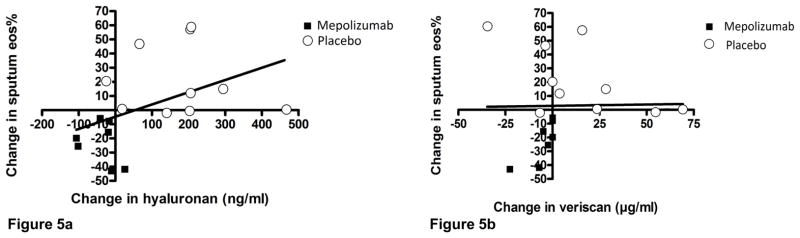
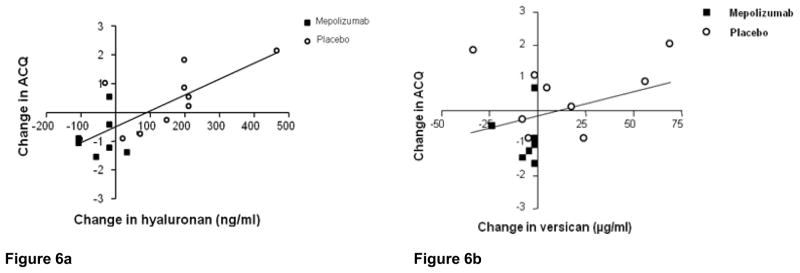
Results: After 6 months of mepolizumab therapy and prednisone tapering, there was a significant increase in sputum hyaluronan in the placebo group compared with baseline (p = 0.003). In contrast, there was a significant decrease in sputum hyaluronan in the active treatment group compared with placebo (p = 0.007), which correlated with improvements in percent forced expiratory volume in 1 s (FEV1%) (p = 0.001) and ACQ scores (p = 0.009) as well as a decrease in sputum eosinophils (p = 0.02). There was a nonsignificant increase in sputum versican in the placebo group (p = 0.16), a decrease in the mepolizumab group (p = 0.13) and a significant inverse correlation between versican reduction and FEV1% improvement (p = 0.03).

Conclusions: Sputum hyaluronan values are reduced with mepolizumab therapy and correlate with improved clinical and spirometry values, suggesting this measurement may serve as a noninvasive biomarker of asthma control.


Figures

Figure 1
Figure 1
This representative standard curve was developed using known versican concentrations within the range of 0–80 μg/ml; y=0.234 +−0.002(x).
Figure 2
Figure 2
Figure 2a. Mean sputum hyaluronan concentrations in placebo and mepolizumab treated patients before and at the end of the treatment period. There was no significant difference in mean sputum hyaluronan between groups before treatment (mepolizumab= 136.50 ± SE= 21.44 ng/ml vs. placebo= 88.48 ± SE= 16.68 ng/ml; P=0.09). From the beginning to the end of the treatment period there was a significant increase in mean sputum hyaluronan in the placebo group (pre-treatment= 88.48 ± SE= 16.68 ng/ml vs. post-treatment= 266.60 ± SE=45.51 ng/ml; P= 0.003). There was significantly more post-treatment sputum hyaluronan in the placebo specimens compared to the mepolizumab specimens (mepolizumab= 97.73 ± SE=20.18 ng/ml vs. placebo= 266.60 ± SE=45.51 ng/ml; P=0.007). There was a numerical but non-significant decrease in sputum hyaluronan in the mepolizumab treated group (pre-treatment= 136.50 ± SE= 21.44 ng/m vs. post-treatment = 97.73 ± SE= 20.18; P= 0.08). Figure 2b and 2c- show individual patient sputum hyaluronan values in the placebo and mepoliuzumab treated groups pre and post treatment.
Figure 3
Figure 3
Figure 3a. Mean sputum versican concentrations in placebo and mepolizumab treated patients before and at the end of the treatment period. There was no significant difference in mean sputum versican levels before (Fig 3a, bars 1 and 2; mepolizumab= 18.83 ± SE 10.80 μg/ml vs. placebo= 9.27 ± SE 4.75 μg/ml; P=0.38) or after treatment (Fig 3a, bars 3 and 4; mepolizumab= 13.51 ± SE 10.12 μg/ml vs. placebo= 24.17 ± SE 7.89 μg/ml, P=0.19). From the beginning to the end of the treatment period there was not a significant difference in mean sputum versican concentration in the placebo treated patients (Fig 3a, bars 1 and 3; pre-treatment= 9.27 ± SE 4.75 μg/ml vs. post-treatment= 24.17 ± 24.95 μg/ml; P= 0.16) or the mepolizumab group (Fig 3a bars 2 and 4; pre-treatment= 18.83 ± SE 10.81 μg/ml vs. post-treatment= 13.51 ± SE 10.12 μg/ml; P=0.13). Figure 3b and 3c show individual patient sputum versican values in the placebo and mepoliuzumab treated groups pre and post treatment.
Figure 4
Figure 4
Figure 4a. Linear regression showing a significant inverse relationship between change in sputum hyaluronan concentration and change in FEV1% between the beginning and end of the study (P= 0.006). Figure 4b- Similar analysis showing a significant inverse relationship between change in sputum vesican concentration and change in FEV1% (P=0.03).
Figure 5
Figure 5
Figure 5a. Linear regression showing change in sputum hyaluronan concentration and change in sputum Eos% over the course of the study (P= 0.02). Figure 5b- Similar analysis of relationship between change in sputum versican and change in sputum Eos% (P= 0.23).
Figure 6
Figure 6
Figure 6a. Linear regression showing change in sputum hyaluronan concentration and change in ACQ over the course of the study (P= 0.009). Of note, only 9 of 10 subjects were included in this analysis because one subject did not have ACQ data documented. Figure 6b- Similar analysis of relationship between change in sputum versican and change in ACQ over the course of the study which was not significant (P= 0.273).

References

    1. Johnson PR, Burgess JK. Airway smooth muscle and fibroblasts in the pathogenesis of asthma. Curr Allergy Asthma Rep. 2004;4(2):102–8. - PubMed
    1. Parameswaran K, Willems-Widyastuti A, Alagappan VK, Radford K, Kranenburg AR, Sharma HS. Role of extracellular matrix and its regulators in human airway smooth muscle biology. Cell Biochem Biophys. 2006;44(1):139–46. - PubMed
    1. Yamauchi K, Inoue H. Airway remodeling in asthma and irreversible airflow limitation-ECM deposition in airway and possible therapy for remodeling- Allergol Int. 2007;56(4):321–9. - PubMed
    1. Fraser JR, Laurent TC, Laurent UB. Hyaluronan: its nature, distribution, function and turnover. J Intern Med. 1997;242(10):27–33. - PubMed
    1. Day AJ, Prestwich GD. Hyaluronan-binding proteins: tying up the giant. Biol Chem. 2002;277(7):4585–8. - PubMed

Publication types

MeSH terms