Clinical Trial
. 2013 Apr;48(4):422-30.
doi: 10.1165/rcmb.2012-0335OC.

Matrices of physiologic stiffness potently inactivate idiopathic pulmonary fibrosis fibroblasts

Affiliations
Clinical Trial

Matrices of physiologic stiffness potently inactivate idiopathic pulmonary fibrosis fibroblasts

Aleksandar Marinković et al. Am J Respir Cell Mol Biol. 2013 Apr.

Abstract

Fibroblasts from patients with idiopathic pulmonary fibrosis (IPF) have been shown to differ from normal lung fibroblasts in functional behaviors that contribute to the pathogenesis of IPF, including the expression of contractile proteins and proliferation, but how such behaviors vary in matrices with stiffness matched to normal and fibrotic lung tissue remains unknown. Here, we tested whether pathologic changes in matrix stiffness control IPF and normal lung tissue-derived fibroblast functions, and compared the relative efficacy of mechanical cues to an antifibrotic lipid mediator, prostaglandin E(2) (PGE(2)). Fibroblasts were grown on collagen I-coated glass or hydrogel substrates of discrete stiffnesses, spanning the range of normal and fibrotic lung tissue. Traction microscopy was used to quantify contractile function. The CyQuant Cell Proliferation Assay (Invitrogen, Carlsbad, CA) was used to assess changes in cell number, and PGE(2) concentrations were measured by ELISA. We confirmed differences in proliferation and PGE(2) synthesis between IPF and normal tissue-derived fibroblasts on rigid substrates. However, IPF fibroblasts remained highly responsive to changes in matrix stiffness, and both proliferative and contractile differences between IPF and normal fibroblasts were ablated on physiologically soft matrices. We also confirmed the relative resistance of IPF fibroblasts to PGE(2), while demonstrating that decreases in matrix stiffness and the inhibition of Rho kinase both potently attenuate contractile function in IPF-derived fibroblasts. We conclude that pathologic changes in the mechanical environment control important IPF fibroblast functions. Understanding how mechanical cues control fibroblast function may offer new opportunities for targeting these cells, even when they are resistant to antifibrotic pharmacological agents or biological mediators.


Figures
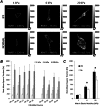
Figure 1.
Figure 1.
Matrix stiffness controls traction generation in idiopathic pulmonary fibrosis (IPF) fibroblasts and normal lung fibroblasts. (A) Representative maps of traction fields from IPF (upper row) and normal (lower row) fibroblasts were obtained in polyacrylamide gel substrates with elastic moduli of 1, 6, and 20 kPa, as indicated in each image. Grayscale traction magnitudes (in Pa) are shown next to the maps. Root–mean–square tractions (RMSTs) were calculated for each traction field, and are shown on the maps as RMST values. Scale bar = 100 μm. (B) RMSTs were computed from the traction fields of primary human lung fibroblasts derived from fibrotic (IPF) or normal (NL) lung tissue and grown on substrates resembling normal (1 kPa, white), or fibrotic (6 kPa, light gray; 20 kPa, dark gray) stiffness matrices. Increasing matrix stiffness promoted the generation of traction, regardless of cell source. Data represent the mean ± SD from 15 cells per source per stiffness condition. (C) RMSTs were averaged across disease state for each matrix-stiffness condition, from the data presented in B. Asterisks mark statistically significant differences in RMSTs between IPF and normal cells under the indicated matrix-stiffness conditions (*P < 0.05, two-tailed t test). Data represent the mean ± SD.
Figure 2.
Figure 2.
Matrix stiffness controls the proliferation of IPF and normal lung fibroblasts. (A) Percent changes in cell number over 72 hours after seeding. Fibroblasts derived from fibrotic (IPF) or normal (NL) lung tissue were initially seeded at a density of 25 cells/mm2 on the polyacrylamide gels with elastic moduli of 1 kPa (white), 6 kPa (light gray), and 20 kPa (dark gray), or glass (black). Data represent the mean ± SD from three independent measurements for each cell source and stiffness condition. (B) Percent changes in cell number were averaged within the disease state for each stiffness condition, from the data presented in A. Asterisks are used to label either statistically significant differences in cell accumulation between IPF and normal fibroblasts on glass (*P < 0.05, two-tailed t test), or no significant difference in accumulation rates between IPF cells grown on 20-kPa polyacrylamide (PA) gels and glass (ΔP = 0.37, two-tailed t test). Data represent the mean ± SD.
Figure 3.
Figure 3.
IPF fibroblasts exhibit diminished production of prostaglandin E2 (PGE2), but increased production on physiological stiffness matrices. (A) PGE2 concentrations in IPF and normal fibroblast cell culture supernatants were normalized to corresponding cell numbers. Cells were grown for 72 hours on the PA gels with elastic moduli of 1 kPa (white), 6 kPa (light gray), and 20 kPa (dark gray), or glass (black). Data represent the mean ± SD from three independent measurements for each fibroblast source and stiffness condition. (B) PGE2 concentrations were averaged across disease state for each matrix stiffness condition, from data presented in A. Under the indicated stiffness conditions, asterisks mark statistically significant differences in measured average PGE2 concentrations between fibroblasts from normal and diseased lungs (*P value < 0.05, two-tailed t test). Data represent the mean ± SD.
Figure 4.
Figure 4.
PGE2 more potently attenuates the traction generation of normal compared with IPF fibroblasts on fibrotic stiffness matrices. (A) Two-hour PGE2 dose–response effect on RMST changes, relative to time zero baseline for one fibrotic (IPF-14) and one normal (NL-43) fibroblast line grown on 6-kPa gels. Data represent the mean ± SD of 10 cells per dose for each fibroblast source. (B) Time course of average RMST changes from time zero baselines after the addition of 5 μM PGE2 (solid line) and without treatment (dashed line), measured in one IPF (top) and one normal (bottom) fibroblast line grown on PA gels with elastic moduli of 6 kPa. For each time point, data represent the mean (± SD) RMST change obtained from 10 cells. (C) Drop in RMSTs is shown as the percent change from baseline for each cell, measured 2 hours after treatment with 5 μM PGE2. Fibroblasts derived from fibrotic (IPF) or normal (NL) lungs were grown on PA gel substrates with elastic moduli of 1 kPa (white), 6 kPa (light gray), and 20 kPa (dark gray). #Two-tailed z-test for significant change in RMST. (D) Average RMST drop across disease state for each stiffness condition, from measurements shown in B. Asterisks are used to mark statistically significant difference in RMST drop between IPF and normal fibroblasts under indicated stiffness conditions (P < 0.05, two-tailed t test). Data represent the mean ± SD. (E) Scatterplot compares the effects on RMST of 5 μM PGE2 and changes in substrate stiffness from 6 to 1 kPa. Data points indicate the average percent drop in RMST on 6-kPa gels, 2 hours after treatment with 5 μM PGE2, versus percent difference in mean RMST on 6-kPa and 1-kPa gels for each fibroblast source (normal [NL] fibroblasts, open squares; IPF, solid triangles). (F) Difference in real-time PCR cycle threshold (ΔCt) values of E prostanoid (EP) receptor genes PTGER2 (EP2) and PTGER4 (EP4), referenced to glyceraldehyde 3–phosphate dehydrogenase Ct values. Data represent the mean ± SD of three IPF and three normal fibroblast lines. (G) PTGER2 transcript levels in each IPF fibroblast line were normalized to average transcript levels in three normal lung fibroblast lines. Asterisks mark statistically significant differences in PTGER2 mRNA concentrations, compared with the average transcript level in normal fibroblast lines (P < 0.05, two-tailed z-test). Data represent the mean ± SD of two independent experiments.
Figure 5.
Figure 5.
PGE2 more potently inhibits normal compared with IPF fibroblast proliferation on a rigid matrix. The difference is attenuated on softer matrices. (A) Effect of 72-hour PGE2 dose on change in cell numbers, relative to mean cell number in untreated control samples observed for one fibrotic (IPF-14) and one normal (NL-43) fibroblast line grown on 6-kPa gels. Data represent the mean ± SD of four independent cell counts for each point, relative to the average of four cell counts in untreated control samples. (B) Percent change in cell numbers, 72 hours after treatment with 1 μM PGE2. Data were obtained from three independent cell counts for each of five IPF and four normal fibroblast sources (not shown), and present the average (± SD) change in cell numbers relative to untreated control samples across disease state for each stiffness condition. The asterisk marks a statistically significant difference in average cell number change between IPF and normal lung fibroblasts under indicated stiffness conditions (*P < 0.05, two-tailed t test). (C) Scatterplot compares the effects of 1 μM PGE2 and changes in substrate stiffness on changes in cell number. Data points indicate average percent changes in cell numbers on 6-kPa gels, 72 hours after treatment with 1 μM PGE2, relative to untreated control values, versus percent differences between mean cell number changes on 6-kPa and 1-kPa gels for each fibroblast source.
Figure 6.
Figure 6.
Rho kinase inhibitor robustly diminishes IPF and normal fibroblast tractions. (A) Average RMST change time course was measured after the addition of 10 μM Y-27632 (solid line) or without treatment (dashed line), relative to time zero baseline, in one IPF (top) and one normal (bottom) fibroblast line grown on PA gels with elastic moduli of 6 kPa. For each time point, data represent the mean (± SD) RMST change measured in 20 cells. (B) Immunofluorescence staining of phosphorylated myosin light chain (pMLC; left column) in representative IPF (top two rows) and normal (bottom two rows) fibroblasts cultured for 24 hours on 6-kPa PA substrates, and then treated for 2 hours with or without 10 μM Y-27632. F-actin (right column) was labeled with Alexa Fluor–conjugated phalloidin. Scale bars = 50 μm. (C) RMST change relative to time zero baseline was measured 2 hours after 10 μM Y-27632 treatment. Data represent the mean ± SD from 20 cells for each fibroblast source seeded on 6-kPa PA gels. (D) Effects of 10 μM Y-27632 and 5 μM PGE2 for 2 hours on RMST changes in 6-kPa gels, measured in the subset of IPF and normal lung fibroblast lines presented in B. Data represent the mean ± SD within disease conditions. The asterisk indicates a statistically significant difference in RMST change between IPF and normal lung fibroblasts (*P < 0.05, two-tailed t test). (E) Scatterplot compares the effects of 10 μM Y-27632 and 5 μM PGE2 on 2-hour RMST change in 6-kPa gels. Data represent the mean ± SD from 20 (Y-27632) or 15 (PGE2) cells. (F) Cell numbers were assessed 72 hours after the addition of 10 μM Y-27632, relative to average cell numbers of untreated cells. Data represent the mean ± SD of four independent measurements on 6-kPa gel substrates for each fibroblast source. (G) Effects of 10 μM Y-27632 and 1 μM PGE2 for 72 hours on cell numbers in 6-kPa gels, assessed in the subset of IPF and normal lung fibroblast lines presented in E. Data represent the mean ± SD within disease conditions. (H) Scatterplot compares the effects of 10 μM Y-27632 and 1 μM PGE2 on cell accumulations, relative to accumulations in untreated control samples, 72 hours after seeding cells. Data represent the mean ± SD from four (Y-27632) or three (PGE2) independent measurements.

Similar articles

Cited by

References

    1. Raghu G, Collard HR, Egan JJ, Martinez FJ, Behr J, Brown KK, Colby TV, Cordier J-F, Flaherty KR, Lasky JA, et al. An official ATS/ERS/JRS/ALAT statement: idiopathic pulmonary fibrosis: evidence-based guidelines for diagnosis and management. Am J Respir Crit Care Med 2011;183:788–824 - PMC - PubMed
    1. Katzenstein AL, Myers JL. Idiopathic pulmonary fibrosis: clinical relevance of pathologic classification. Am J Respir Crit Care Med 1998;157:1301–1315 - PubMed
    1. American Thoracic Society and European Respiratory Society Idiopathic pulmonary fibrosis: Diagnosis and treatment. International consensus statement. Am J Respir Crit Care Med 2000;161:646–664 - PubMed
    1. Hinz B, Phan SH, Thannickal VJ, Galli A, Bochaton-Piallat ML, Gabbiani G. The myofibroblast: one function, multiple origins. Am J Pathol 2007;170:1807–1816 - PMC - PubMed
    1. Hinz B, Phan SH, Thannickal VJ, Prunotto M, Desmouliere A, Varga J, De Wever O, Mareel M, Gabbiani G. Recent developments in myofibroblast biology: paradigms for connective tissue remodeling. Am J Pathol 2012;180:1340–1355 - PMC - PubMed

Publication types

MeSH terms