. 2013 Feb 8;288(6):4066-75.
doi: 10.1074/jbc.M112.427864. Epub 2012 Dec 20.

Ligand-dependent conformational changes in the clamp region of the cardiac ryanodine receptor

Affiliations

Ligand-dependent conformational changes in the clamp region of the cardiac ryanodine receptor

Xixi Tian et al. J Biol Chem. .

Abstract

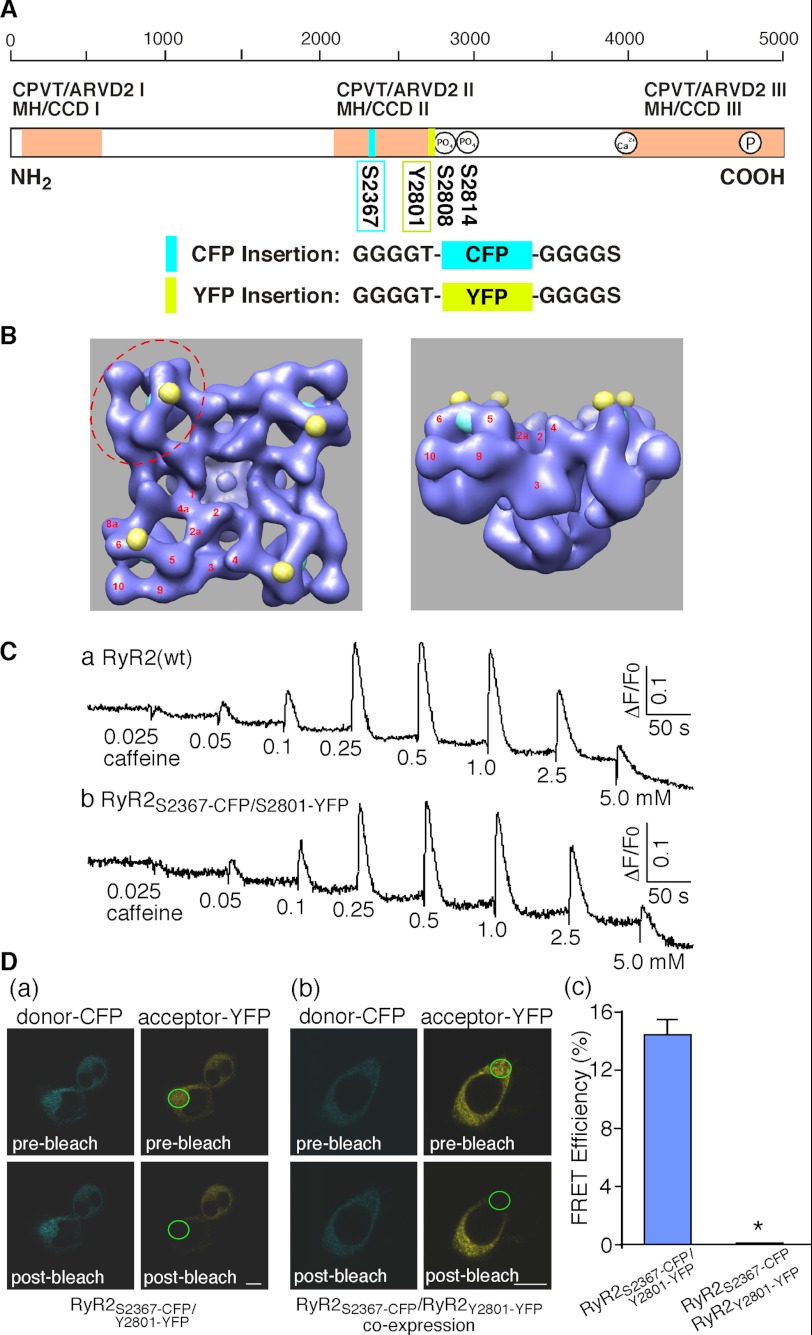
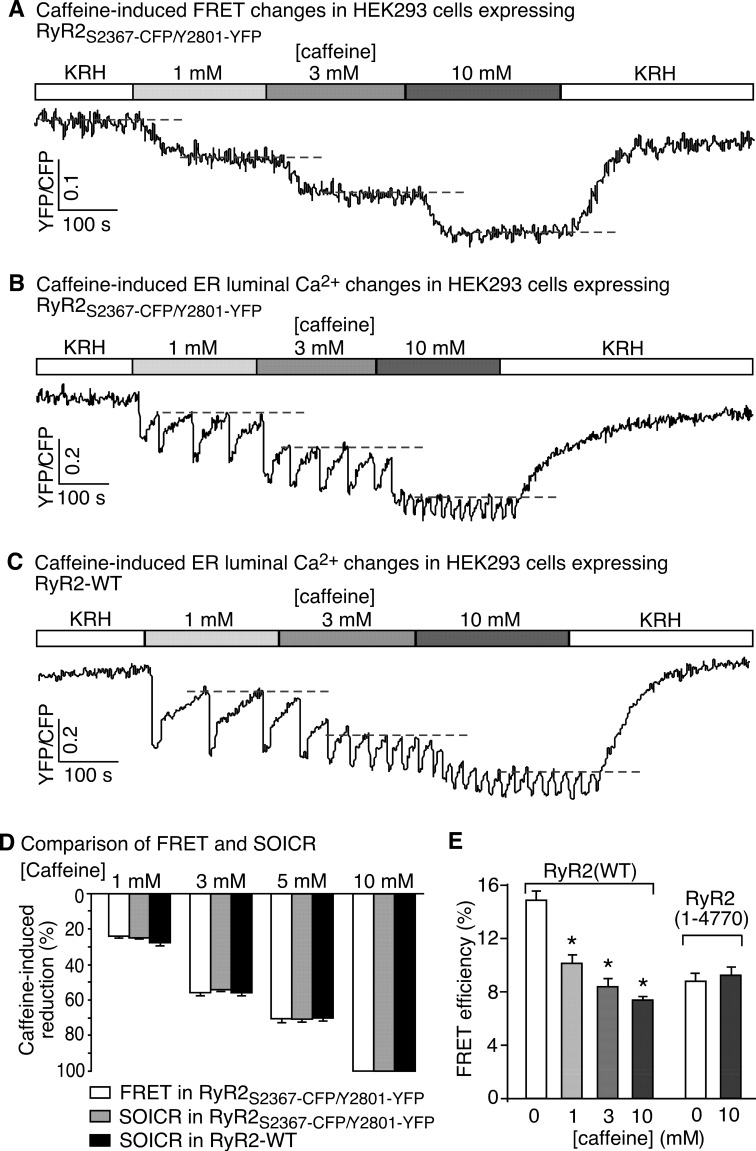
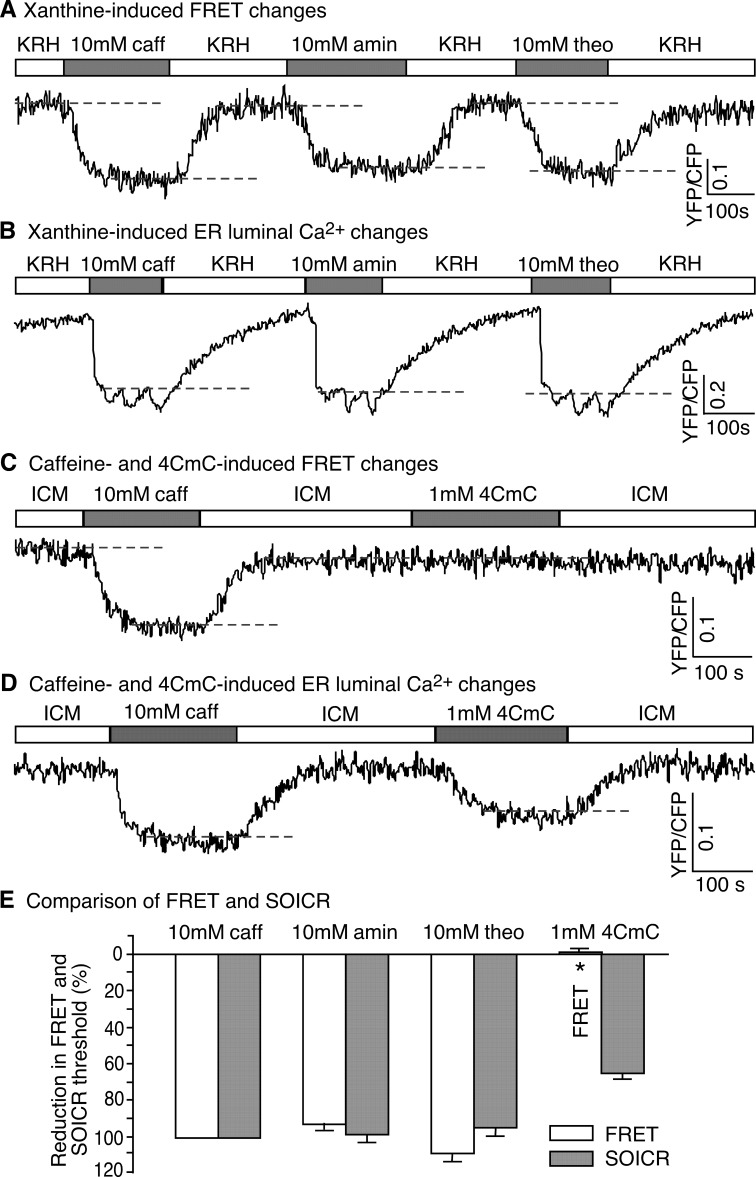
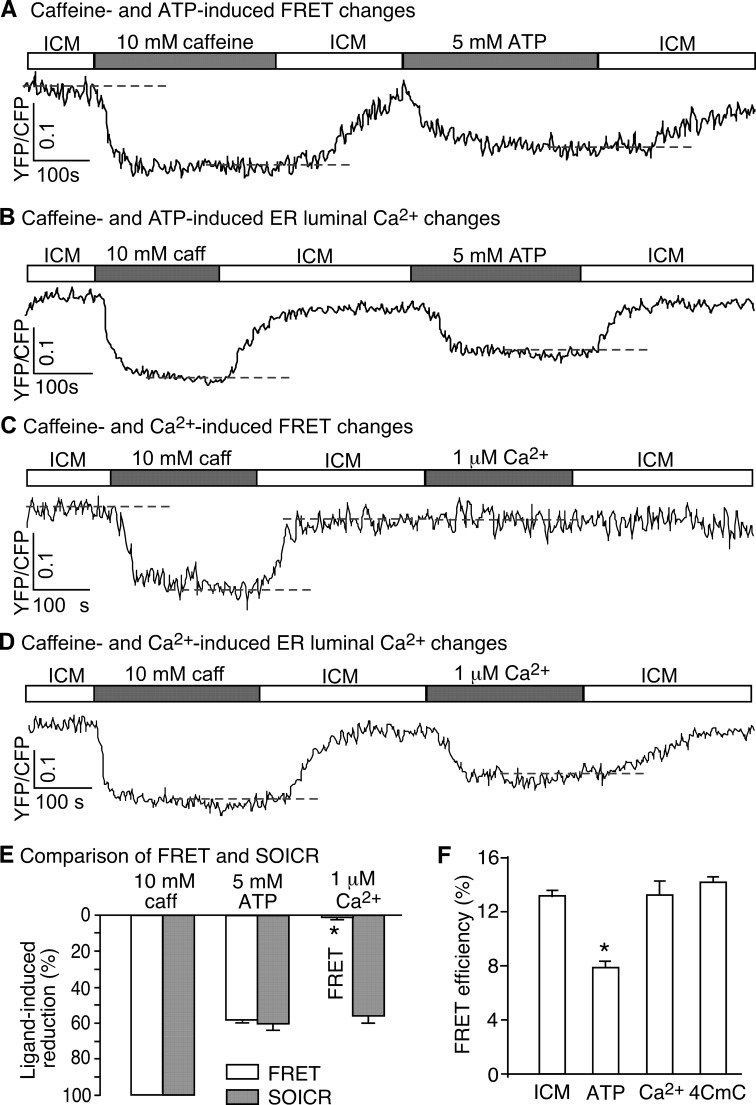
Global conformational changes in the three-dimensional structure of the Ca(2+) release channel/ryanodine receptor (RyR) occur upon ligand activation. A number of ligands are able to activate the RyR channel, but whether these structurally diverse ligands induce the same or different conformational changes in the channel is largely unknown. Here we constructed a fluorescence resonance energy transfer (FRET)-based probe by inserting a CFP after residue Ser-2367 and a YFP after residue Tyr-2801 in the cardiac RyR (RyR2) to yield a CFP- and YFP-dual labeled RyR2 (RyR2(Ser-2367-CFP/Tyr-2801-YFP)). Both of these insertion sites have previously been mapped to the "clamp" region in the four corners of the square-shaped cytoplasmic assembly of the three-dimensional structure of RyR2. Using this novel FRET probe, we monitored the extent of conformational changes in the clamp region of RyR2(Ser-2367-CFP/Tyr-2801-YFP) induced by various ligands. We also monitored the extent of Ca(2+) release induced by the same ligands in HEK293 cells expressing RyR2(Ser-2367-CFP/Tyr-2801-YFP). We detected conformational changes in the clamp region for the ligands caffeine, aminophylline, theophylline, ATP, and ryanodine but not for Ca(2+) or 4-chloro-m-cresol, although they all induced Ca(2+) release. Interestingly, caffeine is able to induce further conformational changes in the clamp region of the ryanodine-modified channel, suggesting that ryanodine does not lock RyR in a fixed conformation. Our data demonstrate that conformational changes in the clamp region of RyR are ligand-dependent and suggest the existence of multiple ligand dependent RyR activation mechanisms associated with distinct conformational changes.


Figures

FIGURE 1.
FIGURE 1.
Construction and characterization of a novel FRET pair Ser-2367-CFP/Tyr-2801-YFP in RyR2. A, a schematic illustration of the linear sequence of RyR (open box) shows the three major hotspots (pink boxes) where disease-causing mutations frequently occur (CPVT, catecholaminergic polymorphic ventricular tachycardia; ARVD2, arrhythmogenic right ventricular dysplasia type 2; MH, malignant hyperthermia; CCD, central core disease). The locations of Ser-2367-CFP (cyan box), Tyr-2801-YFP (yellow box), the Ser-2808 and Ser-2814 phosphorylation sties, the cytosolic Ca2+ sensor, and the pore-forming segment (circles inside the open box) are also indicated. The inserted CFP and YFP are flanked by short glycine-rich linkers. B, shown are locations of Ser-2367-CFP (cyan spheres) and Tyr-2801-YFP (yellow spheres) in the three-dimensional architecture of RyR (left, top view; right, side view) based on the previous three-dimensional reconstructions of the RyR2Ser-2367-GFP and RyR2Tyr-2801-GFP fusion proteins (21, 23). The distance between CFP and YFP is 30 Å. The clamp region (red dashed ellipse) and subdomains (red numbers) are indicated. C, Caffeine induced Ca2+ release in HEK293 cells transfected with RyR2(wt) (a) or RyR2Ser-2367-CFP/Tyr-2801-YFP (b). Transfected HEK293 cells were loaded with fluo-3 AM. The fluorescence intensity of the fluo-3-loaded cells was monitored continuously before and after the sequential additions of increasing concentrations of caffeine (0.025 to 5 mm). D, confocal images show cyan fluorescence of the donor CFP and yellow fluorescence of the acceptor YFP before (top panels) and after (bottom panels) photobleaching of a small area (indicated by a green ellipse) in HEK239 cells transfected with RyR2Ser-2367-CFP/Tyr-2801-YFP (a) or co-transfected with RyR2Ser-2367-CFP and RyR2Tyr-2801-YFP (b) and the corresponding FRET efficiencies (c). The scale bar represents 10 μm. Data shown are the mean ± S.E. (n = 20). *, p < 0.01.
FIGURE 2.
FIGURE 2.
Caffeine induces correlated structural and functional changes in RyR2. A, stable, inducible HEK293 cells expressing RyR2Ser-2367-CFP/Tyr-2801-YFP were perfused with KRH buffer containing increasing levels of caffeine (0–10 mm) to induce conformational changes in RyR2. A representative recording of the Ser-2367-CFP/Tyr-2801-YFP FRET signal from a single HEK293 cell is shown. Changes in the Ser-2367-CFP/Tyr-2801-YFP FRET signal reflect structural changes in the clamp region of RyR2. Dashed lines indicate steady-state FRET levels at different concentrations of caffeine. B, stable, inducible HEK293 cells expressing RyR2Ser-2367-CFP/Tyr-2801-YFP were transfected with the FRET-based ER luminal Ca2+-sensing protein, D1ER. The transfected cells were perfused with KRH buffer containing increasing levels of caffeine (0–10 mm). The trace shows a representative FRET recording from a single HEK293 cell expressing both D1ER and RyR2Ser-2367-CFP/Tyr-2801-YFP. Because the CFP or YFP fluorescence intensity in HEK293 cells expressing RyR2Ser-2367-CFP/Tyr-2801-YFP alone is only ∼10% that in cells expressing both the D1ER luminal Ca2+ sensor and RyR2Ser-2367-CFP/Tyr-2801-YFP, the FRET signals detected largely came from those of D1ER. These D1ER FRET signals reflect the ER luminal Ca2+ levels. Dashed lines indicate the ER luminal Ca2+ levels at which SOICR occurs (i.e. the SOICR threshold), which reflects the functional state of RyR2. C, single cell D1ER FRET imaging of stable, inducible, RyR2(wt)-expressing HEK293 cells were transfected with D1ER at increasing levels of caffeine. Dashed lines indicate SOICR thresholds. D, comparison of caffeine-induced, concentration-dependent changes in the Ser-2367-CFP/Tyr-2801-YFP FRET signal (structural changes) with those in the SOICR threshold (functional changes). The extents of changes in FRET and SOICR at each caffeine concentration were normalized to those at 10 mm caffeine (100%). Data shown are the mean ± S.E. (n = 4–11). There are no significant differences between reductions in FRET and SOICR threshold under each condition. E, the FRET efficiency in HEK293 cells expressing RyR2Ser-2367-CFP/Tyr-2801-YFP or a truncated RyR2, RyR2-(1–4770)Ser-2367-CFP/Tyr-2801-YFP, at various caffeine concentrations (0–10 mm) was determined using the photobleaching method. Data shown are the mean ± S.E. (n = 30) (*, p < 0.05; versus 0 mm caffeine).
FIGURE 3.
FIGURE 3.
Effect of aminophylline, theophylline, and 4-CmC on the structure and function of RyR2. A, HEK293 cells expressing RyR2Ser-2367-CFP/Tyr-2801-YFP were perfused with KRH buffer without or with caffeine (10 mm), aminophylline (10 mm), or theophylline (10 mm). A representative single cell recording of the Ser-2367-CFP/Tyr-2801-YFP FRET signal is shown. Dashed lines indicate steady-state FRET levels. B, shown is a representative single cell luminal Ca2+ recording of D1ER-transfected HEK293 cells expressing RyR2Ser-2367-CFP/Tyr-2801-YFP in the KRH buffer without or with caffeine, aminophylline, or theophylline. Dashed lines indicate the SOICR threshold. C, HEK293 cells expressing RyR2Ser-2367-CFP/Tyr-2801-YFP were permeabilized and perfused with the ICM buffer without or with caffeine (10 mm) or 4-CmC (1 mm). A representative single cell recording of the Ser-2367-CFP/Tyr-2801-YFP FRET signal is shown. D, a representative single cell luminal Ca2+ recording of D1ER-transfected, permeabilized HEK293 cells expressing RyR2Ser-2367-CFP/Tyr-2801-YFP in ICM without or with caffeine or 4-CmC. Dashed lines indicate the SOICR threshold. E, shown is a comparison of changes in the Ser-2367-CFP/Tyr-2801-YFP FRET signal (structural changes) with those in the SOICR threshold (functional changes) induced by caffeine, aminophylline, theophylline, or 4-CmC. The extents of changes in FRET and SOICR were normalized to those at 10 mm caffeine (100%). Data shown are the mean ± S.E. (n = 5–11) (*, p < 0.01; FRET versus SOICR).
FIGURE 4.
FIGURE 4.
Differential effects of cytosolic ATP and Ca2+ on the conformational dynamics of RyR2. A, HEK293 cells expressing RyR2Ser-2367-CFP/Tyr-2801-YFP were permeabilized and perfused with ICM without or with caffeine (10 mm) or ATP (5 mm). A representative single cell recording of the Ser-2367-CFP/Tyr-2801-YFP FRET signal is shown. B, shown is a representative single cell luminal Ca2+ recording of D1ER-transfected, permeabilized HEK293 cells expressing RyR2Ser-2367-CFP/Tyr-2801-YFP in the ICM buffer with or without caffeine or ATP. The SOICR threshold is indicated by a dashed line. C, HEK293 cells expressing RyR2Ser-2367-CFP/Tyr-2801-YFP were permeabilized and perfused with ICM without or with caffeine (10 mm) or Ca2+ (1 μm). A representative single cell recording of the Ser-2367-CFP/Tyr-2801-YFP FRET signal is shown. Note that unlike ATP, Ca2+ induced no changes in FRET. D, a representative single cell luminal Ca2+ recording of D1ER-transfected, permeabilized HEK293 cells expressing RyR2Ser-2367-CFP/Tyr-2801-YFP in the ICM buffer without or with caffeine or Ca2+ is shown. The dashed line indicates the SOICR threshold. E, shown is a comparison of changes in the Ser-2367-CFP/Tyr-2801-YFP FRET signal (structural changes) with those in the SOICR threshold (functional changes) induced by caffeine, ATP, or Ca2+. The extents of changes in FRET and SOICR were normalized to those at 10 mm caffeine (100%). Data shown are the mean ± S.E. (n = 7–14) (*, p < 0.01; FRET versus SOICR). F, shown is FRET efficiency in permeabilized HEK293 cells expressing RyR2Ser-2367-CFP/Tyr-2801-YFP in ICM without or with ATP, Ca2+, or 4-CmC. Data shown are the mean ± S.E. (n = 20–30). *, p < 0.01; versus ICM.
FIGURE 5.
FIGURE 5.
Impact of ryanodine on the structure and function of RyR2. A, HEK293 cells transfected with RyR2Ser-2367-CFP/Tyr-2801-YFP were permeabilized and perfused with ICM, caffeine (10 mm), and caffeine (10 mm) plus ryanodine (100 μm) followed by wash-off with ICM. The cells were then perfused with caffeine (10 mm) again followed by wash-off with ICM. The illumination was turned off during part of the long incubation with caffeine plus ryanodine to minimize photobleaching. A representative single cell recording of the Ser-2367-CFP/Tyr-2801-YFP FRET signal is shown. B, shown is a representative single cell luminal Ca2+ recording of D1ER-transfected, permeabilized HEK293 cells expressing RyR2Ser-2367-CFP/Tyr-2801-YFP. The cells were perfused in the same way as that described in panel A. Note that the ER Ca2+ store remained depleted after the addition of ryanodine. C, shown is a comparison of the changes in the Ser-2367-CFP/Tyr-2801-YFP FRET signal and those in the SOICR threshold under various conditions: a, caffeine (10 mm) (control); b, caffeine (10 mm) plus ryanodine (100 μm), c, after wash-off; d, re-application of caffeine (10 mm). The extents of changes in FRET and SOICR threshold were normalized to those in the control (100%). Data shown are the mean ± S.E. (n = 4–8). *, p < 0.01; FRET versus SOICR; #, p < 0.01 versus before or after caffeine treatment. D, HEK293 cells expressing RyR2Ser-2367-CFP/Tyr-2801-YFP were permeabilized and perfused with ICM (a), caffeine (10 mm) (b), caffeine (10 mm) plus ryanodine (100 μm) (c) followed by wash-off (d). The FRET efficiency under each of these conditions was determined by the photobleaching method. Data shown are the mean ± S.E. (n = 30). *, p < 0.01; versus ICM.

References

    1. Bers D. M. (2002) Cardiac excitation-contraction coupling. Nature 415, 198–205 - PubMed
    1. Berridge M. J., Bootman M. D., Roderick H. L. (2003) Calcium signaling. Dynamics, homeostasis, and remodelling. Nat. Rev. Mol. Cell Biol. 4, 517–529 - PubMed
    1. Fill M., Copello J. A. (2002) Ryanodine receptor calcium release channels. Physiol. Rev. 82, 893–922 - PubMed
    1. Meissner G. (2004) Molecular regulation of cardiac ryanodine receptor ion channel. Cell Calcium 35, 621–628 - PubMed
    1. Zucchi R., Ronca-Testoni S. (1997) The sarcoplasmic reticulum Ca2+ channel/ryanodine receptor. Modulation by endogenous effectors, drugs, and disease states. Pharmacol. Rev. 49, 1–51 - PubMed

Publication types

MeSH terms

LinkOut - more resources