. 2013 Feb 1;41(3):1922-35.
doi: 10.1093/nar/gks978. Epub 2012 Dec 20.

The expression platform and the aptamer: cooperativity between Mg2+ and ligand in the SAM-I riboswitch

Affiliations

The expression platform and the aptamer: cooperativity between Mg2+ and ligand in the SAM-I riboswitch

Scott P Hennelly et al. Nucleic Acids Res. .

Abstract

Riboswitch operation involves the complex interplay between the aptamer domain and the expression platform. During transcription, these two domains compete against each other for shared sequence. In this study, we explore the cooperative effects of ligand binding and Magnesium interactions in the SAM-I riboswitch in the context of aptamer collapse and anti-terminator formation. Overall, our studies show the apo-aptamer acts as (i) a pre-organized aptamer competent to bind ligand and undergo structural collapse and (ii) a conformation that is more accessible to anti-terminator formation. We show that both Mg(2+) ions and SAM are required for a collapse transition to occur. We then use competition between the aptamer and expression platform for shared sequence to characterize the stability of the collapsed aptamer. We find that SAM and Mg(2+) interactions in the aptamer are highly cooperative in maintaining switch polarity (i.e. aptamer 'off-state' versus anti-terminator 'on-state'). We further show that the aptamer off-state is preferentially stabilized by Mg(2+) and similar divalent ions. Furthermore, the functional switching assay was used to select for phosphorothioate interference, and identifies potential magnesium chelation sites while characterizing their coordinated role with SAM in aptamer stabilization. In addition, we find that Mg(2+) interactions with the apo-aptamer are required for the full formation of the anti-terminator structure, and that higher concentrations of Mg(2+) (>4 mM) shift the equilibrium toward the anti-terminator on-state even in the presence of SAM.


Figures

Figure
1.
Figure 1.
SHAPE probing data for both the Mg2+ and SAM titrations. (a) The T. tengcongensis metF SAM I riboswitch in the SAM-bound off-state. This secondary structure is dominant in the presence of sufficient ligand. (b) In the absence of SAM interactions, the anti-terminator structure sequesters aptamer sequence to produce the riboswitch on-state. (c) SHAPE probing was performed on the aptamer domain. Full data sets are available in supplementary data (Supplementary Figures S1–S4). Example capillary electrophoresis traces from primer extension analysis of Mg2+ titrations in the absence (top) and presence (bottom) of 100 µM SAM. The overlaid traces are without Mg2+ (red) and 2 mM Mg2+ (black). Nucleotides from the eight regions analysed here are indicated. The reactivity of nucleotide U84 was invariant and was used to normalize the titration data. (d) SHAPE results for SAM titration without Mg2+ (top) and at 1 mM Mg2+ (bottom). Overlaid traces show no SAM (red), 1 mM SAM (black). Beneath is a primer extension control (green) and the dideoxy sequencing trace (blue) showing adenine positions.
Figure
2.
Figure 2.
Plots of reactivity changes for the Mg2+ and SAM titration experiments at A92 with the best fit (red line) to a two-state binding isotherm. The [Mg2+]1/2 and KD values for SAM from the fits are shown. Fits were performed on representative data sets, and errors are the standard fit errors for that data set. (a) Mg2+ titration without SAM. (b) Mg2+ with SAM. (c) SAM titration without Mg2+. (d) SAM titration with 1 mM Mg2+.
Figure 3.
Figure 3.
SAM-Mg2+ landscape for aptamer collapse: quantified SHAPE probing results following the aptamer collapse process for SAM and Mg2+ titrations. (a) Peak integration results for four representative titration experiments at the eight regions analysed. Peaks are integrated and normalized to the reactivity at position U84. The reactivity at the lowest titrated concentration is set to 1. The exception is A14 in helix P2 where the collapsed aptamer conformation produces increased reactivity consistent with the observed conformation in the X-ray structure. Here, the reactivity at 2 mM Mg2+ and 1 mM SAM for the Mg2+ and SAM titrations, respectively, is set to 1. For the Mg2+ titrations, the concentrations are 0, 100 µM, 200 µM, 300 µM, 400 µM, 800 µM, 1 mM, 2 mM, 4 mM and 10 mM. SAM titration concentrations are 0, 1 µM, 10 µM, 100 µM and 1 mM. (b) Schematic representation of the collapse process observed in (a). Green, regions that decrease in mobility with increasing SAM or Mg2+ relative to no SAM and no Mg2+. Black, regions that are unchanged in mobility with increasing SAM or Mg2+ relative to no SAM and no Mg2+. Yellow, regions that increase in mobility with increasing SAM or Mg2+ relative to no SAM and no Mg2+. The final collapsed structure is only observed with both SAM and Mg2+ interactions.
Figure
4.
Figure 4.
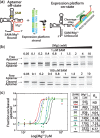
Switching assay results. (a) Aptamer domain RNA is folded and challenged with a chimeric RNA/DNA oligomer based on the native expression platform sequence. Instability in the aptamer domain allows the expression platform sequence to compete for shared sequence in the aptamer domain. Formation of the anti-terminator helix produces a substrate RNA–DNA duplex for RNase H resulting in cleavage of the aptamer domain (right). (b) Example denaturing PAGE gels used to analyse the Mg2+ titrations at various concentrations of SAM. Mg2+ concentrations were chosen for each SAM concentration to best resolve the transition from destabilized (cleaved) to stable (uncleaved) aptamer. (c) After quantification of the bands representing the cleaved (sum of both cleavage products) and uncleaved fractions, the data [(fluorescence uncleaved aptamer)/(fluorescence cleaved + uncleaved aptamer)] were plotted versus [Mg2+] and fit to the Hill equation (methods, equation 2). Fits yielded the [Mg2+]1/2 (the concentration at which the transition was 50% complete) and Hill coefficients (nH) for the transitions at each concentration of SAM. Fits to the Hill model were performed on representative data sets, and errors represent the standard errors for the fitting of that parameter. Hill coefficients were not determined for the experiments with 200 µM SAM. High fit errors were caused by too few data points representing fully cleaved aptamer at low Mg2+ concentrations (standard errors exceeded 100%).
Figure 5.
Figure 5.
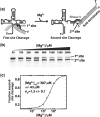
The extent of anti-terminator strand invasion is influenced by Mg2+ concentration. (a) The RNase H cleavage assay (Figure 4) uses a RNA/DNA chimera as an analog of the expression platform sequence. Partial formation of the anti-terminator helix creates a single site for RNase H cleavage. Full association creates a second site. (b) Denaturing poly-acrylamide gels showing the cleavage site selection on the aptamer domain. As Mg2+ concentrations increase, the ability of the expression platform to fully form and become a substrate for RNase H increases. (c) Plot of fractional peak areas for the second site cleavage product [(area second site)/(area both sites)]. The curve represents the best fit of the data to the Hill equation (equation 2, methods). Errors are the standard fit errors for that parameter.
Figure 6.
Figure 6.
Titration results of various cations. An electrophoretic mobility shift assay was used to follow the extent of association of the aptamer domain with an RNA oligomeric analog of the expression platform anti-terminator sequence. After equilibration with the RNA anti-terminator oligo, the samples were diluted 10 000-fold into cold H2O and analysed by capillary electrophoresis. (a) Titrations were performed for divalent metals Mg2+, Mn2+, Ca2+, Sr2+ and Ba2+, as well as the monovalent ion K+. The ratio of the peak area from the free aptamer over the peak area for the aptamer-anti-terminator complex is plotted versus the ion concentration. The concentrations of divalent ions were as follows: 100 µM (purple), 400 µM (tan), 1 mM (blue), 2 mM (red), 4 mM (black), 10 mM (green), 50 mM (cyan) and 100 mM (orange). The concentrations for K+ were as follows: 200 mM (blue), 400 mM (red), 800 mM (black), 1 M (green), 1.5 M (cyan) and 2 M (orange). Error bars are the standard deviations for three separate experiments. Concentrations where there was no detectable free aptamer remaining are marked with an ‘X’. (b) Example capillary electrophoresis traces from the titration of Mg2+ showing the shift toward stabilized free aptamer as Mg2+ concentrations increase. This is followed by a shift in equilibrium toward the anti-terminator complex at Mg2+ concentrations >4 mM.
Figure 7.
Figure 7.
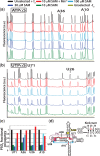
The expression platform switching assay was used as a selection screen in a phosphorothioate interference assay. A schematic detailing the selection methodology is available in supplementary data (Supplementary Figure S5). Selection was performed using RNase H to cleave destabilized aptamers (see Figure 4). Aptamer RNA is randomly incorporated to ∼5% with one of the four α-phosphorothioate-rNTPs. The RNA is 3′-end labeled with the Alexa-488 fluorophore. RNase H cleavage removes the label from aptamers unfit to compete for shared sequence. Populations of each phosphorothiate position are resolved by phosphorothioate cleavage with iodine after selection and before capillary electrophoresis. (a) Capillary electrophoresis traces of selected and unselected RNA incorporated with ATPαS. Experiments were performed at various concentrations of SAM; black (unselected control RNA), green (10 µM SAM), blue (30 µM SAM), cyan (100 µM SAM), red (rescue at 10 µM SAM with 1 mM Mn2+) and brown (unselected control without iodine cleavage). Positions showing phophorothioate interference are indicated. As SAM concentrations increase, the population of phosphorothioate at that position returns to normal. (b) Electropherograms for UTPαS interference assay (colors the same as in a). (c) Traces are integrated and the areas normalized to peaks that display no selection. Bar graph color-code is the same as that for the cap-EP traces above. (d) Secondary structure plot showing the positions of interference with an inset showing the kink-turn element with residue numbering. Red and blue boxed nucleotides show important tertiary interaction (base-triple contacts) proximal to the central Mg2+-binding site formed by A10 and U71.
Figure 8.
Figure 8.
Structure of the T. tengcongensis aptamer domain. (a) Structural model based on the original T. tengcongensis SAM I aptamer structure of Montange and Batey (39), but using the full native sequence (20). Helical elements in the structure are color coded to the secondary structure (b). Nucleotides of interest are shown in red. The bound SAM molecule (yellow) can be seen in the enlarged view to interact with J1/2 nucleotide A10 that also acts as a ligand coordinating a bound Mg2+ ion (green), bridging J1/2 and J3/4 at U71. Other positions where Mg2+ is found to interact by phosphorothioate interference are A36 and U26. In the X-ray structure, these positions are occupied by iridium complexes, which are indicated by black spheres. Data show these three sites are involved in the chelation of Mg2+ ions. Important secondary and tertiary interactions that are ligand dependent are shown including the U71:A92 base pair that joins J4/1 with J3/4 and the pseudoknot interaction (magenta). (b) Secondary structure of the full T. tengcongensis riboswitch element noting positions of interest including three ligand-dependent base-triple interactions (blue and red boxes).
Figure 9.
Figure 9.
A proposed folding scheme for the SAM-I riboswitch RNA. Here, the nascent polymerizing unfolded RNA (U) rapidly folds to an ensemble of folding intermediates (If). Interaction with Mg2+ ions pre-organizes the folding intermediates to form the ligand-binding competent aptamer (Isw). Binding of ligand allows the RNA to access the native aptamer state (Napt) by stabilizing the site-specific binding of ions. An alternative Native state is the on-state (Ne.p.) that contains many of the pre-organized features found in (Isw) and those formed by the polymerized expression platform sequence.

Similar articles

Cited by

References

    1. Mandal M, Breaker RR. Adenine riboswitches and gene activation by disruption of a transcription terminator. Nat. Struct. Mol. Biol. 2004;11:29–35. - PubMed
    1. Winkler WC, Cohen-Chalamish S, Breaker RR. An mRNA structure that controls gene expression by binding FMN. Proc. Natl Acad. Sci. USA. 2002;99:15908–15913. - PMC - PubMed
    1. Winkler WC, Nahvi A, Sudarsan N, Barrick JE, Breaker RR. An mRNA structure that controls gene expression by binding S-adenosylmethionine. Nat. Struct. Biol. 2003;10:701–707. - PubMed
    1. Mandal M, Lee M, Barrick JE, Weinberg Z, Emilsson GM, Ruzzo WL, Breaker RR. A glycine-dependent riboswitch that uses cooperative binding to control gene expression. Science. 2004;306:275–279. - PubMed
    1. Sudarsan N, Wickiser JK, Nakamura S, Ebert MS, Breaker RR. An mRNA structure in bacteria that controls gene expression by binding lysine. Genes Dev. 2003;17:2688–2697. - PMC - PubMed

Publication types