. 2013 Feb;15(2):172-88.
doi: 10.1093/neuonc/nos298. Epub 2012 Dec 20.

Monocarboxylate transporters (MCTs) in gliomas: expression and exploitation as therapeutic targets

Affiliations

Monocarboxylate transporters (MCTs) in gliomas: expression and exploitation as therapeutic targets

Vera Miranda-Gonçalves et al. Neuro Oncol. 2013 Feb.

Abstract

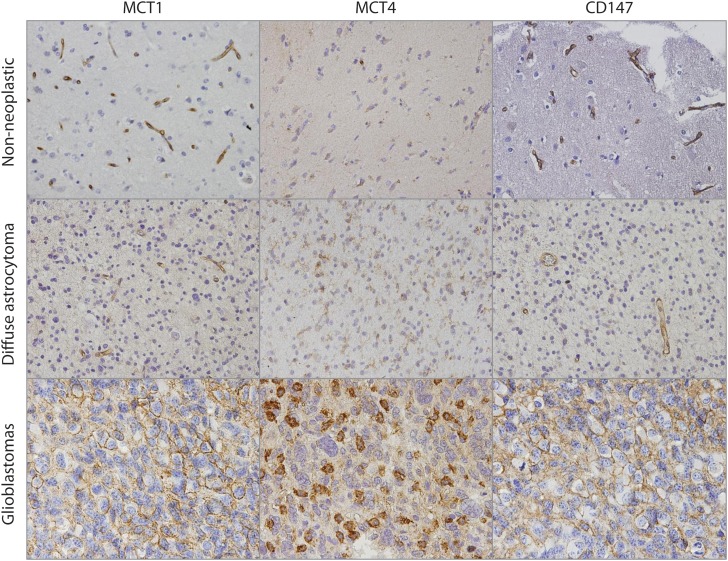
Background: Gliomas exhibit high glycolytic rates, and monocarboxylate transporters (MCTs) play a major role in the maintenance of the glycolytic metabolism through the proton-linked transmembrane transport of lactate. However, their role in gliomas is poorly studied. Thus, we aimed to characterize the expression of MCT1, MCT4, and their chaperone CD147 and to assess the therapeutic impact of MCT inhibition in gliomas.

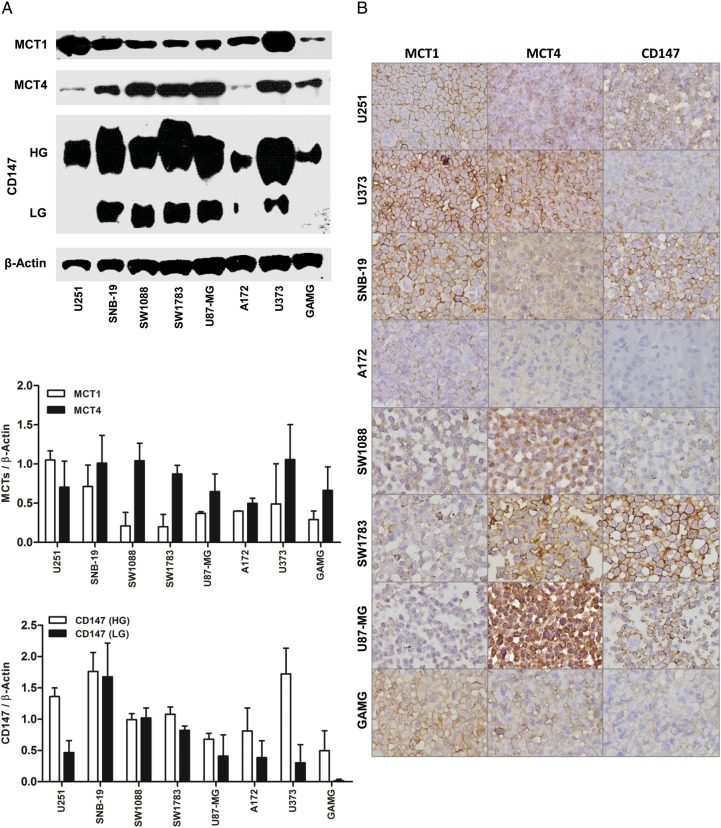
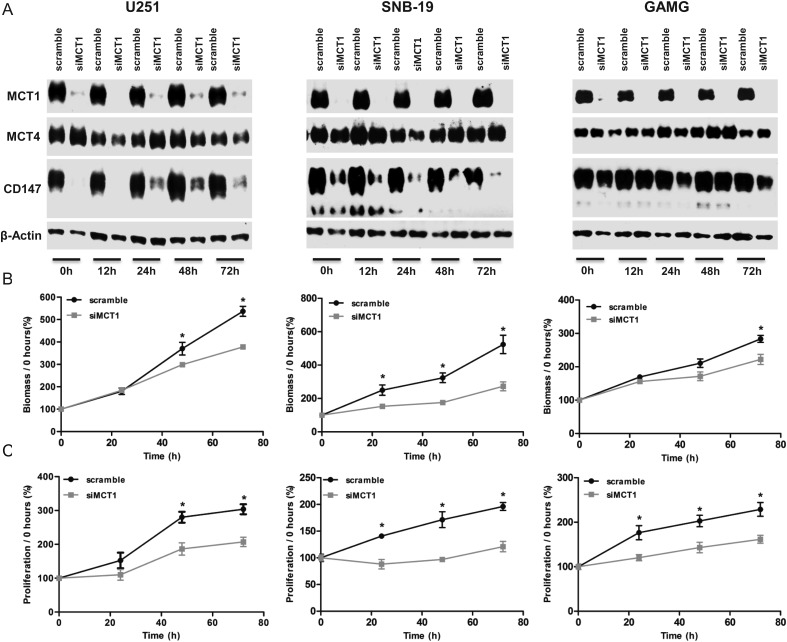
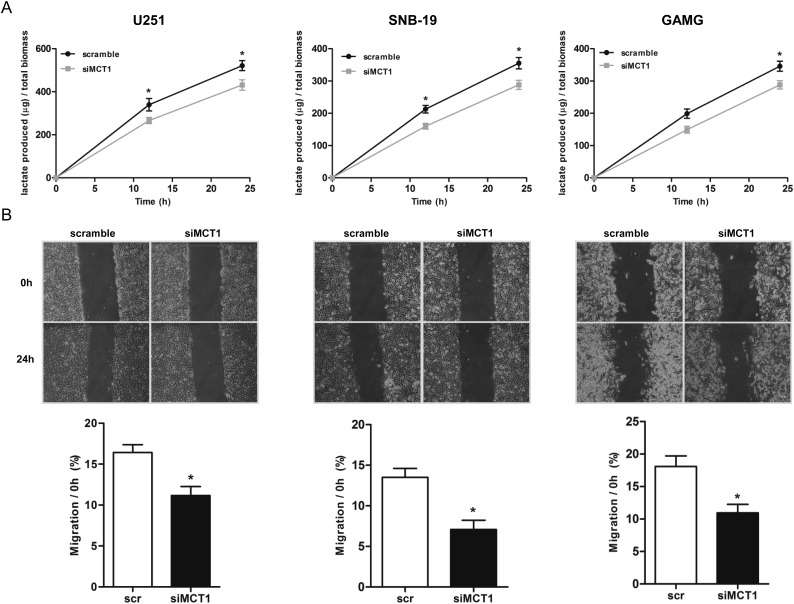
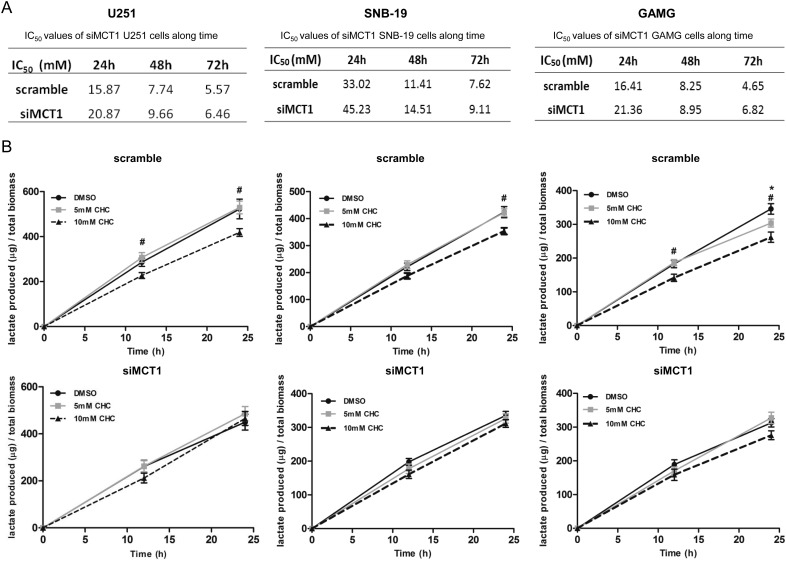
Methods: MCTs and CD147 expressions were characterized by immunohistochemistry in nonneoplastic brain and glioma samples. The effect of CHC (MCT inhibitor) and MCT1 silencing was assessed in in vitro and in vivo glioblastoma models.

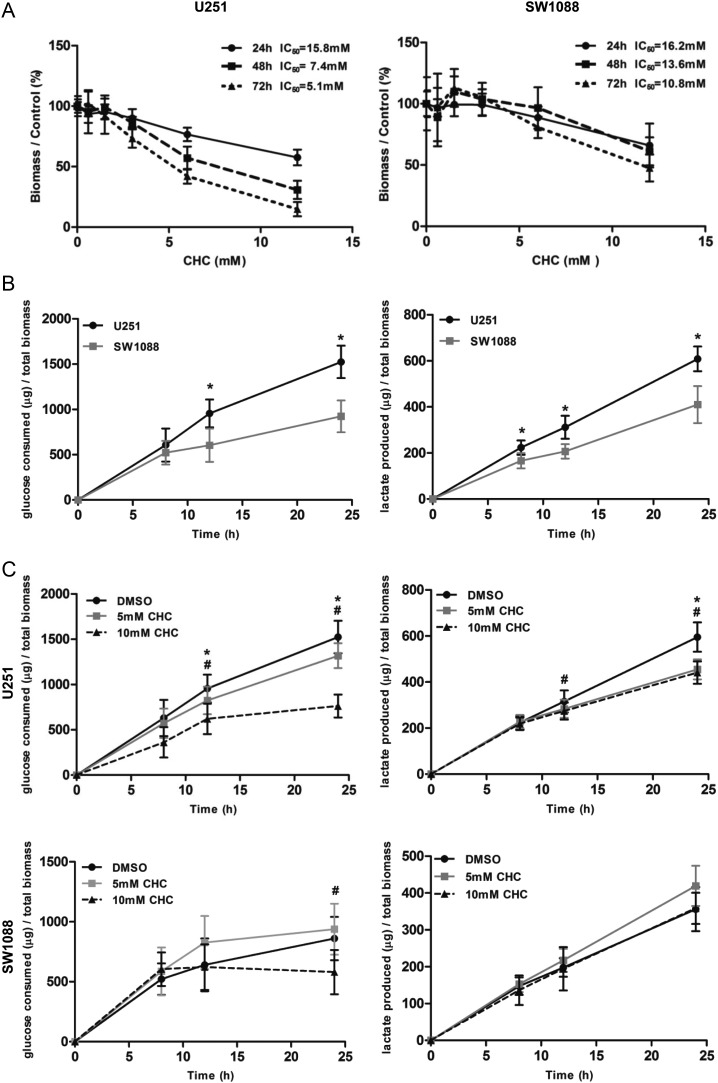
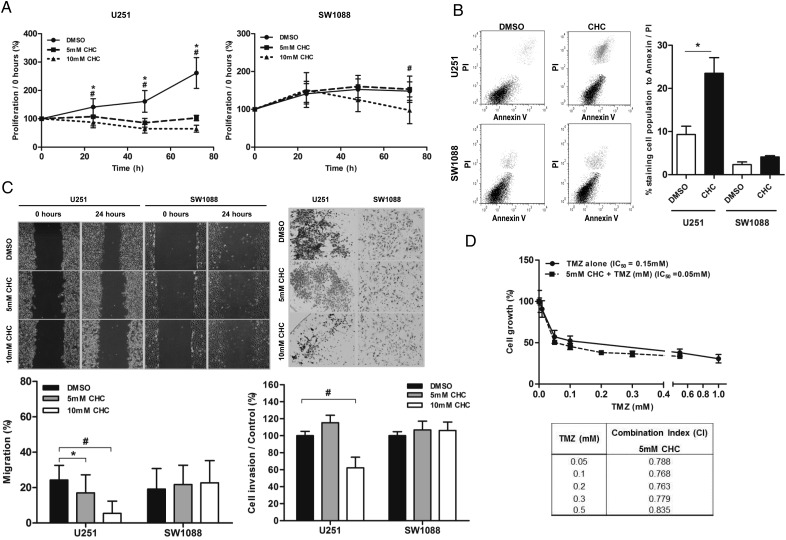
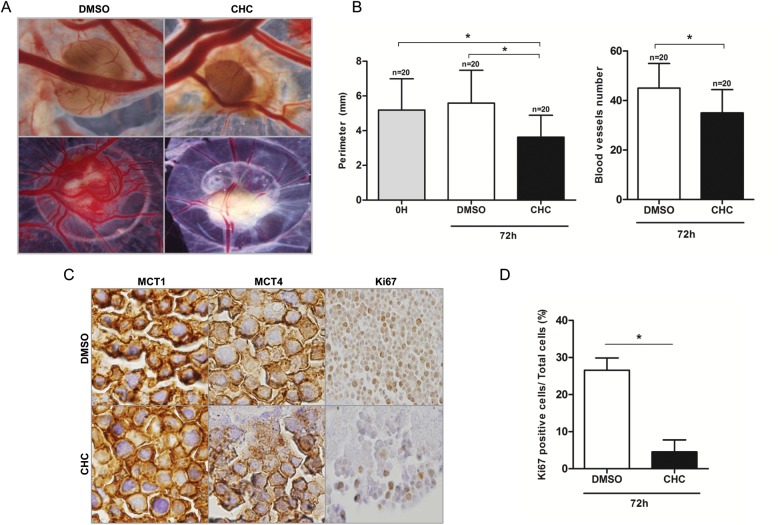
Results: MCT1, MCT4, and CD147 were overexpressed in the plasma membrane of glioblastomas, compared with diffuse astrocytomas and nonneoplastic brain. CHC decreased glycolytic metabolism, migration, and invasion and induced cell death in U251 cells (more glycolytic) but only affected proliferation in SW1088 (more oxidative). The effectiveness of CHC in glioma cells appears to be dependent on MCT membrane expression. MCT1 downregulation showed similar effects on different glioma cells, supporting CHC as an MCT1 inhibitor. There was a synergistic effect when combining CHC with temozolomide treatment in U251 cells. In the CAM in vivo model, CHC decreased the size of tumors and the number of blood vessels formed.

Conclusions: This is the most comprehensive study reporting the expression of MCTs and CD147 in gliomas. The MCT1 inhibitor CHC exhibited anti-tumoral and anti-angiogenic activity in gliomas and, of importance, enhanced the effect of temozolomide. Thus, our results suggest that development of therapeutic approaches targeting MCT1 may be a promising strategy in glioblastoma treatment.


Figures

Fig. 1.
Fig. 1.
Immunohistochemical expression of monocarboxylate transporters and their chaperone protein CD147 in glioma samples. MCT1 and MCT4 isoforms and their chaperone CD147 presented weak cytoplasmic expression in few cases of nontumoral cerebral tissue. Diffuse astrocytomas presented cytoplasmic expression of MCT1, MCT4, and CD147. Glioblastoma tissues present a strong expression of MCT1 and CD147, mainly at the plasma membrane, whereas MCT4 reactivity was found in both the cytoplasm and the plasma membrane. Pictures were obtained using the microscope Olympus BX61, at 400× magnification.
Fig. 2.
Fig. 2.
Monocarboxylate transporters (MCT1 and MCT4) and CD147 expressions in glioblastoma cell lines. (A) Western blot analysis of MCT1, MCT4, and CD147 showing different levels of expression in glioma cells. The molecular weights (kDa) are the following: 50 kDa for MCT1, 52 kDa for MCT4, and 50–60 kDa for the highly glycosylated and 42 kDa for low glycosylated form of CD147. Results are presented as the mean ± SD of 2 independent cell lysates. (B) Immunocytochemistry analysis of MCT1, MCT4, and CD147 expressions in glioma cells (400× magnification). MCT1 is mainly expressed at the plasma membrane of U251, U373, SNB-19, and GAMG glioma cell lines, whereas MCT4 is present at both plasma membrane and cytoplasm of the different glioma cells. CD147 is expressed at the plasma membrane of some glioma cells, with different levels.
Fig. 3.
Fig. 3.
Effect of the MCT inhibitor, CHC, on total cell biomass and cellular metabolism. (A) The effect of CHC on total biomass of glioma cells was evaluated over time by the sulphorhodamine B assay. CHC inhibited the viability of U251 cells, but not SW1088, over time, in a dose-dependent manner. (B) Metabolic characterization of U251 and SW1088 cells. U251 cells presented higher levels of glucose consumption and lactate production than SW1088 cells. *P≤ .05, compared U251 with SW1088 cells. (C) The effect of CHC on cellular metabolism was evaluated by extracellular glucose and lactate measurements. CHC induced a significant decrease in glucose consumption and lactate production on U251, compared with SW1088 cells. Results were normalized to total biomass, at each time point. *P ≤ .05, compared 5 mM CHC with DMSO. #P ≤ .05, compared 10 mM CHC with DMSO. Results are expressed as the mean ± SD of at least 3 independent experiments, each in triplicate.
Fig. 4.
Fig. 4.
Effect of CHC on glioma cell behavior and response to TMZ. (A) The effect of CHC on cell proliferation was determined using the BrdU assay. CHC had a significant effect on the cellular proliferative capacity of U251 cells over time, and for SW1088, CHC only had an effect for 10 mM CHC at 72 h. *P≤ .05, compared 5 mM CHC with DMSO. #P ≤ .05, compared 10 mM CHC with DMSO. Results are expressed as the mean ± SD of at least 3 independent experiments, each in triplicate. (B) Cell death analysis was done in U251 and SW1088 cells after 72 h of treatment with IC50 values of CHC by Annexin V/PI assay (flow cytometry). In U251 cells, we observed a significant increase in cell death induced by CHC, whereas for SW1088, there was no difference (right panel). Representative dotplot of cell population distribution stained for Annexin V and PI are shown in the left panel (cell population in bottom/left = viable cells; the cell population in upper/right = death cells [late apoptosis/necrosis]). *P ≤ .05. Results are expressed as the mean ± SD of at least 3 independent experiments; (C) In the wound-healing migration assay and matrigel invasion assay, we observed that CHC decreased U251 cell migration, compared with control cells, but not for SW1088 cells. Representative images of the migration assay at 0 and 24 h are presented (40× magnification) (left panel). For invasion assay, representative images at 24 h are shown (100× magnification) (right panel); *P ≤ .05, compared 5 mM CHC with DMSO. #P ≤ .05, compared 10 mM CHC with DMSO. Results are expressed as the mean ± SD of at least 3 independent experiments. (D) Effect of CHC + TMZ treatment in U251 cell growth was evaluated by SRB at 72 h. U251 cells were treated with fixed concentration of CHC (5 mM) and increasing concentrations of TMZ (0.05–0.5 mM). TMZ + CHC therapy decreased cell growth of U251 cells, compared with TMZ alone (graph). Growth curves for TMZ and CHC in monotherapy were compared with the combination to determine the combination index (CI) for each concentration of TMZ (table). Values <1 indicate a synergistic drug relationship; results are representative of 3 independent experiments, each in triplicate.
Fig. 5.
Fig. 5.
Effect of MCT1 downregulation on cell growth and proliferation. (A) Western blot analysis of MCT1, MCT4, and CD147 expressions in siMCT1 U251, SNB-19, and GAMG cells. Molecular weights (kDa) are the following: 50 kDa for MCT1, 52 kDa for MCT4, and 50–60 kDa for the highly glycosylated and 42 kDa for the low glycosylated form of CD147. (B) Cell growth and (C) cell proliferation decreased with MCT1 downregulation. *P ≤ .05, siMCT1 cells compared with scramble. Results represent the mean ± SD of at least 3 independent experiments, each in triplicate.
Fig. 6.
Fig. 6.
Effect of MCT1 downregulation on lactate production and cell migration. (A) Lactate production decreased at 12 and 24 h in both siMCT1 U251 and SNB-19 cells and only at 24 h in GAMG cells. Results represent the mean ± SD of at least 3 independent experiments, each in triplicate. *P ≤ .05, siMCT1 cells compared with scramble. (B) Downregulation of MCT1 decreased the migration capacity of cells by the wound-healing assay. Results represent the mean ± SD of at least 3 independent experiments. *P ≤ .05, siMCT1 cells compared with scramble.
Fig. 7.
Fig. 7.
Effect of MCT1 downregulation on the sensitivity to CHC. (A) IC50 values for scramble and siMCT1 cells were determined over time by total cell biomass. (B) Effect of CHC on lactate production in siMCT1 cells over time. *P ≤ .05, 5 mM CHC compared with DMSO. #P ≤ .05, 10 mM CHC compared with DMSO. Results are expressed as the mean ± SD of at least 3 independent experiments, each in triplicate.
Fig. 8.
Fig. 8.
In vivo effect of CHC in U251 glioma cell growth. (A) Representative pictures (16× [up] and 12.5× [down] magnifications) of CAM assay after 7 days of tumor growth ex ovo. Representative pictures of CHC effect on the perimeter (up) and in vascularization (down) of tumors. (B) Tumor growth was measured in vivo, and blood vessels around the tumors were counted ex ovo, as described in the Materials and Methods section. A significant decrease in the perimeter (mm) of the tumors treated with 5 mM CHC (left graph) (control group n = 20; CHC group n = 20) was observed. CHC decreased the number of vessels around the tumors, compared with the control group (right graph) (control group n = 20; CHC group n = 20). (C) Representative pictures (400× magnification) of immunohistochemical analysis of MCT1, MCT4, and Ki67 expression in tumors of control compared with CHC group. CHC did not induce an effect in the cellular localization and expression of MCT1 and MCT4. In Ki67 immunoreaction, we observed a decrease in the number of U251-stained cells in the CHC group, compared with control group. (D) Percentage of Ki67 positive cells. CHC group had a lower number of Ki67 positive cells (5%, n = 5), compared with the control group (25%, n = 5); data are the mean ± SD. *P ≤ .05.

References

    1. Louis DN, Ohgaki H, Wiestler OD, et al. The 2007 WHO classification of tumours of the central nervous system. Acta Neuropathol. 2007;114(2):97–109. - PMC - PubMed
    1. Stupp R, Hegi ME, Mason WP, et al. Effects of radiotherapy with concomitant and adjuvant temozolomide versus radiotherapy alone on survival in glioblastoma in a randomised phase III study: 5-year analysis of the EORTC-NCIC trial. Lancet Oncol. 2009;10(5):459–466. - PubMed
    1. Dang CV, Semenza GL. Oncogenic alterations of metabolism. Trends Biochem Sci. 1999;24(2):68–72. - PubMed
    1. Hanahan D, Weinberg RA. Hallmarks of cancer: the next generation. Cell. 2011;144(5):646–674. - PubMed
    1. Gatenby RA, Gillies RJ. Why do cancers have high aerobic glycolysis? Nat Rev Cancer. 2004;4(11):891–899. - PubMed

Publication types

MeSH terms