. 2013 Sep 1;19(7):665-82.
doi: 10.1089/ars.2012.4859. Epub 2013 Feb 26.

Iron-sulfur cluster binding by mitochondrial monothiol glutaredoxin-1 of Trypanosoma brucei: molecular basis of iron-sulfur cluster coordination and relevance for parasite infectivity

Affiliations

Iron-sulfur cluster binding by mitochondrial monothiol glutaredoxin-1 of Trypanosoma brucei: molecular basis of iron-sulfur cluster coordination and relevance for parasite infectivity

Bruno Manta et al. Antioxid Redox Signal. .

Abstract

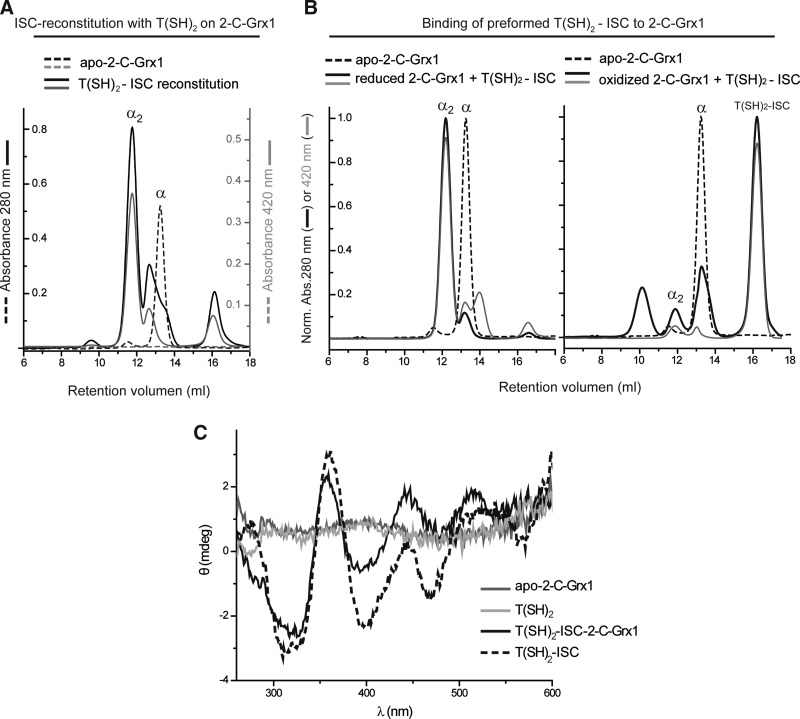
Aims: Monothiol glutaredoxins (1-C-Grxs) are small proteins linked to the cellular iron and redox metabolism. Trypanosoma brucei brucei, model organism for human African trypanosomiasis, expresses three 1-C-Grxs. 1-C-Grx1 is a highly abundant mitochondrial protein capable to bind an iron-sulfur cluster (ISC) in vitro using glutathione (GSH) as cofactor. We here report on the functional and structural analysis of 1-C-Grx1 in relation to its ISC-binding properties.

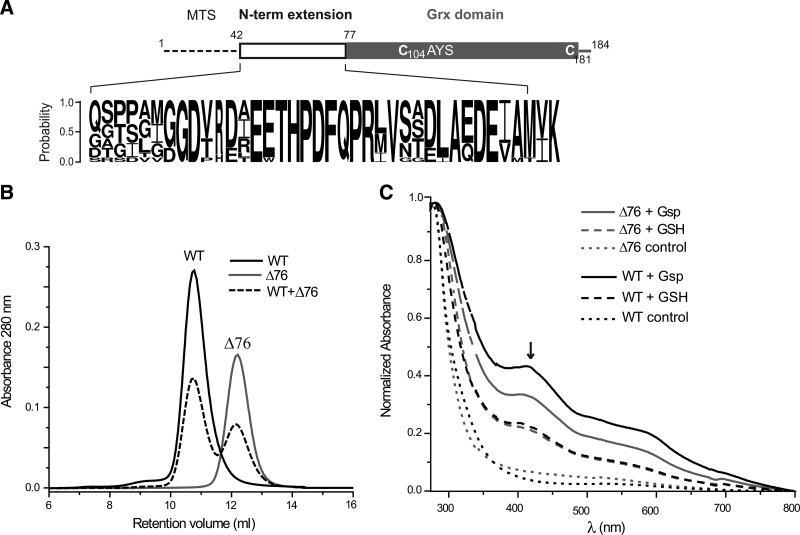
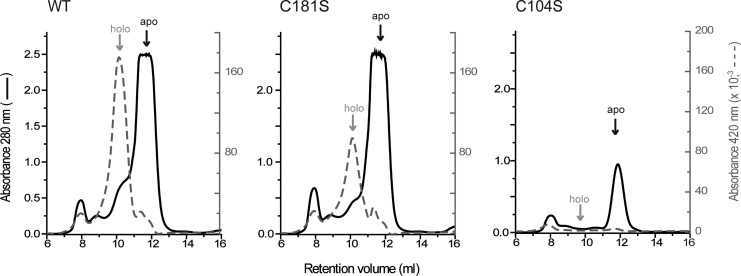
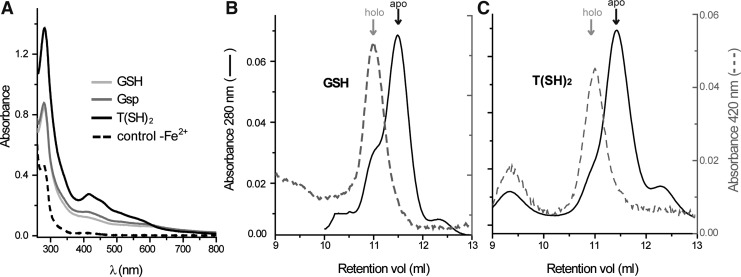
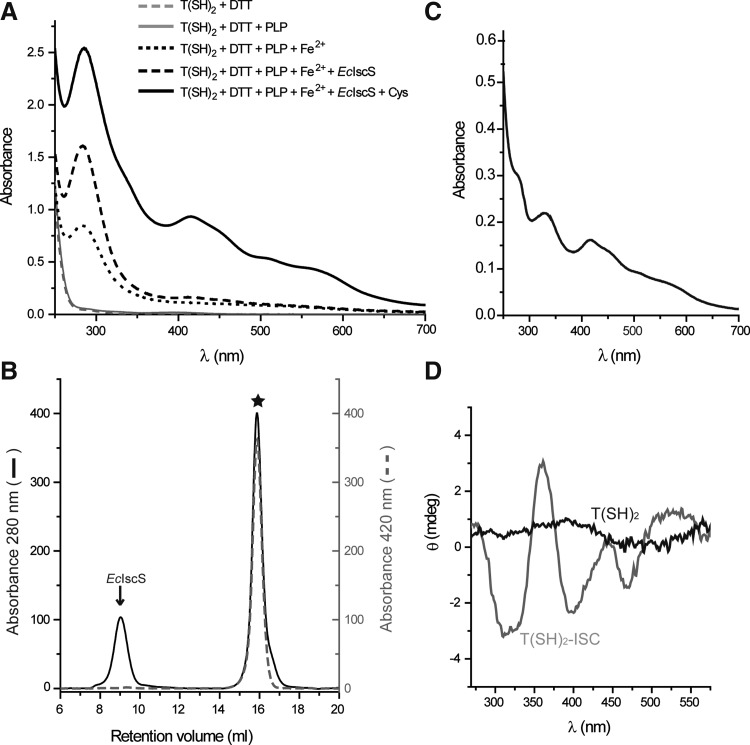
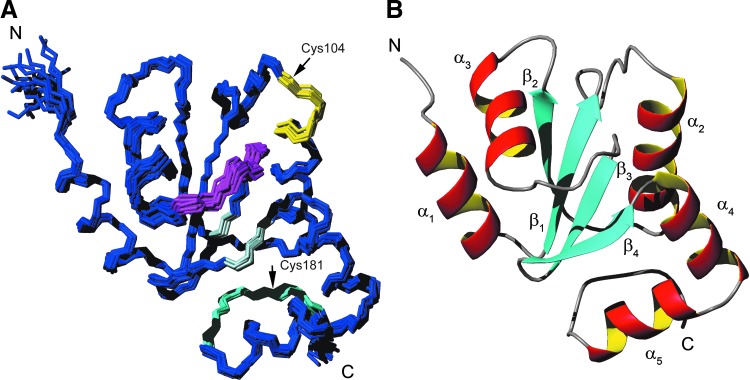
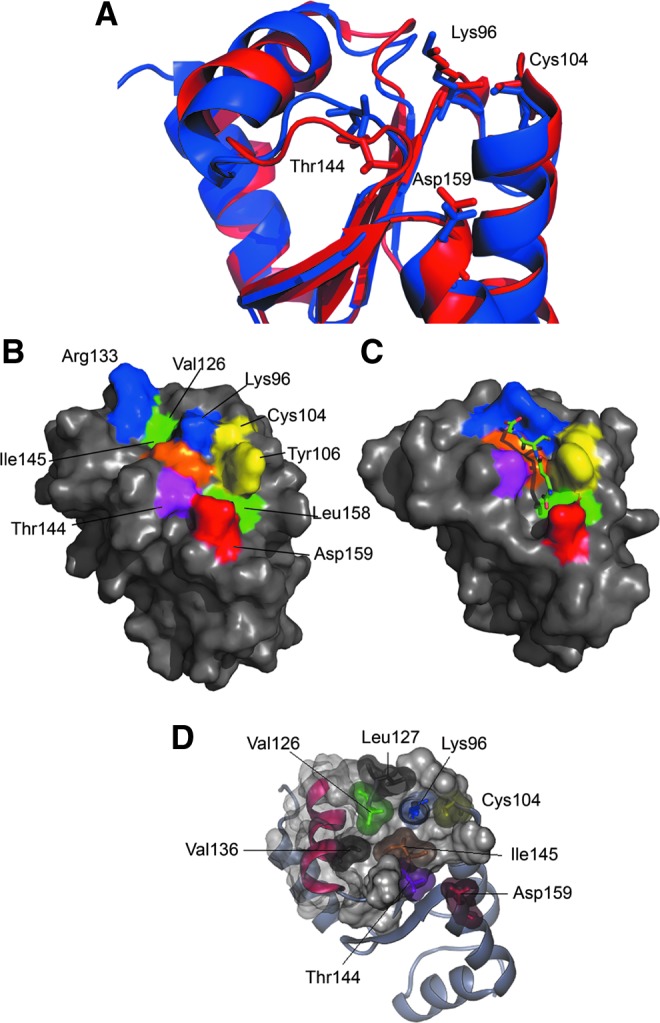
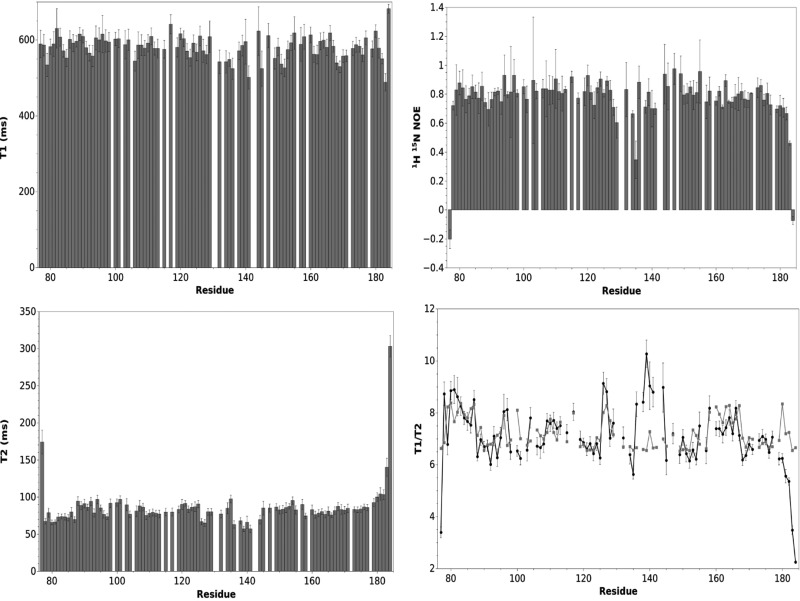
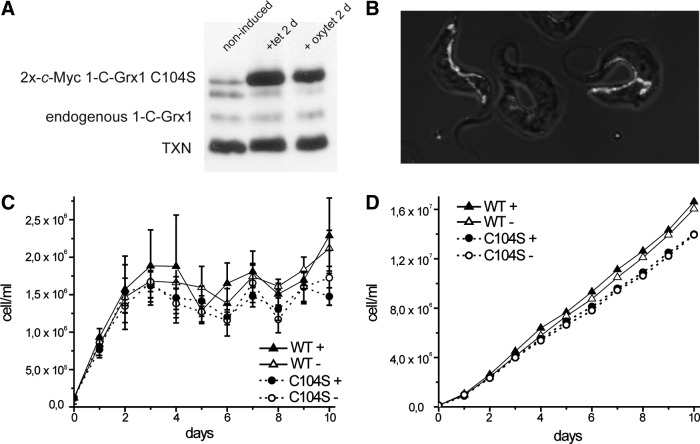
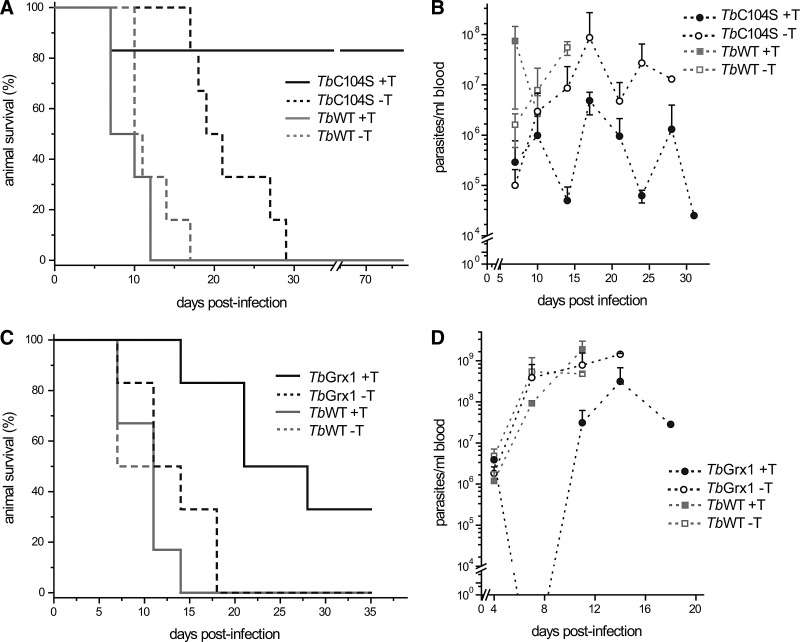
Results: An N-terminal extension unique to 1-C-Grx1 from trypanosomatids affects the oligomeric structure and the ISC-binding capacity of the protein. The active-site Cys104 is essential for ISC binding, and the parasite-specific glutathionylspermidine and trypanothione can replace GSH as the ligands of the ISC. Interestingly, trypanothione forms stable protein-free ISC species that in vitro are incorporated into the dithiol T. brucei 2-C-Grx1, but not 1-C-Grx1. Overexpression of the C104S mutant of 1-C-Grx1 impairs disease progression in a mouse model. The structure of the Grx-domain of 1-C-Grx1 was solved by nuclear magnetic resonance spectroscopy. Despite the fact that several residues--which in other 1-C-Grxs are involved in the noncovalent binding of GSH--are conserved, different physicochemical approaches did not reveal any specific interaction between 1-C-Grx1 and free thiol ligands.

Innovation: Parasite Grxs are able to coordinate an ISC formed with trypanothione, suggesting a new mechanism of ISC binding and a novel function for the parasite-specific dithiol. The first 3D structure and in vivo relevance of a 1-C-Grx from a pathogenic protozoan are reported.

Conclusion: T. brucei 1-C-Grx1 is indispensable for mammalian parasitism and utilizes a new mechanism for ISC binding.


Figures

FIG. 1.
FIG. 1.
Structural organization, gel chromatography, and ISC formation of WT and Δ76 Tb1-C-Grx1. (A) Schematic representation of Tb1-C-Grx1 with the putative MTS, the N-terminal extension, and the Grx domain with the active-site CAYS (Cys104) as well as Cys181. The conservation in the N-terminal extension of 1-C-Grx1s from different trypanosomatids is shown as logo (see Supplementary Fig. S1 for details). (B) SEC of mature (WT), truncated (Δ76), and a mixture of both proteins. (C) UV–visible spectra of ISC reconstitution mixtures for 50 μM WT (black lines) and Δ76 (gray lines) Tb1-C-Grx1 in the presence of 150 μM GSH (dashed) or Gsp (solid). The cysteine desulfurase was omitted in control reactions (dotted lines). The spectra were normalized for the absorbance at 280 nm. The black arrow indicates the characteristic absorbance at 420 nm of the holocomplex. 1-C-Grx, monothiol glutaredoxin; Grx, glutaredoxin; GSH, glutathione; Gsp, glutathionylspermidine; ISC, iron–sulfur cluster; SEC, size-exclusion chromatography; WT, wild type; Tb, Trypanosoma brucei; MTS, mitochondrial targeting sequence.
FIG. 2.
FIG. 2.
ISC binding by different Tb1-C-Grx1 species overexpressed in Escherichia coli. His-tagged WT, C181S, and C104S Tb1-C-Grx1 eluted from the Ni2+- affinity chromatography column were subjected to SEC with online detection at 280 nm (black solid line) and 420 nm (gray dashed line). The WT and C181S proteins displayed a minor peak or shoulder, preceding the apoform (black arrow), with an absorbance at 420 nm (gray arrow). This peak corresponds to the holoprotein (holo) and is absent in the elution profile of the C104S mutant. The peak eluting at ∼8 ml corresponds to the exclusion volume (proteins with molecular masses≥75 kDa).
FIG. 3.
FIG. 3.
In vitro ISC binding by Tb1-C-Grx1. (A) Tag-free Tb1-C-Grx1 WT (50 μM) was subjected to the ISC reconstitution assay in the presence of 1 mM GSH, 1 mM Gsp, or 500 μM T(SH)2 (1 mM thiol). Control assays lacked Fe2+. Identical results were obtained for His-tagged proteins (not shown). (B, C) About 100 μg protein from the ISC reconstitution mixtures with GSH (B) or T(SH)2 (C) was subjected to SEC with online detection at 280 nm (solid black line) and 420 nm (dashed gray line). In both cases, apo-Tb1-C-Grx1 showed the expected retention volume and no absorbance at 420 nm, while the peak containing the chromophore (“holo”) eluted at lower retention volume. T(SH)2, trypanothione.
FIG. 4.
FIG. 4.
ISC formation on trypanothione. (A) One mM T(SH)2 was incubated with the individual components of the reconstitution assay (5 mM dithiothreitol, 10 μM pyridoxal-5′-phosphate, 500 μM Fe2+, 5 μM EcIscS, and 500 μM cysteine) as described under the Material and Methods section, but in the absence of Grxs. The UV–visible spectrum of each mixture was recorded after centrifugation. (B) The ISC reconstitution mixture containing all components (black solid line in A) was subjected to gel chromatography. The major peak (star) elutes with a retention time corresponding to an LMM component. EcIscS indicates the elution peak of E. coli cysteine desulfurase. (Abs. 280 nm: black solid line, Abs. 420 nm: gray dashed line). (C) The UV–visible spectrum of the peak fraction from B (star) containing the T(SH)2-ISC complex. (D) The CD Spectra of the T(SH)2-ISC complex (gray line) and free T(SH)2 (black line). CD, circular dichroism; LMM, low molecular mass.
FIG. 5.
FIG. 5.
The parasite 2-C-Grx1 binds preformed T(SH)2-ISC complexes. (A) About 100 μM Tb2-C-Grx1 was subjected to a reconstitution mixture with 1 mM T(SH)2, followed by gel chromatography with online detection at 280 nm (black lines) and 420 nm (gray lines). The ISC reconstitution mixture is shown in solid lines, while the reduced free 2-C-Grx1 (apo) is shown in dashed lines. The peaks corresponding to the apo- (monomeric) and holo- (dimeric) 2-C-Grx1 are indicated as α and α2, respectively. (B) A protein-free T(SH)2-ISC complex produced and isolated by SEC as described in Figure 4 was incubated with reduced (left) or oxidized (right) Tb2-C-Grx1 in buffer A at room temperature for 30 min before subjecting the mixture to SEC. Incubation of reduced Tb2-C-Grx1 with the preformed T(SH)2-ISC complex yielded mainly a dimeric protein species (solid black line) that absorbed at 420 nm (solid gray line), whereas oxidized 2-C-Grx1 did not bind the free T(SH)2-ISC complex. For comparison, the chromatogram of apo-2-C-Grx1 is included (black dashed lines), and all profiles are shown normalized. (C) The CD spectra of holo-Tb2-C-Grx1 reconstituted with T(SH)2-ISC (α2 in A; solid black line), apo-2-C-Grx1 (solid gray line), free T(SH)2 (solid light gray line), and isolated T(SH)2-ISC complex (black dotted line). 2-C-Grx, dithiol glutaredoxin.
FIG. 6.
FIG. 6.
Nuclear magnetic resonance structure of Δ76 Tb1-C-Grx1. (A) Superposition of the backbone of the 20 conformers with the best CYANA target function, refined with Amber. Active-site residues (104–107, yellow), cis-proline-containing loop (residues 141–146, magenta), residues involved in the formation of the conserved β-bulge (148, 155, and 156, light blue), and residues from C-terminus (178–182, cyan) are highlighted. The positions of Cys104 and Cys181 are indicated with black arrows. (B) Ribbon representation showing secondary-structure elements. The program MOLMOL was used to prepare these figures To see this illustration in color, the reader is referred to the web version of this article at www.liebertpub.com/ars
FIG. 7.
FIG. 7.
Structural features of the Tb1-C-Grx1 active-site region. (A) Superposition of the protein portion encompassing the putative GSH-binding pocket in apo-Δ76 Tb1-C-Grx1 (red, this work) and E. coli Grx4 in an ISC-bound dimeric form (blue; PDB-ID 2WIC; a single monomer is shown, and the ISC and GSH molecules are omitted). (B) Conserved residues predicted to be important for the binding of GSH are mapped on the surface of Δ76 Tb1-C-Grx1 with different colors: Lys96 and Arg133 in blue; Cys104 and Tyr106 in yellow; Thr144 in magenta; Ile145 in orange; and Asp159 in red; the hydrophobic residues Val126 and Leu158 in the pocket are shown in green. (C) The corresponding residues in E. coli Grx4 (PDB ID 2WIC) are represented with the same colors; the noncovalently bound GSH molecule is shown as sticks. The program PyMol was used for preparing the pictures. (D) Residues Ile145, Val 136, Val126, and Leu127, forming the hydrophobic network discussed in the text, are represented by their van der Waal's surfaces. Other residues important for GSH binding are highlighted with the same color used in panel (B) To see this illustration in color, the reader is referred to the web version of this article at www.liebertpub.com/ars
FIG. 8.
FIG. 8.
Backbone dynamics of Δ76 Tb1-C-Grx1. Backbone amide 15N longitudinal (T1) and transverse (T2) relaxation time and 15N{1H}-NOE measured at 600 MHz and 298 K. Experimental (black circle) and HYDRONMR (gray square) T1/T2 are compared. T1 and T2 were obtained by fitting cross peak volumes, measured as a function of the relaxation delay, to a single exponential decay using the NmrPipe software package (20). Spectra were recorded with 9 (10 [twice], 50, 100, 200 [twice], 400, 700, 1000 [twice], 1300, and 1600 ms) and 8 delay times (16.31 [twice], 32.64, 48.96 [twice], 65.28, 97.92 [twice], 146.89, 179.52, and 228.5 ms) for T1 and T2 measurements, respectively. NOE values were calculated as the ratio of peak volumes in spectra recorded with and without saturation. NOE, nuclear Overhauser effect.
FIG. 9.
FIG. 9.
Phenotypic characterization of bloodstream trypanosomes overexpressing an ectopic copy of C104S Tb1-C-Grx1-cMyc2. (A) Total cell extracts from 5×10⁶ cells induced during 48 h with 1 μg/ml tet or 10 μg/ml oxytet were separated on an SDS-15% PAGE and proteins of interest revealed by Western blot. The endogenous (∼16 kDa) and 2x-c-Myc-tagged C104S (∼18 kDa) Tb1-CGrx1 were detected using guinea pig serum α-Tb1-C-Grx1. Detection of tryparedoxin (TXN) with rabbit serum α-T. brucei tryparedoxin served as a loading control (see Supplementary Fig. S5). (B) Merge image showing the mitochondrial localization of Tb1-C-Grx1 C104S in bloodstream T. brucei. Parasites induced for 48 h with 10 μg/ml oxytet were treated with Mitotracker® (mitochondrial marker), fixed, and incubated with purified guinea pig serum α-Tb1-C-Grx1 (see the Materials and Methods section). The image depicts the superimposition of both staining on a bright-field image (original pictures are shown in Supplementary Fig. S5). (C) Representative proliferation of T. brucei 514–1313 (WT) and C104S (clone 3, Supplementary Fig. S5). Cells were inoculated at 1×10⁵ cells/ml in the culture medium with (+) or without (−) 10 μg/ml oxytet. Every 24 h, parasites were counted and diluted to the initial cell density in a fresh medium. Shown are the mean values and standard deviations from four independent experiments. (D) The cumulative cell density of the data plotted in (A). oxytet, oxytetracycline; tet, tetracycline; SDS-PAGE, sodium dodecyl sulfate–polyacrylamide gel electrophoresis.
FIG. 10.
FIG. 10.
Survival and parasitemia analysis of mice infected with WT, 1-C-Grx1 C104S-, and 1-C-Grx1-overexpressing T. brucei. Mature female BALB/cJ mice (n=6) were infected intraperitoneally with 104 bloodstream parasites from the isogenic cell line 514–1313 (TbWT) and transgenic cell lines for tet-inducible expression of C-myc-tagged WT (TbGrx1) and C104S mutant of Tb1-C-Grx104S (TbC104S). Groups of mice were given (+) or not (−) with 1 mg/ml oxytet in drinking water to induce in vivo the expression of the trans-genes. The parasite level in blood (parasitemia) was evaluated regularly in animals from all the groups by light microscopy. The results are depicted as Kaplan–Meier survival (A, C) and parasitemia (B, D) plots for the experiments involving the TbWT strain and the cell line TbC104S (A, B) and TbGrx1 (C, D).

References

    1. Alsford S. Turner DJ. Obado SO. Sanchez-Flores A. Glover L. Berriman M. Hertz-Fowler C. Horn D. High-throughput phenotyping using parallel sequencing of RNA interference targets in the African trypanosome. Genome Res. 2011;21:915–924. - PMC - PubMed
    1. Ariyanayagam MR. Fairlamb AH. Ovothiol and trypanothione as antioxidants in trypanosomatids. Mol Biochem Parasitol. 2001;115:189–198. - PubMed
    1. Atkinson HJ. Babbitt PC. An atlas of the thioredoxin fold class reveals the complexity of function-enabling adaptations. PLoS Comput Biol. 2009;5:e1000541. - PMC - PubMed
    1. Bandyopadhyay S. Gama F. Molina-Navarro MM. Gualberto JM. Claxton R. Naik SG. Huynh BH. Herrero E. Jacquot JP. Johnson MK. Rouhier N. Chloroplast monothiol glutaredoxins as scaffold proteins for the assembly and delivery of [2Fe-2S] clusters. EMBO J. 2008;27:1122–1133. - PMC - PubMed
    1. Barbato G. Ikura M. Kay LE. Pastor RW. Bax A. Backbone dynamics of calmodulin studied by 15N relaxation using inverse detected two-dimensional NMR spectroscopy: the central helix is flexible. Biochemistry. 1992;31:5269–5278. - PubMed

Publication types

MeSH terms

LinkOut - more resources