. 2012 Dec 22;13(12):R122.
doi: 10.1186/gb-2012-13-12-r122.

Ray Meta: scalable de novo metagenome assembly and profiling

Ray Meta: scalable de novo metagenome assembly and profiling

Sébastien Boisvert et al. Genome Biol. .

Abstract

Voluminous parallel sequencing datasets, especially metagenomic experiments, require distributed computing for de novo assembly and taxonomic profiling. Ray Meta is a massively distributed metagenome assembler that is coupled with Ray Communities, which profiles microbiomes based on uniquely-colored k-mers. It can accurately assemble and profile a three billion read metagenomic experiment representing 1,000 bacterial genomes of uneven proportions in 15 hours with 1,024 processor cores, using only 1.5 GB per core. The software will facilitate the processing of large and complex datasets, and will help in generating biological insights for specific environments. Ray Meta is open source and available at http://denovoassembler.sf.net.


Figures

Figure 1
Figure 1
Assembled proportions of bacterial genomes for a simulated metagenome with sequencing errors. 3 × 10⁹ 100-nucleotide reads were simulated with sequencing errors (0.25%) from a simulated metagenome containing 1,000 bacterial genomes with proportions following a power law. Having 1,000 genomes with power law proportions makes it impossible to classify sequences with their coverage. This large metagenomic dataset was assembled using distributed de Bruijn graphs and profiled with colored de Bruijn graphs. Highly similar, but different genomes, are likely to be hard to assemble. This figure shows the proportion of each genome that was assembled de novo within the metagenome. Of the bacterial genomes, 88.2% were assembled with a breadth of coverage of at least 80.0%.
Figure 2
Figure 2
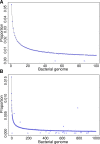
Estimated bacterial genome proportions. For the two simulated metagenomes (100 and 1,000 bacterial genomes, respectively), colored de Bruijn graphs were utilized to estimate the nucleotide proportion of each bacterial genome in its containing metagenome. Genome proportions in metagenomes followed a power law. Black lines show the expected nucleotide proportion for bacterial genomes while blue points represent proportions measured by colored de Bruijn graphs. (A) For the 100-genome metagenome, only two bacterial genomes were not correctly measured (2.0%), namely Methanococcus maripaludis X1 and Serratia AS9. Methanococcus maripaludis X1 was not detected because it was duplicated in the dataset as Methanococcus maripaludis XI, thus providing zero uniquely colored k-mers. Serratia AS9 was not detected because it shares almost all its k-mers with Serratia AS12. (B) For the 1,000-genome metagenome, 4 bacterial genomes were overestimated (0.4%) while 20 were underestimated (2.0%). These errors were due to highly similar bacterial genomes, hence they did not provide uniquely colored k-mers. This problem can be alleviated either by using a curated set of reference genomes or by using a taxonomy. The remaining 976 bacterial genomes had a measured proportion near the expected value.
Figure 3
Figure 3
Fast and efficient taxonomic profiling with distributed colored de Bruijn graphs. From a previous study, 124 metagenomic samples containing short paired reads were assembled de novo and profiled for taxons. The graph coloring occurred once the de Bruijn graph was assembled de novo. (A) The taxonomic profiles are shown for the phylum level. The two most abundant phyla were Firmicutes and Bacteroidetes. This is in agreement with the literature [22]. The abundance of human sequences was also measured. The phylum Chordata had two outlier samples. This indicates that two of the samples had more human sequences than the average, which may bias results. (B) At the genus level, the most abundant taxon was Bacteroides. This taxon occurred more than once because it was present at different locations within the Greengenes taxonomic tree. Also abundant is the genus Prevotella. Furthermore, the later had numerous samples with higher counts, which may help in non-parametric clustering. Two samples had higher abundance of human sequences, as indicated by the abundance of the genus Homo.
Figure 4
Figure 4
Principal component analysis shows two clusters. Principal component analysis (see Materials and methods) with abundances at the genus level yielded two distinct clusters. Abundances were obtained with colored de Bruijn graphs. One was enriched in the genus Bacteroides while the other was enriched in the genus Prevotella. Principal component 1 was linearly correlated with the genus Prevotella while principal component 2 was linearly correlated with the genus Bacteroides. This analysis suggests that there is a continuum between the two abundant genera Bacteroides and Prevotella. This interpretation differs from the original publication in which three human gut enterotypes were reported [23]. More recently, it has been proposed that there are only two enterotypes and individuals are distributed in a continuum between the two [42].
Figure 5
Figure 5
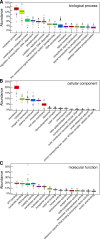
Ontology profiling with colored de Bruijn graphs. Gene ontology profiles were obtained by coloring of the graph resulting from de novo assembly. Gene ontology has three domains: biological process, cellular component and molecular function. For each domain, only the 15 most abundant terms are displayed. (A) Ontology terms in the biological process domain were profiled. Some of these have several outlier samples, namely oxidation-reduction process and DNA recombination. (B) Ontology profiling for cellular component terms is shown. The most abundant is the membrane term. (C) The profile for molecular function terms is shown. Binding functions are the most abundant with ATP binding, nucleotide binding and DNA binding in the top three. Next is catalytic activity, which is a general term. More specific catalytic activities are listed.

References

    1. Wold B, Myers RM. Sequence census methods for functional genomics. Nature Methods. 2008;13:19–21. doi: 10.1038/nmeth1157. - DOI - PubMed
    1. Brenner S. Sequences and consequences. Philosophical Transactions of the Royal Society B: Biological Sciences. 2010;13:207–212. doi: 10.1098/rstb.2009.0221. - DOI - PMC - PubMed
    1. McPherson JD. Next-generation gap. Nature Methods. 2009;13:S2–S5. doi: 10.1038/nmeth.f.268. - DOI - PubMed
    1. Mardis E. The $1,000 genome, the $100,000 analysis?. Genome Medicine. 2010;13:84. doi: 10.1186/gm205. - DOI - PMC - PubMed
    1. Compeau PEC, Pevzner PA, Tesler G. How to apply de Bruijn graphs to genome assembly. Nature Biotechnology. 2011;13:987–991. doi: 10.1038/nbt.2023. - DOI - PMC - PubMed

Publication types