. 2012 Dec 21:10:252.
doi: 10.1186/1479-5876-10-252.

NF-κB is activated in response to temozolomide in an AKT-dependent manner and confers protection against the growth suppressive effect of the drug

Affiliations

NF-κB is activated in response to temozolomide in an AKT-dependent manner and confers protection against the growth suppressive effect of the drug

Simona Caporali et al. J Transl Med. .

Abstract

Background: Most DNA-damaging chemotherapeutic agents activate the transcription factor nuclear factor κB (NF-κB). However, NF-κB activation can either protect from or contribute to the growth suppressive effects of the agent. We previously showed that the DNA-methylating drug temozolomide (TMZ) activates AKT, a positive modulator of NF-κB, in a mismatch repair (MMR) system-dependent manner. Here we investigated whether NF-κB is activated by TMZ and whether AKT is involved in this molecular event. We also evaluated the functional consequence of inhibiting NF-κB on tumor cell response to TMZ.

Methods: AKT phosphorylation, NF-κB transcriptional activity, IκB-α degradation, NF-κB2/p52 generation, and RelA and NF-κB2/p52 nuclear translocation were investigated in TMZ-treated MMR-deficient (HCT116, 293TLα-) and/or MMR-proficient (HCT116/3-6, 293TLα+, M10) cells. AKT involvement in TMZ-induced activation of NF-κB was addressed in HCT116/3-6 and M10 cells transiently transfected with AKT1-targeting siRNA or using the isogenic MMR-proficient cell lines pUSE2 and KD12, expressing wild type or kinase-dead mutant AKT1. The effects of inhibiting NF-κB on sensitivity to TMZ were investigated in HCT116/3-6 and M10 cells using the NF-κB inhibitor NEMO-binding domain (NBD) peptide or an anti-RelA siRNA.

Results: TMZ enhanced NF-κB transcriptional activity, activated AKT, induced IκB-α degradation and RelA nuclear translocation in HCT116/3-6 and M10 but not in HCT116 cells. In M10 cells, TMZ promoted NF-κB2/p52 generation and nuclear translocation and enhanced the secretion of IL-8 and MCP-1. TMZ induced RelA nuclear translocation also in 293TLα+ but not in 293TLα- cells. AKT1 silencing inhibited TMZ-induced IκB-α degradation and NF-κB2/p52 generation. Up-regulation of NF-κB transcriptional activity and nuclear translocation of RelA and NF-κB2/p52 in response to TMZ were impaired in KD12 cells. RelA silencing in HCT116/3-6 and M10 cells increased TMZ-induced growth suppression. In M10 cells NBD peptide reduced basal NF-κB activity, abrogated TMZ-induced up-regulation of NF-κB activity and increased sensitivity to TMZ. In HCT116/3-6 cells, the combined treatment with NBD peptide and TMZ produced additive growth inhibitory effects.

Conclusion: NF-κB is activated in response to TMZ in a MMR- and AKT-dependent manner and confers protection against drug-induced cell growth inhibition. Our findings suggest that a clinical benefit could be obtained by combining TMZ with NF-κB inhibitors.


Figures
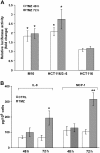
Figure 1
Figure 1
TMZ increases NF-κB transcriptional activity in MMR-proficient but not in MMR-deficient cells. (A) The cells were transiently co-transfected with the pNF-κB-Luc and pRL-null vectors, and 24 h later exposed to 50 μM TMZ+10 μM BG or to BG alone. Firefly luciferase activity was determined 48 and 72 h after drug treatment and normalized to that of Renilla luciferase and then to the total amount of protein used in the assays. Data are expressed in terms of fold change (i.e. the ratio between firefly luciferase activity/μg protein detected in TMZ-treated cells and that detected in the corresponding control cells). Values represent the mean of at least four independent experiments performed with duplicate samples. Bars, standard error of the mean (SEM). *p<0.05, according to paired Student’s t test analysis performed comparing firefly luciferase activity/μg protein of TMZ-treated samples with that of the corresponding controls. (B) M10 cells were cultured in the presence of 50 μM TMZ+10 μM BG or BG alone and culture supernatants were collected after 48 and 72 h of incubation. IL-8 and MCP-1 amount in the culture supernatants was then determined by ELISA and expressed in terms of pg protein/106 cells. Values represent the mean of three independent experiments performed with duplicate samples. Bars, SEM. ** p<0.01 and *p<0.05, according to Student’s t test analysis performed comparing the chemokine amount detected in the culture supernatants of TMZ-treated cells with that detected in the culture supernatants of the corresponding controls.
Figure 2
Figure 2
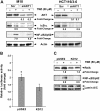
TMZ induces AKT phosphorylation, IκB-α degradation, and RelA nuclear translocation in MMR-proficient but not in MMR-deficient cells. HCT116/3-6, HCT116 and M10 cells were cultured in the presence of 50 μM TMZ+10 μM BG, or BG alone as a control, for 48 and 72 h (A, B) or 72 h (C). Total cell extracts (A, B) or nuclear extracts (C) were resolved on 10% SDS polyacrylamide gels, transferred to nitrocellulose membranes and probed with antibodies against the indicated proteins. Anti-actin mAb or anti-lamin A/C mAb were used for equal loading control. The immune complexes were visualized using ECL. For the indicated samples, the densitometric levels of phospho-AKT, IκB-α and RelA were normalized to the respective levels of actin or lamin. Fold changes of protein expression in TMZ-treated samples were then calculated with respect to the protein levels in the corresponding controls, to which the arbitrary value of 1.0 was assigned. The results are representative of three (A, B) or two (C) independent experiments.
Figure 3
Figure 3
TMZ promotes NF-κB2/p52 generation and nuclear translocation in M10 cells. (A) The cells were cultured in the presence of 50 μM TMZ+10 μM BG, or BG alone for the indicated time. Total cell extracts were then prepared and analyzed for NF-κB2/p52 expression by immunoblotting (see legend of Figure 2). The results are representative of two independent experiments. (B) The cells were cultured as described in (A) for 72 h. Nuclear extracts were then prepared and analyzed for NF-κB2/p52 content as described in (A) using anti-lamin A/C mAb for equal loading control. The results are representative of two independent experiments.
Figure 4
Figure 4
AKT is involved in TMZ-induced activation of NF-κB. (A) The cells were transiently transfected with 50 nM siAKT1 or scrAKT (Scr) and 24 h later exposed to 50 μM TMZ+10 μM BG, or to BG alone. After 72 h of culture, total cell extracts were analyzed for AKT, IκB-α and NF-κB2/p52 expression by immunoblotting (see legend of Figure 2). The results are representative of two independent experiments. (B) The cells were transiently co-transfected with the pNF-κB-Luc and pRL-null vectors and 24 h later incubated with 50 μM TMZ+10 μM BG or with BG alone. Luciferase assays were performed after 72 h of drug exposure. Data are expressed in terms of fold change (see legend of Figure 1). Values represent the mean of four independent experiments performed with duplicate samples. Bars, SEM. *p<0.05 according to paired Student’s t test analysis performed comparing firefly luciferase activity/μg protein detected in TMZ-treated pUSE2 cells with that detected in the corresponding control cells. The difference between firefly luciferase activity/μg protein of TMZ-treated KD12 cells and that detected in the corresponding control cells was not statistically significant. (C) The cells were treated with 50 μM TMZ+10 μM BG or with BG alone for 72 h. Nuclear extracts were then examined for the expression of RelA and NF-κB2/p52 by immunoblotting (see legend of Figure 2). The results are representative of two independent experiments.
Figure 5
Figure 5
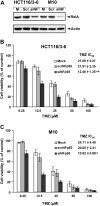
Inhibition of NF-κB expression by RNA interference increases HCT116/3-6 and M10 cell sensitivity to TMZ. (A) The cells were mock transfected (M) or subjected to two sequential transfections with 100 nM scrNFp65 (Scr) or siNFp65 (siNF). Seven days after the second transfection, whole cell extracts were prepared and analyzed for RelA content by immunoblotting (see legend of Figure 2). The results are representative of two independent experiments. (B), (C) The cells were mock transfected or subjected to two sequential transfections with 100 nM scrNFp65 or siNFp65. Twenty-four hours after the second transfection, the cells were incubated with the indicated concentrations of TMZ+10 μM BG or with BG alone as a control. Proliferation was evaluated after 6 days of drug exposure by the MTT assay. Data are expressed in terms of percentage of growth of TMZ-treated cells with respect to control cells. Each value represents the mean of four independent experiments performed with quadruplicate samples. Bars, SEM. **p<0.01, and *p<0.05, according to Student’s t test, comparing TMZ IC50 values of siNFp65-transfected cells with those of mock-transfected or scrNFp65-transfected cells. The difference between TMZ IC50 values of scrNFp65 and those of mock-transfected cells was not statistically significant.
Figure 6
Figure 6
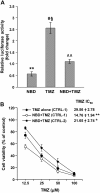
NBD peptide inhibits NF-κB transcriptional activity and increases the antiproliferative effect of TMZ in M10 cells. (A) Melanoma cells were transiently co-transfected with the NF-κB-Luc and pRL-null vectors and treated with NBD peptide, TMZ and BG as described under “Methods”. Luciferase assays were performed after 72 of drug exposure. Data are expressed in terms of fold changes (i.e. the ratio between firefly luciferase activity/μg protein detected in cells exposed to NBD+BG, or TMZ+BG or NBD+TMZ+BG and that detected in cells treated with BG alone). Values represent the mean of six independent experiments performed with duplicate samples. Bars, SEM. Statistical analysis was performed on firefly luciferase activity/μg protein values according to paired Student’s t test. p values were as follows: **p<0.01, NBD+BG versus BG; #p<0.05, TMZ+BG versus BG; §p<0.05 TMZ+BG versus NBD+TMZ+BG; ^^p<0.01, NBD+TMZ+BG versus NBD+BG. The differences between firefly luciferase activity/μg protein of cells treated with NBD+TMZ+BG and that of cells exposed to BG alone was not statistically significant. (B) M10 cells were treated with NBD peptide, TMZ and BG as described under “Methods” and assayed for proliferation by the MTT assay. Percentage of growth of TMZ+BG-treated cells was determined with respect to BG-treated cells (CTRL-1), and that of NBD+TMZ+BG-treated cells with respect to either BG-treated cells (CTRL-1) or NBD+BG-treated cells (CTRL-2). Values represent the mean of four independent experiments. Bars, SEM. **p<0.01, and *p<0.05, according to Student’s t test analysis, comparing TMZ IC50 values of NBD+TMZ+BG-treated cells with those of TMZ+BG-treated cells.
Figure 7
Figure 7
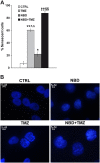
Combined treatment with NBD peptide and TMZ is more effective than TMZ alone in inducing senescence in M10 cells. (A) M10 cells were left untreated or exposed to 50 μM NBD peptide. After 24 h of culture, the cells were incubated with 50 μM TMZ+10 μM BG or with BG alone, and monitored 96 h later for the percentage of SA-β-Gal positive cells. Each value represents the arithmetic mean of three independent experiments. Bar, SEM. p values were calculated according to Student’s t test analysis. **p<0.01, TMZ+BG-treated cells versus BG-treated cells; *p<0.05, NBD peptide+BG-treated cells versus BG-treated cells; ††p<0.01, NBD peptide+TMZ+BG-treated cells versus BG-treated cells; §§p<0.01 NBD peptide+TMZ+BG-treated cells versus TMZ+BG-treated cells and versus NBD+BG-treated cells; ^^p<0.01, TMZ+BG-treated cells versus NBD peptide+BG cells. (B) M10 cells were treated with NBD peptide and TMZ+BG as described in (A). After 7 days of culture, the cells were stained with DAPI to visualize SAHF formation.

Similar articles

Cited by

References

    1. Chaturvedi MM, Sung B, Yadav VR, Kannappan R, Aggarwal BB. NF-kB addiction and its role in cancer: 'one size does not fit all'. Oncogene. 2011;30:1615–1630. doi: 10.1038/onc.2010.566. - DOI - PMC - PubMed
    1. DiDonato JA, Mercurio F, Karin M. NF-kB and the link between inflammation and cancer. Immunol Rev. 2012;246:379–400. doi: 10.1111/j.1600-065X.2012.01099.x. - DOI - PubMed
    1. Perkins ND. The diverse and complex roles of NF-kB subunits in cancer. Nat Rev Cancer. 2012;12:121–132. - PubMed
    1. Sun SC. The noncanonical NF-kB pathway. Immunol Rev. 2012;246:125–140. doi: 10.1111/j.1600-065X.2011.01088.x. - DOI - PMC - PubMed
    1. Wu ZH, Miyamoto S. Many faces of NF-kB signaling induced by genotoxic stress. J Mol Med (Berl) 2007;85:1187–1202. doi: 10.1007/s00109-007-0227-9. - DOI - PubMed

Publication types

MeSH terms

LinkOut - more resources