. 2012 Dec 22:13:334.
doi: 10.1186/1471-2105-13-334.

Protein interface classification by evolutionary analysis

Affiliations

Protein interface classification by evolutionary analysis

Jose M Duarte et al. BMC Bioinformatics. .

Abstract

Background: Distinguishing biologically relevant interfaces from lattice contacts in protein crystals is a fundamental problem in structural biology. Despite efforts towards the computational prediction of interface character, many issues are still unresolved.

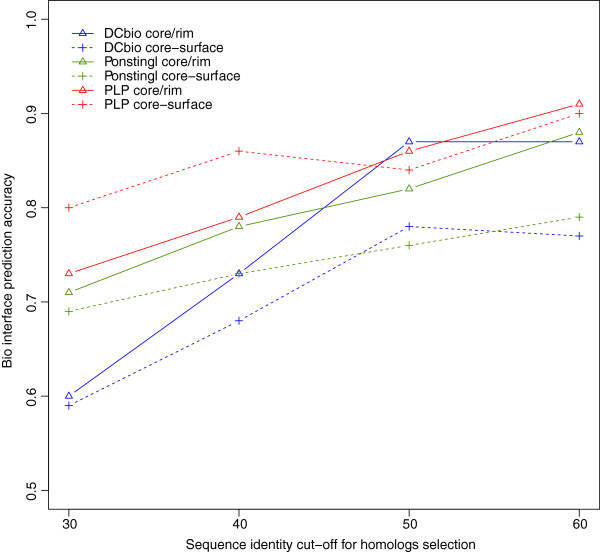
Results: We present here a protein-protein interface classifier that relies on evolutionary data to detect the biological character of interfaces. The classifier uses a simple geometric measure, number of core residues, and two evolutionary indicators based on the sequence entropy of homolog sequences. Both aim at detecting differential selection pressure between interface core and rim or rest of surface. The core residues, defined as fully buried residues (>95% burial), appear to be fundamental determinants of biological interfaces: their number is in itself a powerful discriminator of interface character and together with the evolutionary measures it is able to clearly distinguish evolved biological contacts from crystal ones. We demonstrate that this definition of core residues leads to distinctively better results than earlier definitions from the literature. The stringent selection and quality filtering of structural and sequence data was key to the success of the method. Most importantly we demonstrate that a more conservative selection of homolog sequences - with relatively high sequence identities to the query - is able to produce a clearer signal than previous attempts.

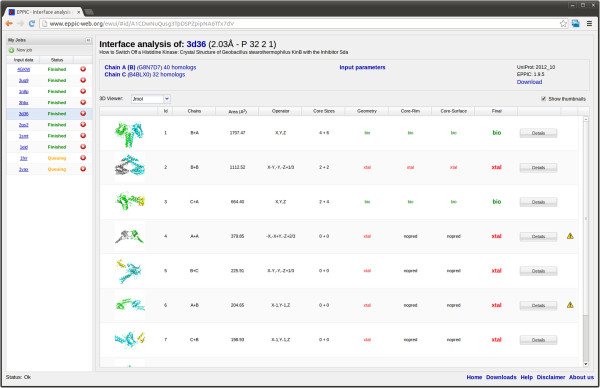
Conclusions: An evolutionary approach like the one presented here is key to the advancement of the field, which so far was missing an effective method exploiting the evolutionary character of protein interfaces. Its coverage and performance will only improve over time thanks to the incessant growth of sequence databases. Currently our method reaches an accuracy of 89% in classifying interfaces of the Ponstingl 2003 datasets and it lends itself to a variety of useful applications in structural biology and bioinformatics. We made the corresponding software implementation available to the community as an easy-to-use graphical web interface at http://www.eppic-web.org.


Figures

Figure 1
Figure 1
Distribution of interface areas in benchmarking datasets: Boxplots for a) Ponstingl Monomers in red and Ponstingl Dimers in green, b) Bahadur Monomers in red and Dimers in green c) DCxtal in red and DCbio in green. Our datasets focus on the range of areas where the two types of interfaces overlap the most, making it most difficult to predict their character.
Figure 2
Figure 2
Correlation of core size in different definitions to area. Dots represent interfaces of the DCbio (green circles) and DCxtal (red squares) datasets. The first two definitions show high correlation, whilst the definition of Schärer, used in this work, has a much lower correlation. In the third plot we marked the core size value of 6 (cut-off used for the geometry classifier) with a horizontal line.
Figure 3
Figure 3
ROCs for different geometric indicators. The ROC curves represent the predictive power of different geometric parameters: core size (Schärer’s definition), core size (Chakrabarti’s definition), core size (Levy’s definition) and total buried surface area. In panel a) the datasets used are our DCbio/DCxtal, whilst in panel b) the Ponstingl datasets were used. Not much difference can be appreciated if using Ponstingl’s dataset, since it contains interfaces that are too clearly separable by area. When we use the DC datasets, it becomes apparent that Schärer’s core definition exhibits superior performance compared to the other geometric indicators.
Figure 4
Figure 4
Schärer’s core definition at different cut-offs. ROC curves for Schärer’s core size at different BSA/ASA cut-offs as predictor for the DC datasets. The 95% burial cut-off has a clear advantage over the lower cut-off core definitions.
Figure 5
Figure 5
Our prediction accuracies on biological interfaces versus identity cut-offs used for homolog selection. The prediction accuracies of our 2 evolutionary methods (core-rim entropy ratio with solid lines and core-surface entropy score with dashed lines) is plotted against different identity cut-offs for selection of homologs to be included in the alignments. For all datasets accuracies are lower when more distant homologs are used in the alignments.
Figure 6
Figure 6
Core-surface score variation across UniProt history. The core-surface scores improve on average as more sequence data has become available. Plotted are core-surface scores of a) biological interfaces (from DCbio, Ponstingl Dimer and PLP datasets) and b) crystal interfaces (from DCxtal and Ponstingl Monomer datasets). The lower the score the stronger the indication of biological interface (our cut-off for classifying bio/crystal is set at −1). The median score for UniProt version 1.0 (2003) is denoted by a dashed line. The chosen versions are separated in time by approximately one year.
Figure 7
Figure 7
Typical output display of the EPPIC server.
Figure 8
Figure 8
Identifying the biologically relevant interface of the EGFR kinase. Asymmetric (top) and symmetric (bottom) dimers in the structure of the epidermal growth factor receptor kinase ([PDB:2GS2]). The two interfaces appear as in the respective PyMOL pse sessions downloadable from the EPPIC web front-end by clicking on interface thumbnails (surface rendering was added for clarity).

References

    1. Leibundgut M, Jenni S, Frick C, Ban N. Structural basis for substrate delivery by acyl carrier protein in the yeast fatty acid synthase. Science. 2007;316:288–90. doi: 10.1126/science.1138249. - DOI - PubMed
    1. Huber EM, Basler M, Schwab R, Heinemeyer W, Kirk CJ, Groettrup M, Groll M. Immuno- and constitutive proteasome crystal structures reveal differences in substrate and inhibitor specificity. Cell. 2012;148:727–38. doi: 10.1016/j.cell.2011.12.030. - DOI - PubMed
    1. Bilokapic S, Schwartz TU. 3D ultrastructure of the nuclear pore complex. Curr Opin Cell Biol. 2012;24:86–91. doi: 10.1016/j.ceb.2011.12.011. - DOI - PMC - PubMed
    1. Hoelz A, Debler EW, Blobel G. The structure of the nuclear pore complex. Annu Rev Biochem. 2011;80:613–43. doi: 10.1146/annurev-biochem-060109-151030. - DOI - PubMed
    1. Janin J. Specific versus non-specific contacts in protein crystals. Nat Struct Biol. 1997;4:973–4. doi: 10.1038/nsb1297-973. - DOI - PubMed

Publication types

LinkOut - more resources