. 2012 Dec 20;76(6):1175-88.
doi: 10.1016/j.neuron.2012.10.028.

Functional properties of cortical feedback projections to the olfactory bulb

Affiliations

Functional properties of cortical feedback projections to the olfactory bulb

Foivos Markopoulos et al. Neuron. .

Abstract

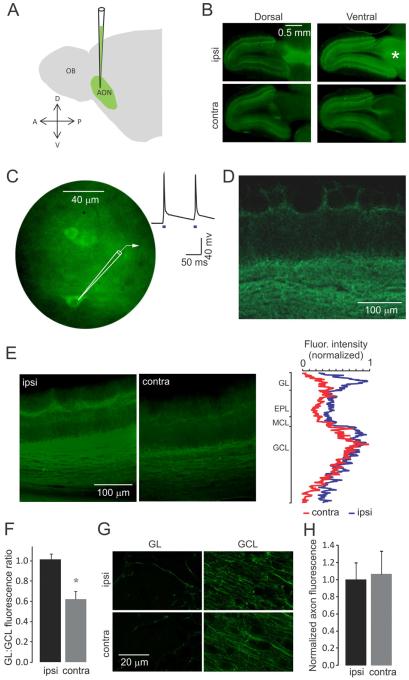
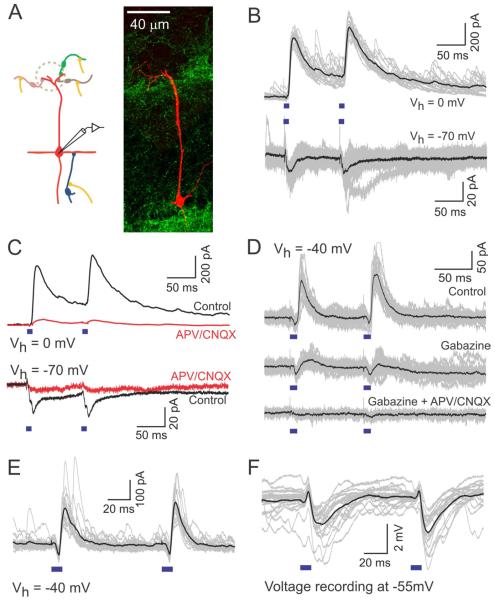
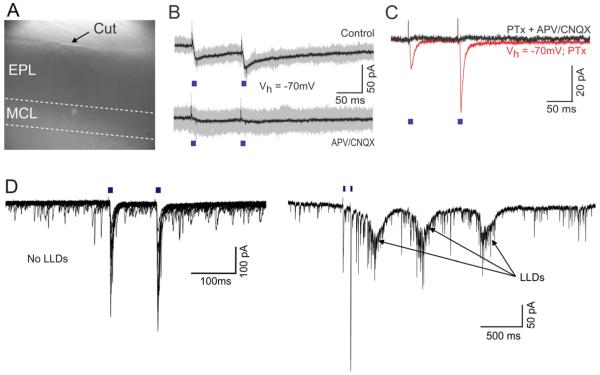
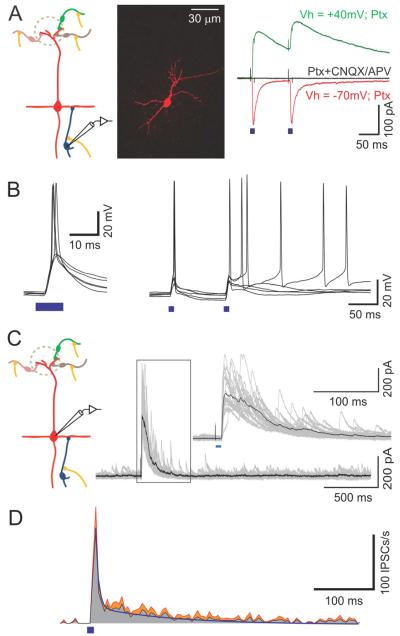
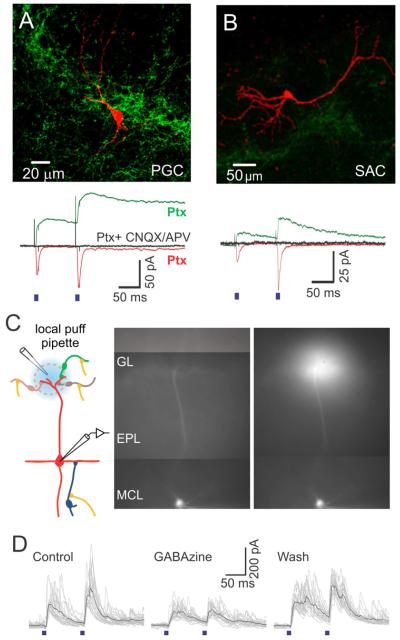
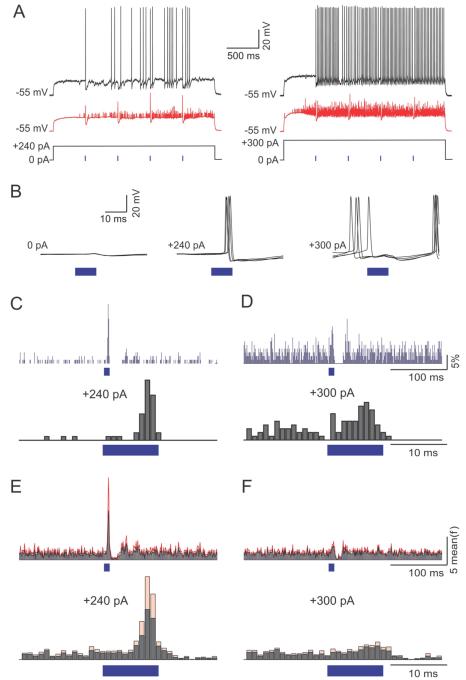
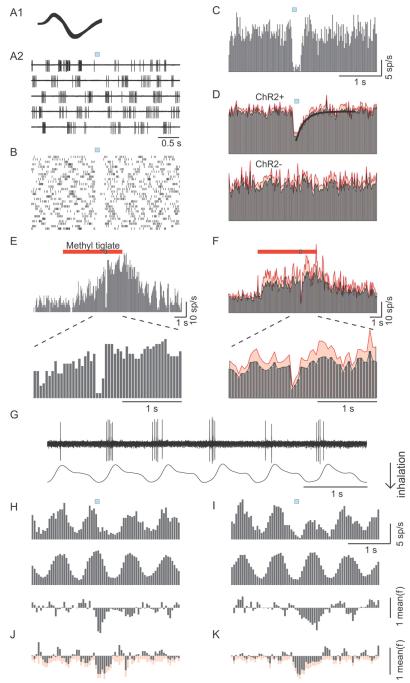
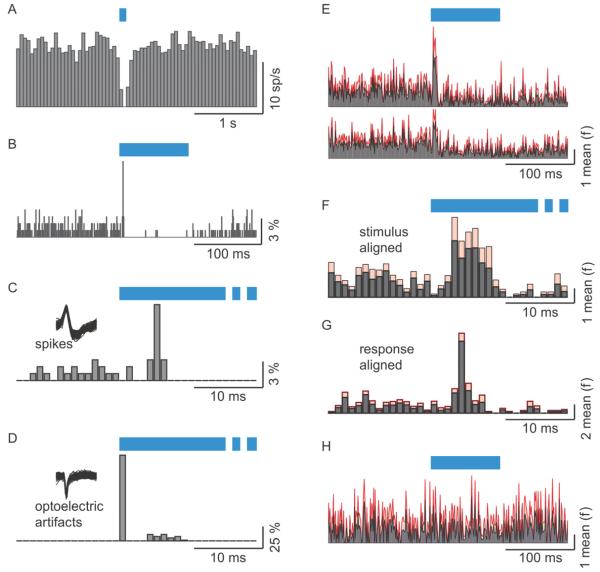
Sensory perception is not a simple feed-forward process, and higher brain areas can actively modulate information processing in "lower" areas. We used optogenetic methods to examine how cortical feedback projections affect circuits in the first olfactory processing stage, the olfactory bulb. Selective activation of back projections from the anterior olfactory nucleus/cortex (AON) revealed functional glutamatergic synaptic connections on several types of bulbar interneurons. Unexpectedly, AON axons also directly depolarized mitral cells (MCs), enough to elicit spikes reliably in a time window of a few milliseconds. MCs received strong disynaptic inhibition, a third of which arises in the glomerular layer. Activating feedback axons in vivo suppressed spontaneous as well as odor-evoked activity of MCs, sometimes preceded by a temporally precise increase in firing probability. Our study indicates that cortical feedback can shape the activity of bulbar output neurons by enabling precisely timed spikes and enforcing broad inhibition to suppress background activity.


Figures

Figure 1
Figure 1. Virus injections in the AON and ChR2 expression in AON axon terminals in the OB
(A) Schematic representation of virus injections into the AON. (B) Epifluorescence images showing expression of ChR2-EYFP in forebrain horizontal sections, two weeks post injection. ChR2-EYFP is expressed in the entire AON area of the right hemisphere (asterisk), as well as in its projections to the ipsilateral and contralateral OB. (C) Blue light stimulation evokes action potentials in AON neurons expressing ChR2-EYFP. Shown are AON neurons somata and a single trace recorded in the current clamp mode. Blue squares in this and in the following figures denote light stimulation. (D) Higher magnification confocal image of the ipsilateral OB showing the AON axons expressing ChR2-EYFP reaching all layers of the bulb. (E) Epifluorescence images of the ipsi- and contra-lateral OB. The fluorescence intensity profiles (right) show that AON axons reaching the glomerular layer are less prominent in the contralateral OB. (F) The ratio between the fluorescence intensity of the glomerular and granule cell layers is significantly lower in the contralateral bulb (mean ± SD). (G) High magnification confocal images showing AON axons in the glomerular layer (GL) and the granule cell layer (GCL) of the ipsi and contralateral OB. (H) Bar graph showing fluorescence intensity per single fiber in the ipsi- and contra-lateral OB in the GL (mean ± SD). Values are not significantly different.
Figure 2
Figure 2. Light-stimulation of AON axon terminals in slice evokes excitatory and inhibitory synaptic currents in MCs
(A) A schematic illustrating the circuit (left) and a confocal image of a reconstructed MC filled with biocytin during recording (right). (B) Light-evoked IPSCs (top) and EPSCs (bottom) recorded in different MCs at 0 and −70 mV, respectively. Black trace is the average of the individual traces shown in gray here and in the following figures. (C) Both IPSCs (top) and EPSCs (bottom) are blocked by the application of glutamatergic blockers (APV 100 μM, CNQX 10 μM). (D) Gabazine (10 μM) blocks light evoked IPSCs without affecting EPSCs. Inhibitory responses also disappear upon application of glutamatergic blockers. (E-F) Light-evoked PSCs (E) and PSPs (F) recorded in a MC in voltage (Vh = −40 mV) and current clamp (resting potential, Vm ~ −55 mV) modes, respectively. Both modes reveal both the excitatory and the inhibitory components. In MC recordings here and in other cell types below, synaptic responses to paired stimuli did not show a consistent trend for facilitation or depression.
Figure 3
Figure 3. ETCs receive excitatory inputs from AON but are not required for light evoked excitation in MCs
(A) Widefield image showing a slice in which the glomerular layer was surgically removed. (B) Light-evoked EPSCs recorded from a MC in a cut slice at −70 mV. Responses are blocked by CNQX/APV. (C) Light-evoked EPSCs recorded from an ETC in the presence of picrotoxin. Each trace is an average of 20 trials. Currents recorded before and after addition of CNQX/APV are shown in red and black respectively. (D) In a different experiment in the presence of gabazine, light-stimulation occasionally evoked LLDs in an ETC. At left are 15 trials with no LLD, and at right is an example of a response with 3 LLDs (multiple LLDs only occur when inhibition is blocked). Note different time scales for the left and right traces. On average, LLDs occurred in 7.2 ± 9.3% of trials (N = 8 cells).
Figure 4
Figure 4. Light-evoked inhibition in MCs is partially mediated by GCs
(A) Illustration of the circuit (left), a confocal image of a reconstructed GC filled with biocytin during recording (middle) and light-evoked EPSCs recorded from a GC in the presence of picrotoxin (right). Each trace is an average of 20 trials. Mixed AMPA and NMDA currents recorded at +40 mV are shown in green, AMPA only currents recorded at −70 mV are shown in red and recording with CNQX/APV at +40 mV is shown in black. (B) Light-evoked action potentials in a GC. (C) Light-evoked IPSCs recorded from a MC at 0 mV with single-pulse stimulation, showing long-lasting inhibitory responses. The insert shows a magnification of the framed area. (D) Average PSTH of the single-pulse light-evoked IPSCs from six MCs. The standard error of the mean is shown in red. The bi-exponential fit is shown as a continuous blue line.
Figure 5
Figure 5. Light-evoked inhibition in MCs is also mediated by glomerular layer interneurons
(A,B, upper panels) Confocal images of a reconstructed PGC (A) and SAC (B) filled with biocytin during recordings. (A,B, lower panels) Light-evoked EPSCs recorded from the PGC (A) and the SAC (B) in the presence of picrotoxin. Each trace is an average of 20 trials. Mixed AMPA and NMDA currents recorded at +40 mV are shown in green, AMPA only currents recorded at −70 mV are shown in red and block with CNQX/APV at +40 mV is shown in black. (C) (Left) Experimental setup for focal block of inhibition in the glomerular layer during recordings from MCs. (Right) Epifluorescence images of a MC filled with biocytin-Alexa594 before and while recording and puffing of gabazine on its apical dendrite’s tuft. The puff solution also contained Alexa594. (D) Light-evoked IPSCs in MCs before (left), during (middle), and after (right) local application of gabazine in the glomerular layer. The reduction of IPSCs by 30% reflects the weight of juxtaglomerular cells’ contribution to the light-evoked inhibition observed in MCs.
Figure 6
Figure 6. AON inputs’ effect on MC firing is dependent on basal activity levels
(A) The responses of a MC to AON inputs when either moderately (left), or highly (right) active. Moderate and high activity levels were achieved by injection of 240 and 300 pA, respectively. Black trace is a single trial and red trace is the average of 20 trials. (B) Five superimposed traces of the mitral cell’s response to AON stimulation at resting membrane potential (left), with 240 pA current injection (middle) and with 300 pA current injection (right). Note that AON stimulation induced precisely timed spikes with 240 pA current injection, but induced a pause in spiking with injection of 300 pA. (C-D) PSTHs of spike probability with 240 (C) and 300 (D) pA current injection for an exemplar cell with light stimulation at lower (top) and higher (bottom) magnification. Time bins are 1 ms. (E-F) Normalized population PSTHs of spike probability at different depolarization steps (N = 6 cells) with light stimulation at lower (top) and higher (bottom) magnification. Gray lines show the mean and red lines show the standard error of the mean. Time bins are 1 ms.
Figure 7
Figure 7. Light-stimulation of AON axon terminals in vivo reduces spontaneous and odor-evoked firing in MCs independently of breathing timing
(A-C) The response of an exemplar cell to light activation of AON fibers. (A1) Superimposed spikes recorded from the cell. (A2) Raw traces aligned to light stimulation (blue square) showing the firing of that cell. (B) Raster plot of the cell’s action potentials in 30 trials of light stimulation. (C) PSTH constructed from 60 trials of light stimulation. Time bins are 20 ms. (D) Population PSTHs of cells recorded from ChR2 expressing animals (ChR2+, N = 20 cells) and from control animals (ChR2−, N = 12 cells). The mean is shown in gray and the standard error of the mean in red. The continuous line in the top PSTH is a best fitting single exponential function. (E) PSTH of spikes from an exemplar cell responding to the odor methyl tiglate (red bar, 5 sec presentation), and being inhibited by light stimulation at 3.5 sec after odor onset (blue square embedded in the red). The PSTH expanded around the light stimulation clearly illustrates inhibition of spikes. (F) Population PSTH of all cells (N = 9 cells) responding to multiple odors, with standard error shown in red. Time bins for odor evoked PSTHs are 50 ms. (G) A simultaneous recording of a MC activity and the animal’s respiration. Note that action potentials tend to occur in the time of the transition from inhalation to exhalation. (H, I) The effect of AON input during the preferred (H) and non-preferred (I) half of the breathing cycle, for an exemplar cell. Top panels show PSTHs for light stimuli arriving at the preferred (H) and non-preferred (I) half of the breathing cycle. Middle panels show sham PSTHs that are generated by a 1 Hz sham signal for comparison purposes. Lower panels show the effect of the AON input as measured by subtracting the sham PSTHs from the light evoked PSTHs. Units of firing rates are normalized to the mean firing rate. (J, K) Population analysis (N = 9 cells) of the effect of AON input on the preferred (J) and non-preferred (K) half of the breathing cycle. Mean is shown in gray and standard error of the mean in red. Time bins for H-K are 50 ms.
Figure 8
Figure 8. Excitation of MCs by AON axons is manifested as accurately timed spikes in vivo
(A-D) Data recorded from one cell. (A) A PSTH using time bins of 50 ms. (B) A PSTH of the same data as in A but with 1 ms time bins. The height of the bars indicates the percentage of trials in which firing occurred within the corresponding time bin. (C) The same PSTH as in B, shown in an enlarged scale. (D) PSTH as in C but for the optoelectric artifact that is produced by shining light on the metal electrode. Note the difference in latency between the biological action potentials and the artifact. (E-G) Population PSTHs from cells in which excitation was statistically identified. Mean is shown in black and standard error in red. Firing probabilities are normalized to the mean (E) Population PSTH obtained with 1 ms bins. Top PSTH is for 9 of 20 cells in which a statistical test identified excitation. Bottom PSTH is for all 20 cells. (F) The same PSTH as in E (top), shown in an enlarged scale. (G) A peri-response time histogram. The histogram is aligned to the response peak and not to the stimulus. Note the difference between F and G indicating that the breadth of the PSTH in F is mostly due to the latency differences between different experiments and not to the jitter of any one cell. (H) Population PSTH at 1 ms bin resolution for 11 cells from control animals.

Comment in

References

    1. Albeanu DF, Soucy E, Sato TF, Meister M, Murthy VN. LED arrays as cost effective and efficient light sources for widefield microscopy. PLoS ONE. 2008;3:e2146. - PMC - PubMed
    1. Balu R, Pressler RT, Strowbridge BW. Multiple modes of synaptic excitation of olfactory bulb granule cells. J Neurosci. 2007;27:5621–5632. - PMC - PubMed
    1. Balu R, Strowbridge BW. Opposing inward and outward conductances regulate rebound discharges in olfactory mitral cells. J Neurophysiol. 2007;97:1959–1968. - PubMed
    1. Baluch F, Itti L. Mechanisms of top-down attention. Trends Neurosci. 2011;34:210–224. - PubMed
    1. Boyd AM, Sturgill JF, Poo C, Isaacson JS. Cortical feedback control of olfactory bulb circuits. Neuron. 2012 in press. - PMC - PubMed

Publication types

MeSH terms