. 2012 Dec 20;76(6):1189-200.
doi: 10.1016/j.neuron.2012.10.036.

Hilar mossy cell degeneration causes transient dentate granule cell hyperexcitability and impaired pattern separation

Affiliations

Hilar mossy cell degeneration causes transient dentate granule cell hyperexcitability and impaired pattern separation

Seiichiro Jinde et al. Neuron. .

Abstract

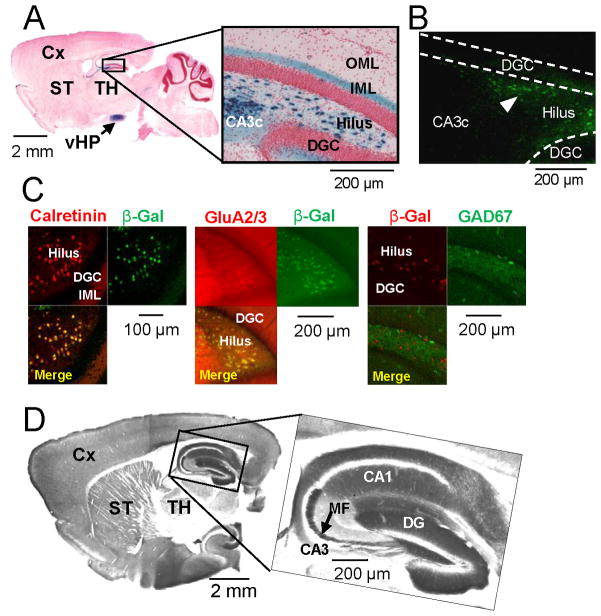
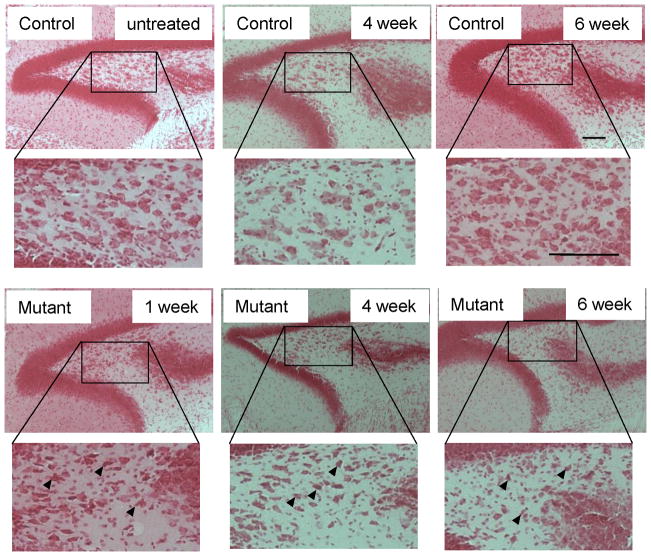
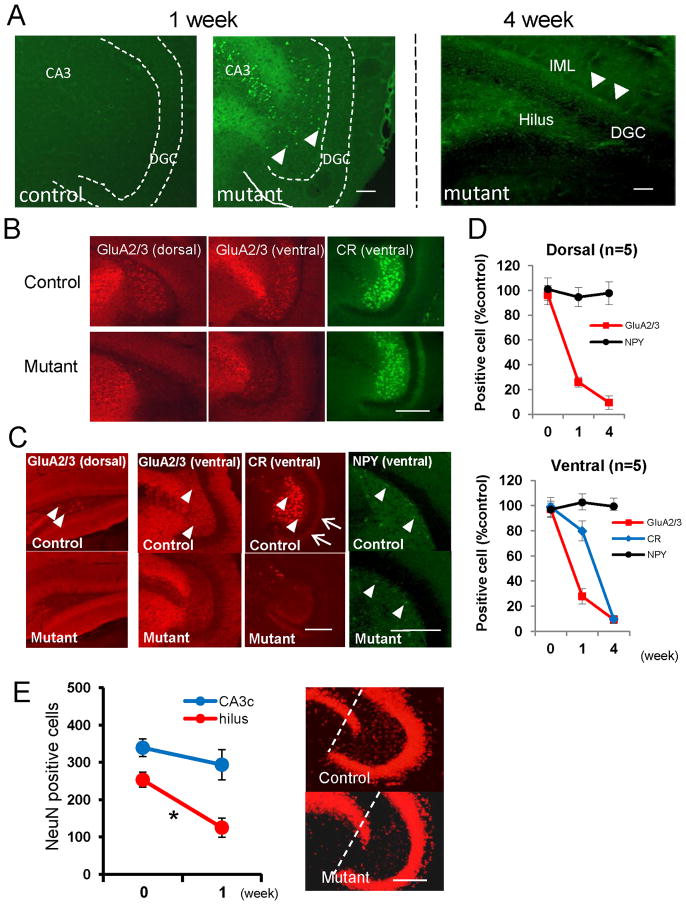
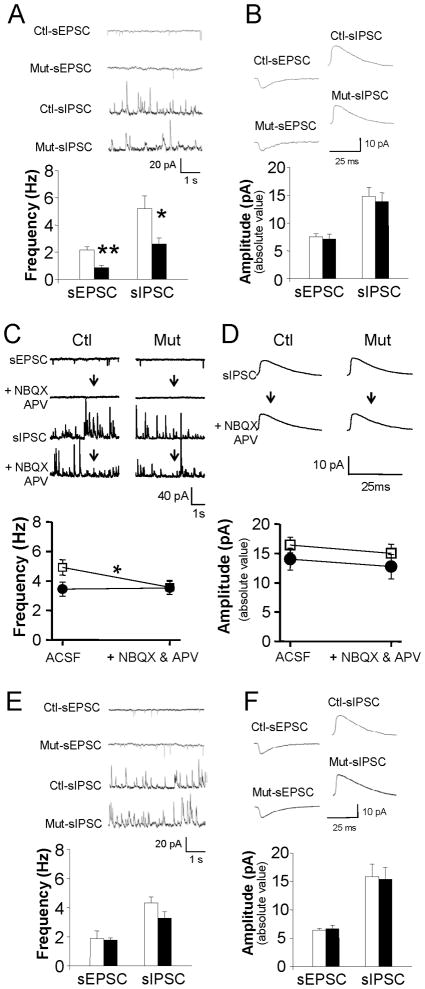
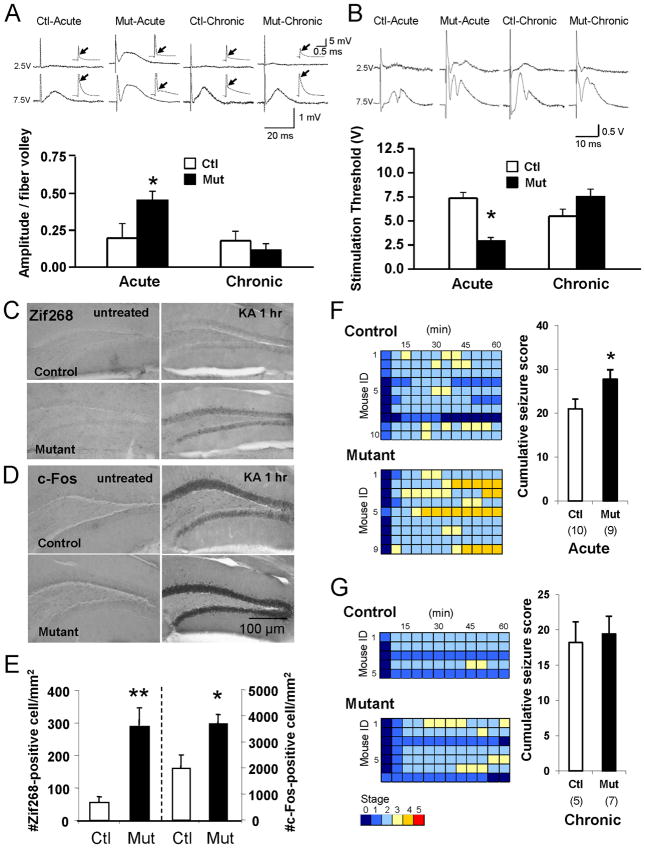
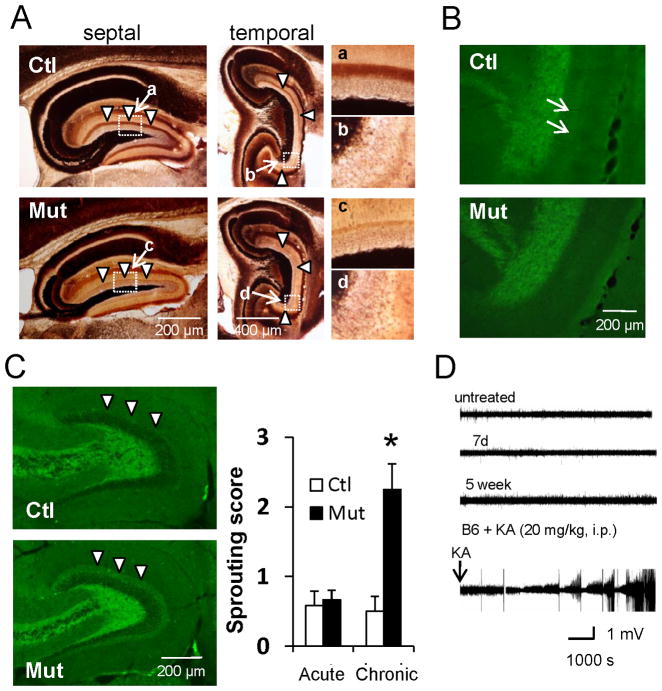
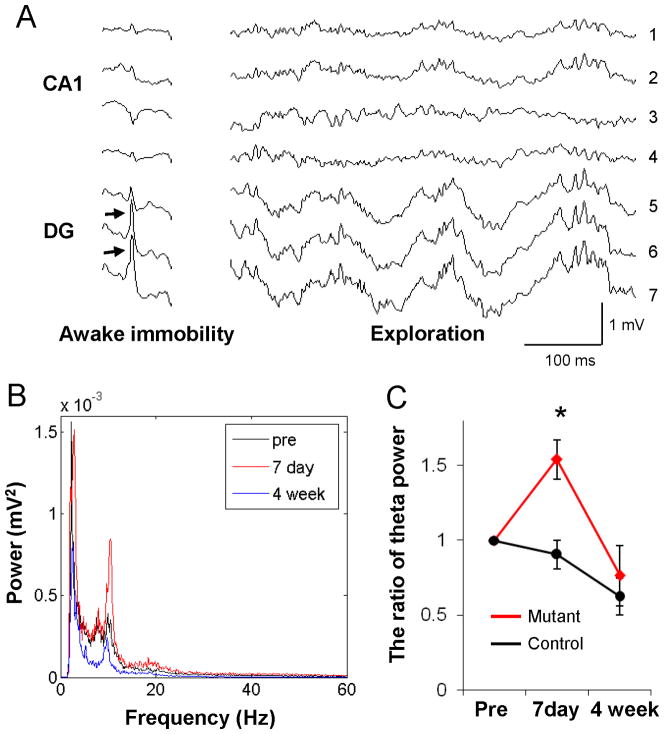
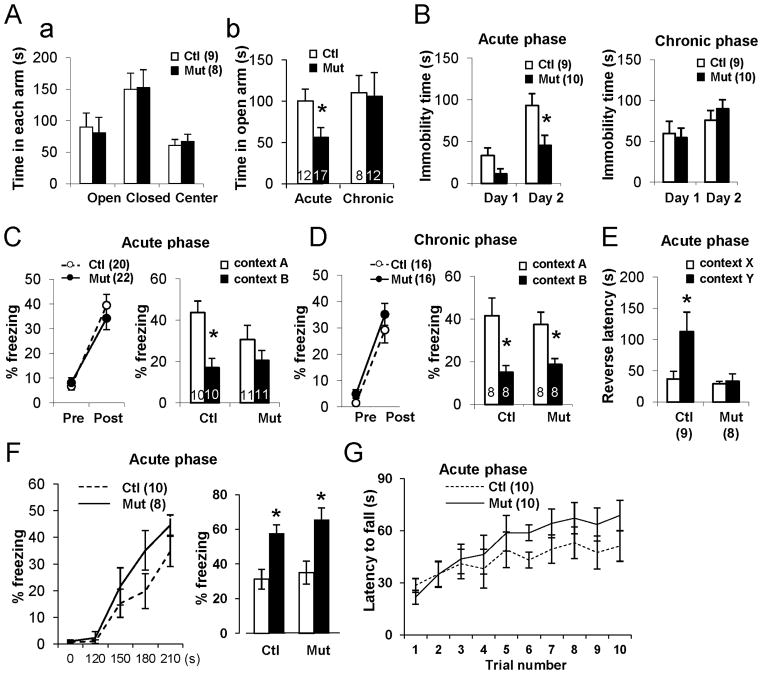
Although excitatory mossy cells of the hippocampal hilar region are known to project both to dentate granule cells and to interneurons, it is as yet unclear whether mossy cell activity's net effect on granule cells is excitatory or inhibitory. To explore their influence on dentate excitability and hippocampal function, we generated a conditional transgenic mouse line, using the Cre/loxP system, in which diphtheria toxin receptor was selectively expressed in mossy cells. One week after injecting toxin into this line, mossy cells throughout the longitudinal axis were degenerated extensively, theta wave power of dentate local field potentials increased during exploration, and deficits occurred in contextual discrimination. By contrast, we detected no epileptiform activity, spontaneous behavioral seizures, or mossy-fiber sprouting 5-6 weeks after mossy cell degeneration. These results indicate that the net effect of mossy cell excitation is to inhibit granule cell activity and enable dentate pattern separation.


Conflict of interest statement

The authors declare no conflict of interest.

Figures

Figure 1
Figure 1. Generation and characterization of Cre and floxed-diphtheria toxin receptor lines
(A–C) Generation of mossy cell/CA3-Cre transgenic line #4688. (A) A parasagittal section stained with X-gal and Safranin O from the brain of Cre mice crossed with loxP-flanked Rosa26LacZ (8-wk old) reporter line (arrow, ventral hippocampus). (B) Cre-IR in the dentate gyrus of (8-wk old) Cre mice. Note that Cre is expressed selectively in the dentate hilus (arrowhead) but not in area CA3c. (C) Confocal immunostaining images of β-gal (green, recombination product) with calretinin (red, mossy cell marker) or GluA2/3 (red, mossy cell marker), and β-gal (red) with GAD67 (green, GABAergic interneuron marker), of Cre/Rosa26LacZ double transgenic mouse show more than 90% of calretinin- or GluA2/3-positive cells are β-gal positive but no colocalization of β-gal with GAD67. (D) Alkaline phosphatase-stained parasagittal section from the brain of (8-wk old) floxed-diphtheria toxin receptor (fDTR) line-B.
Figure 2
Figure 2. Time course of mossy cell degeneration
Representative photographs of Nissl staining after diphtheria toxin (DT) administration show histological alterations in the hilar region in mutant mice (n=3 for each genotype) compared to saline- or DT-treated controls. Cellular condensation with pyknotic nuclei (arrowheads) is prominent from post-DT day 7 and more severe 4 and 6 weeks after DT treatment, and increased extra-neuronal space suggests swollen investing glial cells. Scale bar, 100 μm.
Figure 3
Figure 3. Massive neurodegeneration of mossy cells in Cre/fDTR mutants after diphtheria toxin treatment
(A) Fluoro-Jade B (FJB) staining of mutant mouse after DT treatment. Week 1: FJB-positive cells in area CA3 and dentate hilus (arrowheads) in mutants but not in DT-treated controls. Week 4: FJB-positive cell somata disappear in the hilus. Degenerated fibers in dentate hilus and IML are stained (right). (B) Acute phase staining of mossy cell markers (1 week post-DT). Representative images of immunostained sections from same animal brain. Note hilar cells no longer positive for anti-GluA2/3 but ventral hilar cells still largely positive for anti-calretinin (CR). (C) Chronic phase cell marker staining (4 weeks post-DT). Immuno-positive cells for GluA2/3 (in both dorsal and ventral hippocampi) and for calretinin are reduced in mutant mice compared to control mice, with no difference in cell numbers positive for neuropeptide Y (NPY). Arrowheads: immune-positive cells for each marker in the hilus; Arrows: CR-positive mossy cell axons in IML. (D) Number of immuno-positive cells for each marker over time in mutants (compared to controls as 100%): immediately (n=5), 1 wk (n=5), and 4 wk (n=5) post-DT. (E) NeuN-positive neurons in area CA3c and hilar region of the ventral hippocampus before and 1 wk after DT treatment. Area CA3c is between the dentate gyrus blades (see dotted lines). After DT treatment, the number of NeuN-positive neurons in the CA3c layer of mutant (n=4) does not differ significantly from that in DT-treated controls (n=4) but is robustly reduced in the mutant hilar regions, suggesting that DT affects CA3c pyramidal neurons only minimally. t-test for CA3c pyramidal neurons (p=0.37) and for hilar neurons (*p<0.01). Scale bar, 100 μm.
Figure 4
Figure 4. Acute mossy cell degeneration decreases excitatory and inhibitory inputs to granule cells
(A–B) Decreases in sEPSCs and sIPSCs frequency in dentate granule cells during the acute phase (post-DT 4–11 days) suggest that granule cells normally receive both excitatory inputs from mossy cells directly and disynaptic inhibitory inputs from mossy cells indirectly via local interneurons. t-test (**p<0.001, *p<0.03). (C–D) Mossy cell synaptic inhibition lost during the acute phase. Changes in the sEPSC frequency show that NBQX and APV abolish glutamatergic transmission. That blockade of glutamatergic transmission reduces sIPSC frequency in control slices (n=10) but not in mutants (n=6) suggests that mossy cells mediate ipsilateral feed-forward inhibition. Blockade of glutamatergic transmission does not affect sEPSC amplitudes (p=0.366). □ = control; ● = mutant (*p< 0.05). (E–F) sEPSC and sIPSC in dentate granule cells during the chronic phase. DT-mediated mossy cell ablation does not appear to affect the frequency or amplitude of sEPSC and sIPSC events. Insets: 5-s long continuous (upper left) and averaged (upper right) recordings of sEPSC and sIPSC events in chronic controls (n=8) and mutants (n=7).
Figure 5
Figure 5. Transient increase in dentate excitability in acute phase
(A) Evoked fEPSP amplitudes on perforant path show transient increase in excitability in DT-treated mutants. Insets: fEPSPs generated with 2.5 V (upper) and 7.5 V (lower) stimulation intensities. A linear curve was fit to at least two data points per slice. Mean values from slices calculated for both controls (n=6) and mutants (n=7) in both the acute and chronic phase post-DT were averaged per animal to calculate mean amplitude/fiber volley. Arrows: location of fiber volley. (B) Mossy cell ablation transiently decreases population spike threshold in mutants. Insets: 0.05 ms stimuli with intensities of 2.5V (upper) and 7.5V (lower). Stimulation threshold is minimum intensity (1, 2.5, 5, 7.5, or 10 V) needed to evoke high-fidelity population spikes. When no population spikes were evoked at 10 V, the threshold was arbitrarily set at 12.5 V. Acute control (n=7), acute mutant (n=9), chronic control (n=8), chronic mutant (n=8). (C–E) Immediate early gene expression increases after KA treatment in mutants. (C) Representative photomicrographs of granule cells’ Zif268 expression in acute phase (upper) controls (Racine scale seizure score = 3) and (lower) mutants (seizure score = 4) untreated (left) and 1 hr after KA treatment (right, 20mg/kg, i.p.). (D) c-Fos in (upper) controls and (lower) mutants, (left) untreated and (right) 1 hr after KA treatment (20mg/kg, i.p.). (E) Acute phase, KA-induced expression of Zif268 and c-Fos is much more robust in mutants (n=8) than in controls (n=8). t-test (*p<0.05, **p<0.01). (F–G) Mutants more susceptible to KA-induced seizures during acute phase but not in chronic phase. (F) (Left) Time course of seizure severity following KA treatment (20 mg/kg, i.p.) in acute phase (lower) mutants and (upper) controls. Each animal’s maximum seizure score was measured every 5 min over a 2-hr period. Timescale in one box is 5 min. (Right) Columns represent the cumulative seizure score measured over a 1-hr period after KA injection. t-test (*p<0.05). Number in parentheses indicates number of animals. Note that KA-induced seizures are more severe in mutant mice than in controls. (G) (Left) Time course of seizure severity following KA treatment (20 mg/kg, i.p.) in chronic phase (lower) mutants and (upper) controls. Otherwise same as Figure 5F. (Right) Cumulative seizure scores are the same in mutants and controls in the chronic phase.
Figure 6
Figure 6. Functional changes after mossy cell loss
(A) Timm staining of septal and temporal hippocampi during the chronic phase after mossy cell loss. Mutants show no mossy fiber sprouting and mossy cell axon terminal band-like staining in IML (arrowheads) almost disappears. (B) ZnT3-IR in mutants shows no mossy fiber sprouting and loss of mossy cell axon terminal band-like staining in IML (see arrows in control). (C) (Left) Hippocampal GAD67-IR during chronic phase. (Right) The sprouting score (modified Tauck and Nadler method) is higher in mutant IML than in controls (arrowheads). Mann-Whitney U-test (*p<0.05). (D) Representative 2 hr traces of in vivo LFP recorded from mutant mouse before treatment (untreated) and 7 days (acute phase) and 5 weeks (chronic phase) after DT treatment. Epileptic LFP events following KA injection (20 mg/kg i.p.) to wild-type mouse are also shown. No obvious epileptiform discharges were observed following DT treatment.
Figure 7
Figure 7. Transient increase in theta oscillatory powers in acute phase
(A) Field activity in the CA1-dentate axis of hippocampus during awake immobility and exploration (recorded simultaneously from 7 sites at 50–100 μm tip intervals). Arrows in the granule cell layer or hilar region (electrodes #6 & #7) of dentate gyrus indicate dentate spikes during immobility in control mice. LFP activity containing dentate spikes and large theta-gamma oscillations, typical patterns of which are in electrode #7, were analyzed further. (B) Averaged intensity of 7–12 Hz theta frequency LFP powers during exploration recorded just before DT injection (pre, black), on day 7 (7 day, red), and 4-weeks (blue) after treatment from the same electrode (located in the dentate gyrus) in the mutant mouse. (C) The ratio change of theta power (7–12 Hz) intensity across days (pre DT levels as 100%). Mutant mice (n=3, red line) show a transient increase in the theta frequency power at post-DT day 7, whereas the controls do not (n=3, black line), *p<0.05.
Figure 8
Figure 8. Mossy cell loss followed by increased anxiety and impaired contextual discrimination
(A) Mice with acute-phase mossy cell degeneration show anxiety-like behavior in elevated plus maze. (a) Before DT treatment, no difference by genotype in time spent in each arm of maze. (b) After DT treatment, mutants spend less time in open arm during acute but not chronic phase of DT exposure. t-test (*p<0.05). (B) Decreased immobility on second day of a 2-day forced swimming test observed in mutants only in acute phase (*p<0.05). (C) Contextual discrimination using one-trial contextual fear conditioning during acute phase. (Left) Both controls (○) and mutants (●) freeze equally after a single foot shock. (Right) 24 hr after learning, mutants but not controls are unable to distinguish context A from context B. Genotype–context interaction F(1, 38)=4.58 (P<0.05); Newman–Keuls post hoc test (*p<0.05 for control, p=0.29 for mutant). (D) One-trial contextual fear conditioning during chronic phase. 24 hr after foot shock, mutant and control mice both distinguish two contexts. Context effect F(1, 28)=11.1 (p<0.01); Newman–Keuls post hoc test (*p<0.05 for control, *p<0.05 for mutant). (E) Contextual discrimination in one-trial step-through avoidance test during the acute phase. 24 hr after shock, mutants escape latency from context Y (non-shocked) does not differ from that of context X (shocked), while controls display a longer escape latency from context Y than from context X. Genotype-context interaction, F(1, 30)=4.55 (p<0.05). Newman-Keuls post-hoc test, X vs Y (*p<0.05 for control, p=0.73 for mutant). (F) Cued-fear conditioning. Delivered during the acute phase, two sets of paired tone (CS) and foot-shocks (US) for conditioning (Left) and recall tests 24-hr later (Right) before (white bar) and during tone presentation (black bar) revealed no differences by genotype. Genotype effect, F(1, 34)=0.95. p=0.34, Newman-Keuls post hoc test (*p<0.02 for both genotypes). (G) As assessed by the accelerating rotarod test, balance and motor coordination in mutants and controls was normal. Animal number is indicated in parentheses or plot bars.

References

    1. Amaral DG. A Golgi study of cell types in the hilar region of the hippocampus in the rat. J Comp Neurol. 1978;182:851–914. - PubMed
    1. Amaral DG, Witter MP. The three-dimensional organization of the hippocampal formation: a review of anatomical data. Neuroscience. 1989;31:571–591. - PubMed
    1. Bannerman DM, Grubb M, Deacon RM, Yee BK, Feldon J, Rawlins JN. Ventral hippocampal lesions affect anxiety but not spatial learning. Behav Brain Res. 2003;139:197–213. - PubMed
    1. Belforte JE, Zsiros V, Sklar ER, Jiang Z, Yu G, Li Y, Quinlan EM, Nakazawa K. Postnatal NMDA receptor ablation in corticolimbic interneurons confers schizophrenia-like phenotypes. Nat Neurosci. 2010;13:76–83. - PMC - PubMed
    1. Bilkey DK, Goddard GV. Septohippocampal and commissural pathways antagonistically control inhibitory interneurons in the dentate gyrus. Brain Res. 1987;405:320–325. - PubMed

Substances