

Insights into sphingolipid miscibility: separate observation of sphingomyelin and ceramide N-acyl chain melting
- PMID: 23260048
- PMCID: PMC3525848
- DOI: 10.1016/j.bpj.2012.10.041
Insights into sphingolipid miscibility: separate observation of sphingomyelin and ceramide N-acyl chain melting
Abstract
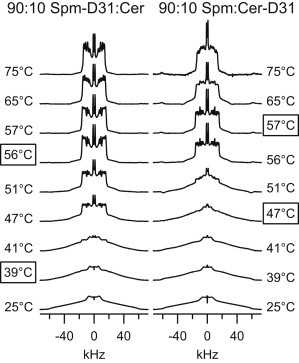
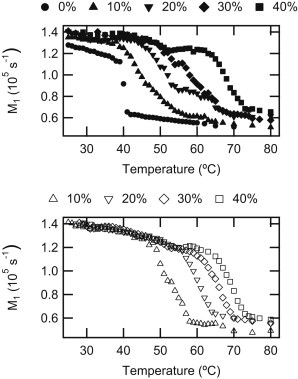
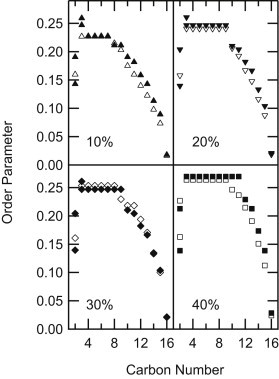
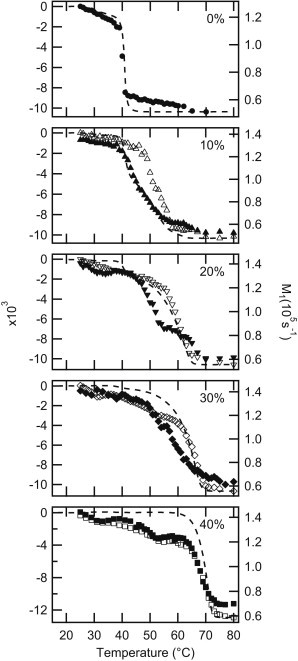
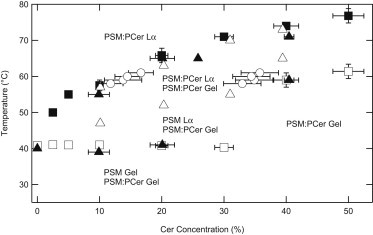
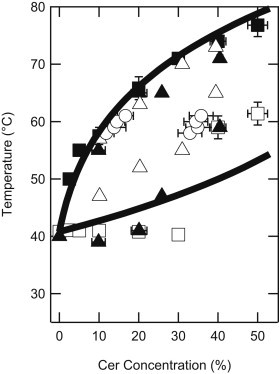
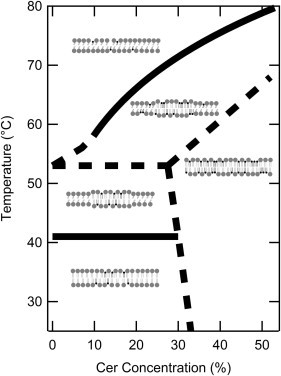
Ceramide produced from sphingomyelin in the plasma membrane is purported to affect signaling through changes in the membrane's physical properties. Thermal behavior of N-palmitoyl sphingomyelin (PSM) and N-palmitoyl ceramide (PCer) mixtures in excess water has been monitored by ²H NMR spectroscopy and compared to differential scanning calorimetry (DSC) data. The alternate use of either perdeuterated or proton-based N-acyl chain PSM and PCer in our ²H NMR studies has allowed the separate observation of gel-fluid transitions in each lipid in the presence of the other one, and this in turn has provided direct information on the lipids' miscibility over a wide temperature range. The results provide further evidence of the stabilization of the PSM gel state by PCer. Moreover, overlapping NMR and DSC data reveal that the DSC-signals parallel the melting of the major component (PSM) except at intermediate (20 and 30 mol %) fractions of PCer. In such cases, the DSC endotherm reports on the presumably highly cooperative melting of PCer. Up to at least 50 mol % PCer, PSM and PCer mix ideally in the liquid crystalline phase; in the gel phase, PCer becomes incorporated into PSM:PCer membranes with no evidence of pure solid PCer.
Copyright © 2012 Biophysical Society. Published by Elsevier Inc. All rights reserved.
Figures
Similar articles
-
The many faces (and phases) of ceramide and sphingomyelin II - binary mixtures.Biophys Rev. 2017 Oct;9(5):601-616. doi: 10.1007/s12551-017-0298-y. Epub 2017 Aug 19. Biophys Rev. 2017. PMID: 28823080 Free PMC article. Review.
-
Lamellar Phases Composed of Phospholipid, Cholesterol, and Ceramide, as Studied by 2H NMR.Biophys J. 2019 Jul 23;117(2):296-306. doi: 10.1016/j.bpj.2019.05.027. Epub 2019 Jun 19. Biophys J. 2019. PMID: 31279446 Free PMC article.
-
Coexistence of immiscible mixtures of palmitoylsphingomyelin and palmitoylceramide in monolayers and bilayers.Biophys J. 2009 Nov 18;97(10):2717-26. doi: 10.1016/j.bpj.2009.08.040. Biophys J. 2009. PMID: 19917225 Free PMC article.
-
Lateral Segregation of Palmitoyl Ceramide-1-Phosphate in Simple and Complex Bilayers.Biophys J. 2019 Jul 9;117(1):36-45. doi: 10.1016/j.bpj.2019.05.015. Epub 2019 May 21. Biophys J. 2019. PMID: 31133285 Free PMC article.
-
The many faces (and phases) of ceramide and sphingomyelin I - single lipids.Biophys Rev. 2017 Oct;9(5):589-600. doi: 10.1007/s12551-017-0297-z. Epub 2017 Aug 16. Biophys Rev. 2017. PMID: 28815463 Free PMC article. Review.
Cited by
-
Ceramide-C16 Is a Versatile Modulator of Phosphatidylethanolamine Polymorphism.Biophys J. 2017 Jun 6;112(11):2357-2366. doi: 10.1016/j.bpj.2017.04.047. Biophys J. 2017. PMID: 28591608 Free PMC article.
-
Exploring polar headgroup interactions between sphingomyelin and ceramide with infrared spectroscopy.Sci Rep. 2020 Oct 19;10(1):17606. doi: 10.1038/s41598-020-74781-8. Sci Rep. 2020. PMID: 33077787 Free PMC article.
-
The many faces (and phases) of ceramide and sphingomyelin II - binary mixtures.Biophys Rev. 2017 Oct;9(5):601-616. doi: 10.1007/s12551-017-0298-y. Epub 2017 Aug 19. Biophys Rev. 2017. PMID: 28823080 Free PMC article. Review.
-
Lamellar Phases Composed of Phospholipid, Cholesterol, and Ceramide, as Studied by 2H NMR.Biophys J. 2019 Jul 23;117(2):296-306. doi: 10.1016/j.bpj.2019.05.027. Epub 2019 Jun 19. Biophys J. 2019. PMID: 31279446 Free PMC article.
References
-
- Hannun Y.A., Loomis C.R., Bell R.M. Sphingosine inhibition of protein kinase C activity and of phorbol dibutyrate binding in vitro and in human platelets. J. Biol. Chem. 1986;261:12604–12609. - PubMed
-
- Kolesnick R.N. 1,2-Diacylglycerols but not phorbol esters stimulate sphingomyelin hydrolysis in GH3 pituitary cells. J. Biol. Chem. 1987;262:16759–16762. - PubMed
-
- Goni F.M., Montes L.R., Alonso A. Phospholipases C and sphingomyelinases: lipids as substrates and modulators of enzyme activity. Prog. Lipid Res. 2012;51:238–266. - PubMed
Publication types
MeSH terms
Substances
LinkOut - more resources
Full Text Sources
Molecular Biology Databases
Miscellaneous
