

Mechanistic insights into reversible photoactivation in proteins of the GFP family
- PMID: 23260054
- PMCID: PMC3525849
- DOI: 10.1016/j.bpj.2012.11.011
Mechanistic insights into reversible photoactivation in proteins of the GFP family
Abstract
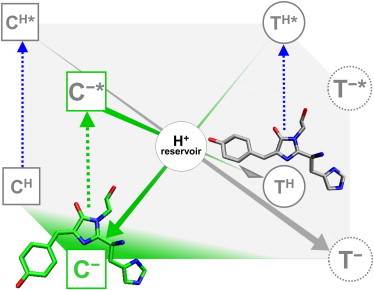
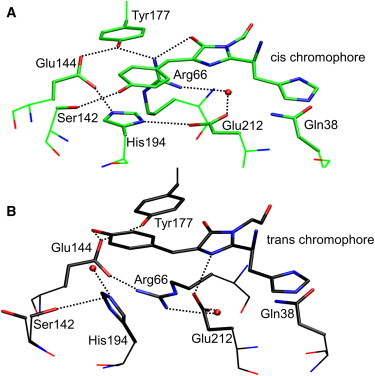
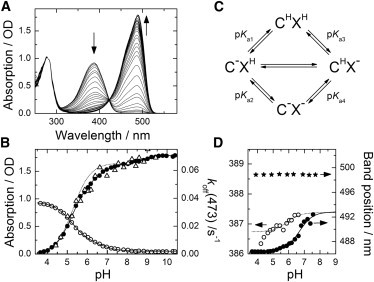
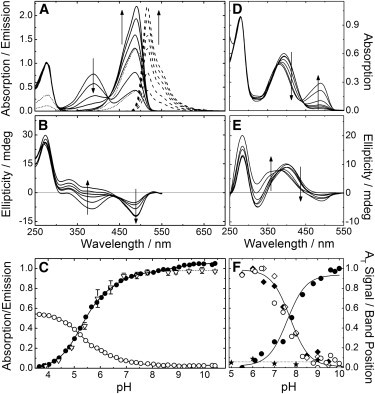
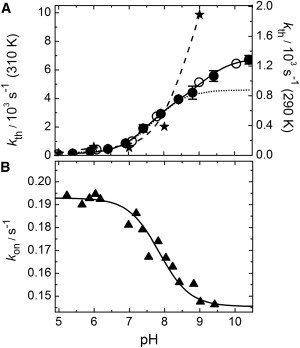
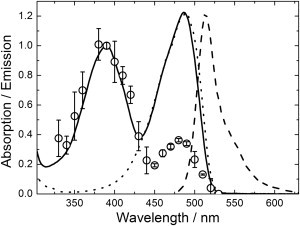
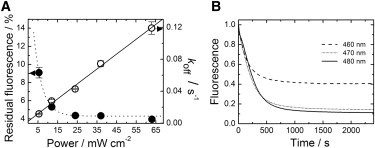
Light-controlled modification of the fluorescence emission properties of proteins of the GFP family is of crucial importance for many imaging applications including superresolution microscopy. Here, we have studied the reversibly photoswitchable fluorescent protein mIrisGFP using optical spectroscopy. By analyzing the pH dependence of isomerization and protonation equilibria and the isomerization kinetics, we have obtained insight into the coupling of the chromophore to the surrounding protein moiety and a better understanding of the photoswitching mechanism. A different acid-base environment of the chromophore's protonating group in its two isomeric forms, which can be inferred from the x-ray structures of IrisFP, is key to the photoswitching function and ensures that isomerization and protonation are correlated. Amino acids near the chromophore, especially Glu212, rearrange upon isomerization, and Glu212 protonation modulates the chromophore pK(a). In mIrisGFP, the cis chromophore protonates in two steps, with pK(cis) of 5.3 and 6, which is much lower than pK(trans) (>10). Based on these results, we have put forward a mechanistic scheme that explains how the combination of isomeric and acid-base properties of the chromophore in its protein environment can produce negative and positive photoswitching modes.
Copyright © 2012 Biophysical Society. Published by Elsevier Inc. All rights reserved.
Figures
Similar articles
-
Chromophore protonation state controls photoswitching of the fluoroprotein asFP595.PLoS Comput Biol. 2008 Mar 21;4(3):e1000034. doi: 10.1371/journal.pcbi.1000034. PLoS Comput Biol. 2008. PMID: 18369426 Free PMC article.
-
Photoswitching of E222Q GFP mutants: "concerted" mechanism of chromophore isomerization and protonation.Photochem Photobiol Sci. 2010 Oct 28;9(10):1307-19. doi: 10.1039/c0pp00189a. Epub 2010 Sep 21. Photochem Photobiol Sci. 2010. PMID: 20859582 Review.
-
Molecular Dynamic Indicators of the Photoswitching Properties of Green Fluorescent Proteins.J Phys Chem B. 2015 Sep 10;119(36):12007-16. doi: 10.1021/acs.jpcb.5b04826. Epub 2015 Aug 31. J Phys Chem B. 2015. PMID: 26305506
-
Disentangling Chromophore States in a Reversibly Switchable Green Fluorescent Protein: Mechanistic Insights from NMR Spectroscopy.J Am Chem Soc. 2021 May 19;143(19):7521-7530. doi: 10.1021/jacs.1c02442. Epub 2021 May 9. J Am Chem Soc. 2021. PMID: 33966387
-
Reversible photoswitching in fluorescent proteins: a mechanistic view.IUBMB Life. 2012 Jun;64(6):482-91. doi: 10.1002/iub.1023. Epub 2012 Apr 25. IUBMB Life. 2012. PMID: 22535712 Review.
Cited by
-
Super-resolution localization microscopy with photoactivatable fluorescent marker proteins.Protoplasma. 2014 Mar;251(2):349-62. doi: 10.1007/s00709-013-0566-z. Epub 2013 Oct 27. Protoplasma. 2014. PMID: 24162869 Review.
-
Fluorescent proteins of the EosFP clade: intriguing marker tools with multiple photoactivation modes for advanced microscopy.RSC Chem Biol. 2021 Mar 31;2(3):796-814. doi: 10.1039/d1cb00014d. eCollection 2021 Jun 1. RSC Chem Biol. 2021. PMID: 34458811 Free PMC article. Review.
-
Positive-Type Reversibly Photoswitching Red Fluorescent Protein for Dual-Color Superresolution Imaging with Single Light Exposure for Off-Switching.ACS Nano. 2025 Feb 25;19(7):7188-7201. doi: 10.1021/acsnano.4c16847. Epub 2025 Feb 12. ACS Nano. 2025. PMID: 39937184 Free PMC article.
-
Structural Evidence of Photoisomerization Pathways in Fluorescent Proteins.J Am Chem Soc. 2019 Oct 2;141(39):15504-15508. doi: 10.1021/jacs.9b08356. Epub 2019 Sep 24. J Am Chem Soc. 2019. PMID: 31533429 Free PMC article.
-
Correlative super-resolution fluorescence and electron microscopy using conventional fluorescent proteins in vacuo.J Struct Biol. 2017 Aug;199(2):120-131. doi: 10.1016/j.jsb.2017.05.013. Epub 2017 May 30. J Struct Biol. 2017. PMID: 28576556 Free PMC article.
References
-
- Tsien R.Y. The green fluorescent protein. Annu. Rev. Biochem. 1998;67:509–544. - PubMed
-
- Ormö M., Cubitt A.B., Remington S.J. Crystal structure of the Aequorea victoria green fluorescent protein. Science. 1996;273:1392–1395. - PubMed
-
- Zimmer M. Green fluorescent protein (GFP): applications, structure, and related photophysical behavior. Chem. Rev. 2002;102:759–781. - PubMed
-
- Remington S.J. Fluorescent proteins: maturation, photochemistry and photophysics. Curr. Opin. Struct. Biol. 2006;16:714–721. - PubMed
-
- Chudakov D.M., Lukyanov S., Lukyanov K.A. Fluorescent proteins as a toolkit for in vivo imaging. Trends Biotechnol. 2005;23:605–613. - PubMed
Publication types
MeSH terms
Substances
LinkOut - more resources
Full Text Sources
Other Literature Sources
