. 2012 Dec 19;103(12):2532-40.
doi: 10.1016/j.bpj.2012.10.037. Epub 2012 Dec 18.

Limitations of time-resolved fluorescence suggested by molecular simulations: assessing the dynamics of T cell receptor binding loops

Affiliations

Limitations of time-resolved fluorescence suggested by molecular simulations: assessing the dynamics of T cell receptor binding loops

Daniel R Scott et al. Biophys J. .

Abstract

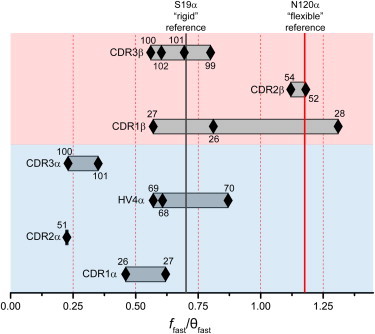
Time-resolved fluorescence anisotropy (TRFA) has a rich history in evaluating protein dynamics. Yet as often employed, TRFA assumes that the motional properties of a covalently tethered fluorescent probe accurately portray the motional properties of the protein backbone at the probe attachment site. In an extensive survey using TRFA to study the dynamics of the binding loops of a αβ T cell receptor, we observed multiple discrepancies between the TRFA data and previously published results that led us to question this assumption. We thus simulated several of the experimentally probed systems using a protocol that permitted accurate determination of probe and protein time correlation functions. We found excellent agreement in the decays of the experimental and simulated correlation functions. However, the motional properties of the probe were poorly correlated with those of the backbone of both the labeled and unlabeled protein. Our results warrant caution in the interpretation of TRFA data and suggest further studies to ascertain the extent to which probe dynamics reflect those of the protein backbone. Meanwhile, the agreement between experiment and computation validates the use of molecular dynamics simulations as an accurate tool for exploring the molecular motion of T cell receptors and their binding loops.


Figures

Figure 1
Figure 1
Structure of the αβ TCR A6 indicating the various binding loops and the sites that were analyzed via time-resolved fluorescence anisotropy.
Figure 2
Figure 2
Experimental and computed correlation functions for the F5M probe attached to select sites on the A6 TCR indicate a wide range of site-specific flexibility. (A) Time-resolved fluorescence anisotropy decays for F5M-labeled S100Cα, M27Cβ, N28Cβ, A99Cβ, and R102Cβ mutants. (B) Computed time correlation functions of a vector in the F5M ring in simulations of F5M-labeled protein. The five simulated sites and the color scheme are the same as those in panel A. The black curve represents the correlation function of the free F5M molecule. The inset shows the F5M molecule with the atoms defining the vector for computing correlation functions circled in green.
Figure 3
Figure 3
Backbone flexibility in the binding loops of the A6 TCR as indicated by TRFA. The values of the ffast/θfast ratios for 17 sites in the various loops are represented as diamonds, with the number of each position denoted next to each diamond. Low ffast/θfast ratios and thus low flexibility are at the left and high ffast/θfast ratios and high flexibility are at the right. The locations of the position 19α rigid reference and the position 120α flexible reference are indicated by vertical lines. A wide range of flexibility is indicated, both between and within the various loops.
Figure 4
Figure 4
Experimental and simulated f/θ ratios are in excellent agreement, showing that the MD simulations accurately reflect the dynamics of the F5M probe attached to the protein. The solid line is a linear fit to the data, with a correlation coefficient (R) of 0.91 and a slope of 0.94.
Figure 5
Figure 5
Motion of the protein backbone is poorly correlated with motion of the F5M probe. (A) Average of the correlation coefficients between amino acid α carbons and the 12 carbon atoms of the fluorescein ring system for the five simulated systems. The values are shown for the cysteine at the probe attachment site and neighboring amino acids. Correlations are weak in all cases, indicating that the motion of the probe is poorly correlated with the motion of the protein backbone. The scale, indicated below the panel, ranges from −1 (full negative correlation, colored blue) to 1 (full positive correlation, colored red). (B) Average correlation coefficients of individual F5M atoms with the cysteine's N, Cα, and C atoms mapped to the structure of the F5M probe for each simulated system. The color scheme is the same in panel A. For reference, values are indicated for the α carbon of the cysteine and the distal oxygen atom of the fluorescein's three-membered ring.
Figure 6
Figure 6
Motional properties of the backbone in the labeled or unlabeled WT protein do not reflect those of the fluorescent probe. The bars show average C values (analogous to NMR order parameters) for the backbone of the cysteine in the labeled protein (dark gray bars), the same position in the unlabeled WT protein (light gray bars), and the ring of the F5M probe in the labeled protein (hatched bars). Error bars for the backbone are the standard deviations of the C values for the N-H, Cα-Cβ, and C-O vectors. Fitting errors of the individual C measurements were <1% of the reported value.

References

    1. Kirchberg K., Kim T.-Y., Alexiev U. Conformational dynamics of helix 8 in the GPCR rhodopsin controls arrestin activation in the desensitization process. Proc. Natl. Acad. Sci. USA. 2011;108:18690–18695. - PMC - PubMed
    1. Boyd A.E., Dunlop C.S., Johnson D.A. Nanosecond dynamics of acetylcholinesterase near the active center gorge. J. Biol. Chem. 2004;279:26612–26618. - PubMed
    1. Hibbs R.E., Johnson D.A., Taylor P. Structural dynamics of the alpha-neurotoxin-acetylcholine-binding protein complex: hydrodynamic and fluorescence anisotropy decay analyses. Biochemistry. 2005;44:16602–16611. - PubMed
    1. Hibbs R.E., Radic Z., Johnson D.A. Influence of agonists and antagonists on the segmental motion of residues near the agonist binding pocket of the acetylcholine-binding protein. J. Biol. Chem. 2006;281:39708–39718. - PubMed
    1. Kim T.-Y., Schlieter T., Alexiev U. Activation and molecular recognition of the GPCR rhodopsin - insights from time-resolved fluorescence depolarisation and single molecule experiments. Eur. J. Cell Biol. 2012;91:300–310. - PubMed

Publication types

MeSH terms

Substances

LinkOut - more resources