

Assay validation for the assessment of adipogenesis of multipotential stromal cells--a direct comparison of four different methods
- PMID: 23260089
- PMCID: PMC3539160
- DOI: 10.1016/j.jcyt.2012.07.001
Assay validation for the assessment of adipogenesis of multipotential stromal cells--a direct comparison of four different methods
Abstract
Background aims: Mesenchymal stromal cells (MSCs) are regenerative and immuno-privileged cells that are used for both tissue regeneration and treatment of severe inflammation-related disease. For quality control of manufactured MSC batches in regard to mature fat cell contamination, a quantitative method for measuring adipogenesis is needed.
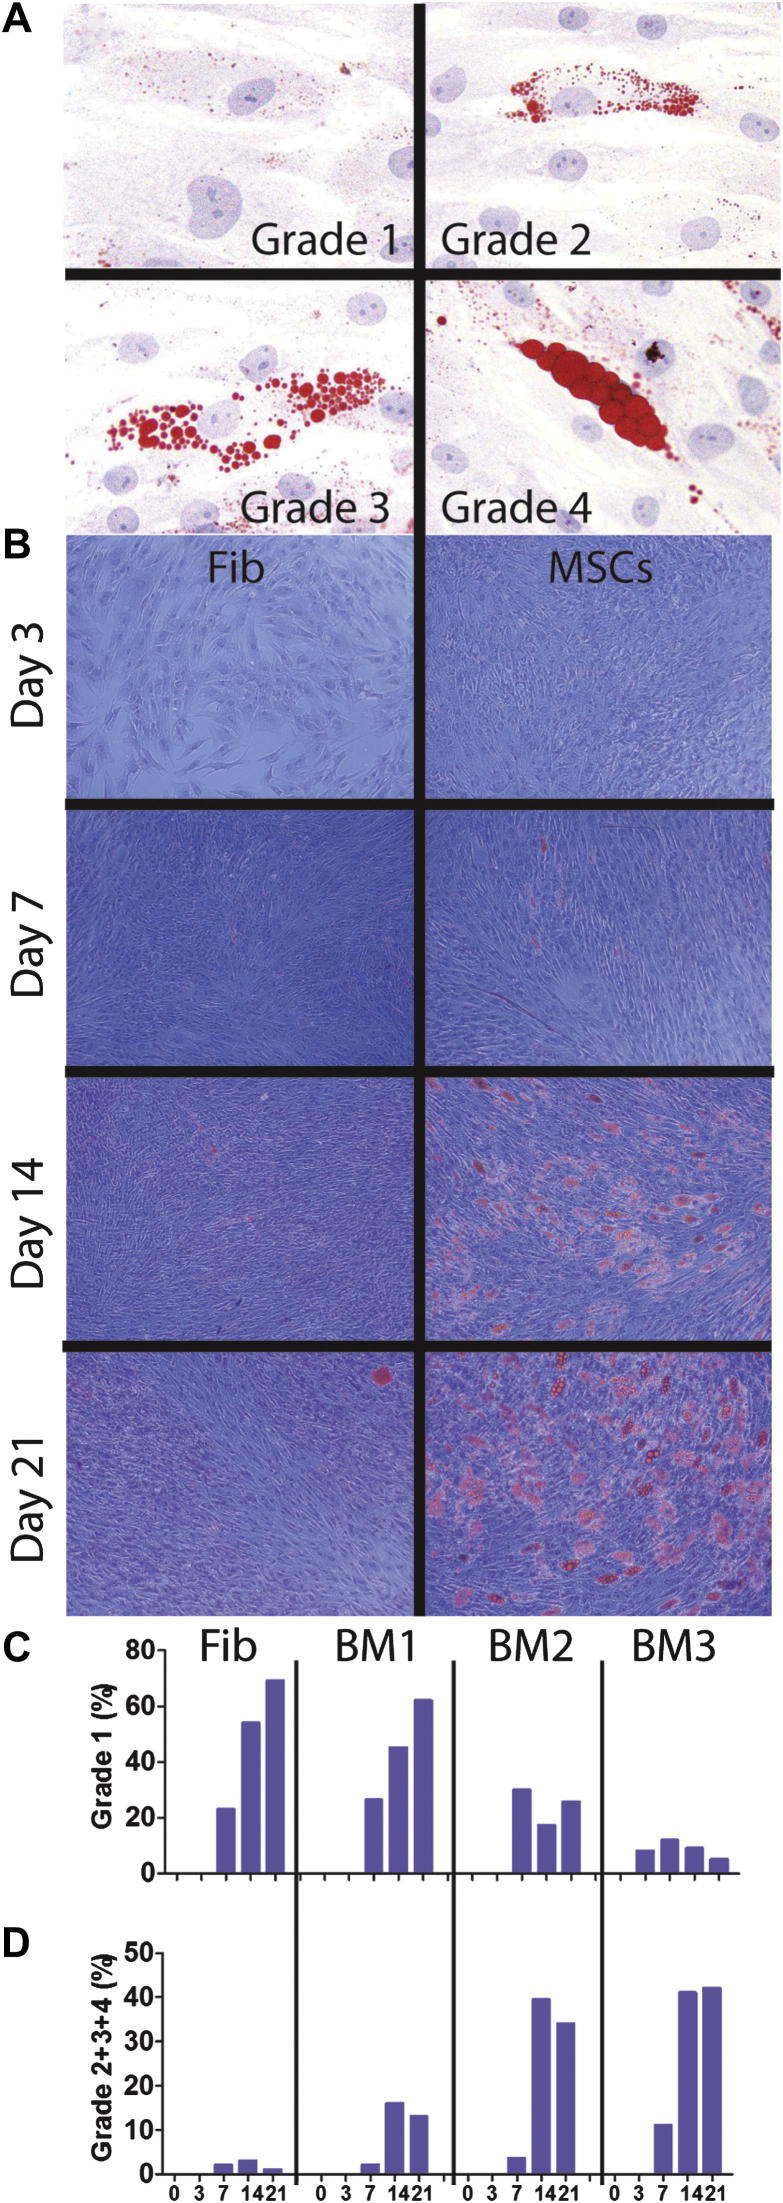
Methods: Four previously proposed methods were validated with the use of bone marrow (BM) MSCs during a 21-day in vitro assay. Oil red staining was scored semiquantitatively; peroxisome proliferator activated receptor-γ and fatty acid binding protein (FABP)4 transcripts were measured by quantitative real-time polymerase chain reaction; FABP4 protein accumulation was evaluated by flow cytometry; and Nile red/4',6-diamidino-2-phenylindole (DAPI) ratios were measured in fluorescent microplate assay. Skin fibroblasts and MSCs from fat pad, cartilage and umbilical cord were used as controls.
Results: Oil red staining indicated considerable heterogeneity between BM donors and individual cells within the same culture. FABP4 transcript levels increased 100- to 5000-fold by day 21, with large donor variability observed. Flow cytometry revealed increasing intra-culture heterogeneity over time; more granular cells accumulated more FABP4 protein and Nile red fluorescence compared with less granular cells. Nile red increase in day-21 MSCs was ~5- and 4-fold, measured by flow cytometry or microplate assay, respectively. MSC proliferation/apoptosis was accounted through the use of Nile red/DAPI ratios; adipogenesis levels in day-21 BM MSCs increased ~13-fold, with significant correlations with oil red scoring observed for MSC from other sources.
Conclusions: Flow cytometry permits the study of MSC differentiation at the single-cell level and sorting more and less mature cells from mixed cell populations. The microplate assay with the use of the Nile red/DAPI ratio provides rapid quantitative measurements and could be used as a low-cost, high-throughput method to quality-control MSC batches from different tissue sources.
Copyright © 2013 International Society for Cellular Therapy. Published by Elsevier Inc. All rights reserved.
Figures


References
-
- Barry F.P., Murphy J.M. Mesenchymal stem cells: clinical applications and biological characterization. Int J Biochem Cell Biol. 2004;36:568–584. - PubMed
-
- McGonagle D., Jones E. A potential role for synovial fluid mesenchymal stem cells in ligament regeneration. Rheumatology. 2008 - PubMed
-
- Pittenger MF., Mackay AM., Beck SC., Jaiswal RK., Douglas R., Mosca JD. Multilineage potential of adult human mesenchymal stem cells. Science. 1999;284:143–147. - PubMed
-
- Jones EA., Kinsey SE., English A., Jones RA., Straszynski L., Meredith DM. Isolation and characterization of bone marrow multipotential mesenchymal progenitor cells. Arthritis Rheum. 2002;46:3349–3360. - PubMed
Publication types
MeSH terms
Grants and funding
LinkOut - more resources
Full Text Sources
Other Literature Sources
Research Materials
