. 2012 Dec 21;151(7):1513-27.
doi: 10.1016/j.cell.2012.11.034.

Force fluctuations within focal adhesions mediate ECM-rigidity sensing to guide directed cell migration

Affiliations

Force fluctuations within focal adhesions mediate ECM-rigidity sensing to guide directed cell migration

Sergey V Plotnikov et al. Cell. .

Abstract

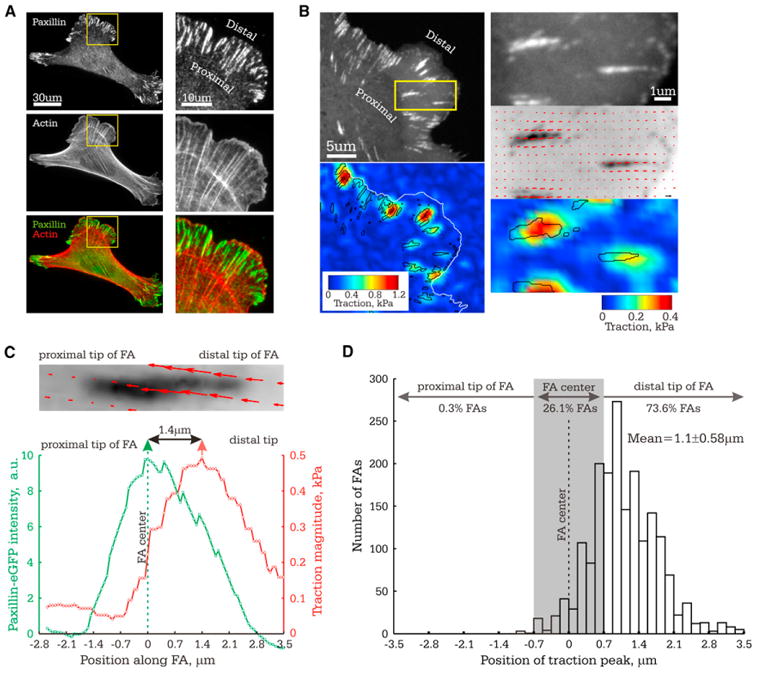
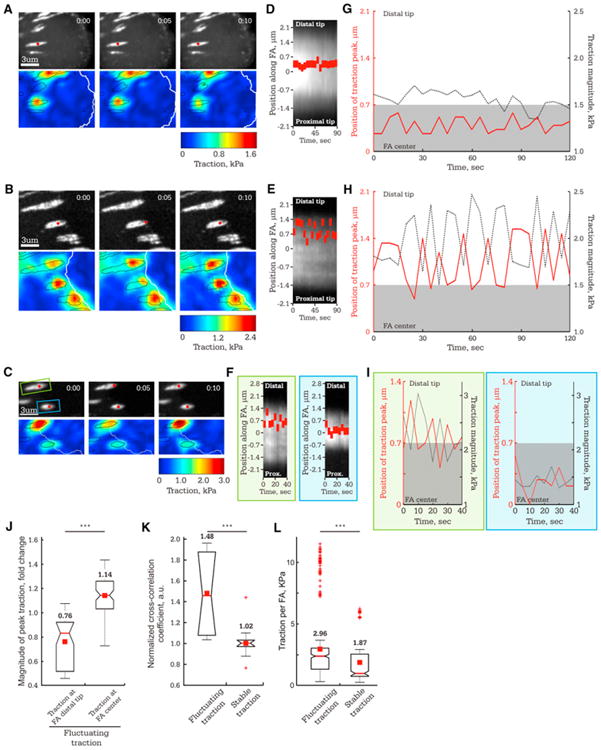
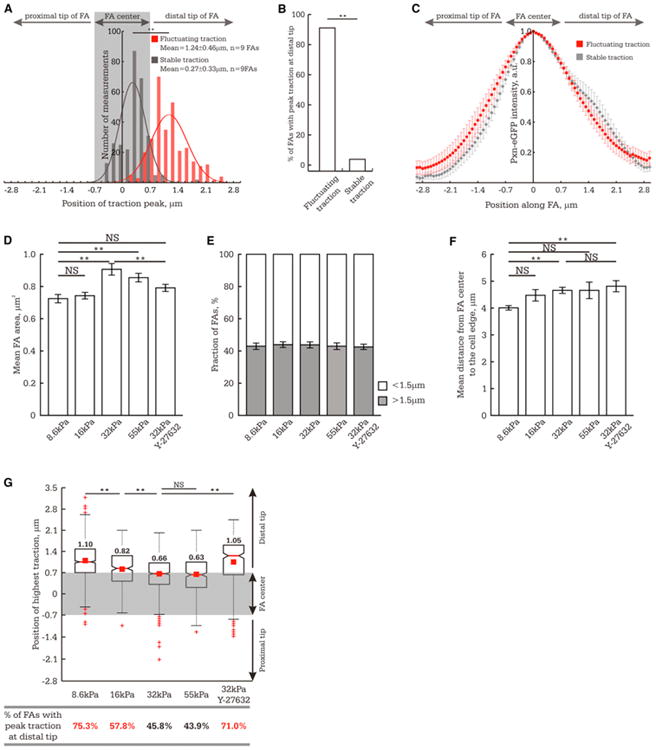
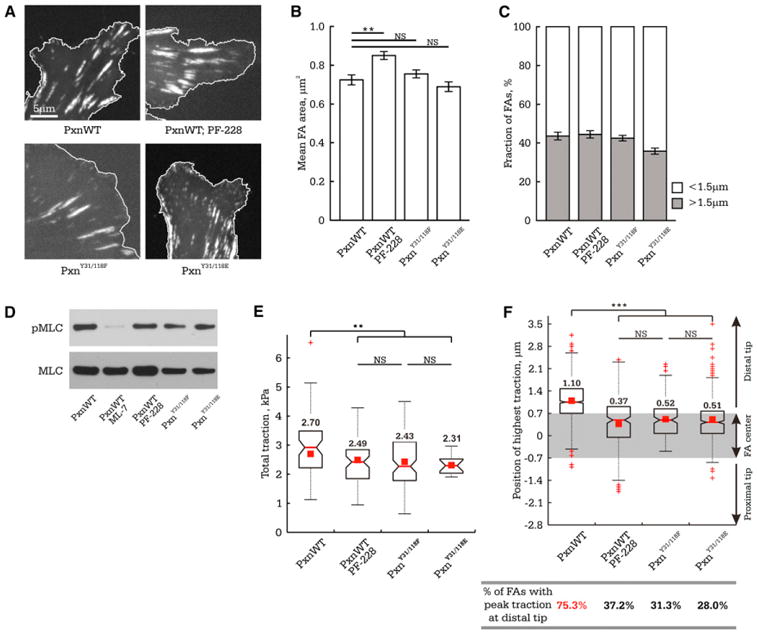
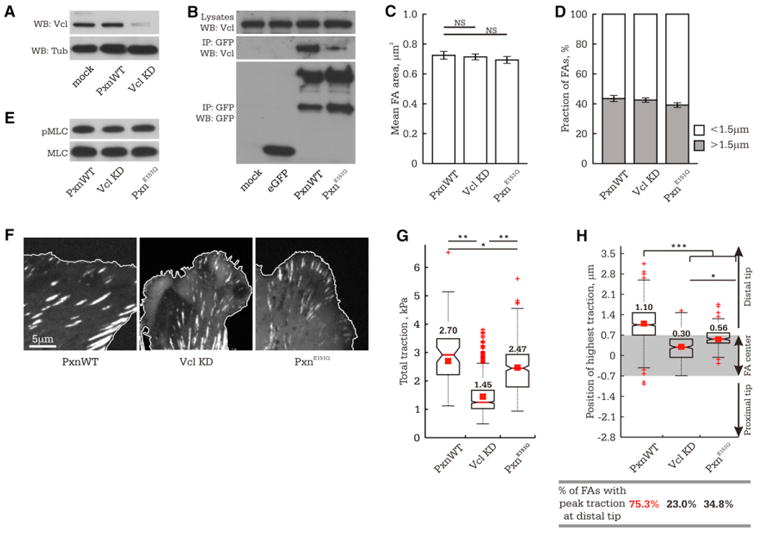
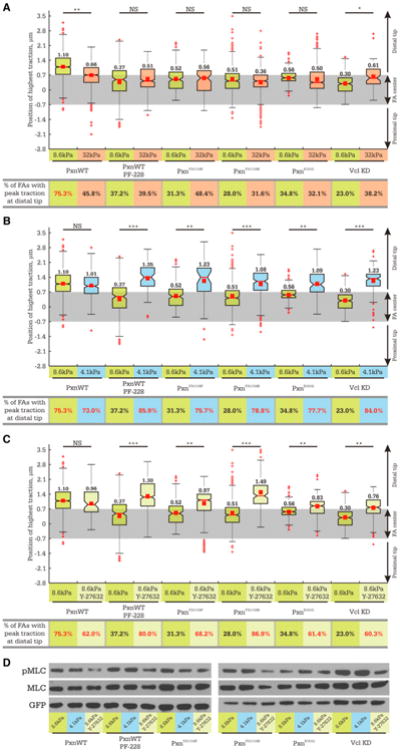
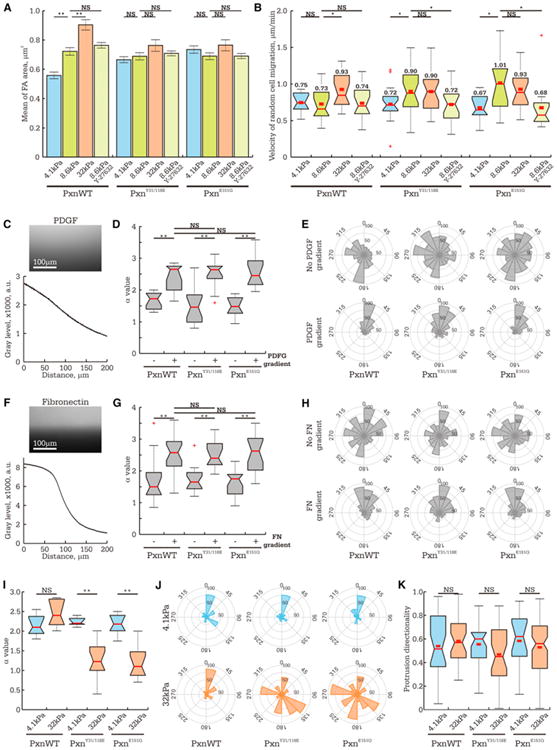
Cell migration toward areas of higher extracellular matrix (ECM) rigidity via a process called "durotaxis" is thought to contribute to development, immune response, and cancer metastasis. To understand how cells sample ECM rigidity to guide durotaxis, we characterized cell-generated forces on the nanoscale within single mature integrin-based focal adhesions (FAs). We found that individual FAs act autonomously, exhibiting either stable or dynamically fluctuating ("tugging") traction. We show that a FAK/phosphopaxillin/vinculin pathway is essential for high FA traction and to enable tugging FA traction over a broad range of ECM rigidities. We show that tugging FA traction is dispensable for FA maturation, chemotaxis, and haptotaxis but is critical to direct cell migration toward rigid ECM. We conclude that individual FAs dynamically sample rigidity by applying fluctuating pulling forces to the ECM to act as sensors to guide durotaxis, and that FAK/phosphopaxillin/vinculin signaling defines the rigidity range over which this dynamic sensing process operates.


Figures

Figure 1
Figure 1. Traction Stresses Are Asymmetrically Distributed across Individual FAs
Analysis of traction stress distribution in FAs in MEF (8.6 kPa ECM). (A) Immunolocalization of paxillin and fluorescent phalloidin staining of actin. Right panel: Zoom of boxed region on left. Proximal and distal directions are marked. (B) Images of eGFP-paxillin (top left, top right: zoomed image of the boxed region) and corresponding maps of reconstructed traction stresses on the ECM with positions of FA outlined in black (bottom left and bottom right: traction magnitude heatmaps; middle right: stress vector field overlaid on inverted contrast image of eGFP-paxillin). (C and D) The center of the FA (position of peak eGFP-paxillin intensity) was set as the origin of the x axis, proximal and distal directions indicated. (C) Above: Stress vector field overlaid on inverted contrast image of eGFP-paxillin. Below: eGFP-paxillin intensity and traction stress as a function of distance along the FA shown above. Single-headed arrows: peak values; double-headed arrows: distance between peak values. (D) Histogram of the position of peak traction within single FAs, with number of FAs with peak traction stress located in each region shown (n = 1,269). Grey rectangle highlights the values that are not significantly different from the FA center. See also Figure S1.
Figure 2
Figure 2. Time-Lapse TFM Reveals Two States of Traction in Individual FA: Stable and Fluctuating
Images of FAs in MEF (8.6 kPa ECM) were captured at 5 s intervals. (A–C) Images of eGFP-paxillin (top panels, time in min:s shown) and corresponding heatmaps of reconstructed traction stresses with FAs outlined in black (bottom panels). Red dot: position of peak traction for the FAs analyzed in (D)–(I). (A, D, and G) FA in which the position of peak traction remains stable near the FA center. (B, E, and H) FA in which the position of peak traction fluctuates in the distal half of the FA. (C, F, and I) Neighboring FAs in which position of peak traction is stable (blue box) or fluctuating (green box). (D–F) Kymographs along the FAs marked by red dots in (A), (B), and (C), respectively. Red rectangle: Position of peak traction along the FA (y axis) over time(x axis). (G–I) Plot of the position of peak traction stress along the FA (left axis, red, with the FA center set to zero) and the peak traction magnitude (right axis, black) over time for the FAs marked in (A), (B), and (C), respectively. Grey rectangle highlights values that are not significantly different from the FA center. For (J)–(L), TFM time series of individual FAs were classified according to whether the FA exhibited fluctuating or stable traction, with means shown above each plot. (J) Box plot of peak traction stress from the frames of TFM image series when the position of the traction peak was either in the distal tip of the FA (>0.7 μm from the FA center, n = 274 TFM frames) or at the FA center (<0.7 μm from the FA center, n = 28 TFM frames) for FAs that exhibited fluctuating traction (n = 9 FAs). Values are normalized to the mean of peak traction stress for the entire TFM series of each FA. (K) Box plots of cross-correlation coefficient between the magnitude and location of peak traction for FAs exhibiting fluctuating (n = 9 FAs) or stable traction (n = 9 FAs). (L) Box plot of mean integrated traction stress per FA for each TFM frame in time-lapse series of FAs that exhibited either fluctuating (n = 302 frames, 9 FAs) or stable (n = 285 frames, 9 FAs) traction. See also Figure S2 and Movies S1 and S2.
Figure 3
Figure 3. FA Traction Dynamics Are Modulated by ROCK-Dependent ECM-Rigidity Mechanosensing
In (A) and (G), the FA center (position of peak eGFP-paxillin intensity) was set as the origin; gray rectangle highlights the values that are not significantly different from the FA center, and distal and proximal directions are indicated. (A–C) TFM movies of FA in cells plated on 8.6 kPa ECM were classified according to whether the FA exhibited tugging or stable traction. (A) Histogram of the position of peak traction in each frame of time-lapse TFM series for FAs exhibiting tugging (red, n = 302 measurements, n = 9 FAs) or stable traction (gray, n = 285 measurements, n = 9 FAs). (B) One hundred and fifty snapshots were randomly selected from sets of TFM movies of FAs that exhibited either tugging (n = 9 FAs) or stable (n = 9 FAs) traction. This panel shows the percent of TFM snapshots of FAs in which the position of peak traction was located at the distal tip of the FA (>0.7 μm from the FA center). (C) Profile of eGFP-paxillin intensity across FAs exhibiting tugging or stable traction dynamics. n = 9 FAs for each type of traction behavior. (D–F) Effect of ECM stiffness and treatment with 1 μM Y-27632 on FA morphometry. (D) Mean FA size (n > 600 FAs from 7 cells). (E) Fraction of FAs ≥ 1.5 μm (n > 600 FAs from 7 cells). (F) FA subcellular localization quantified as the mean distance between the FA center and the cell edge (n > 200 FAs per experimental condition). (G) Analysis of peak traction position within single FAs (n > 200 FAs per experimental condition).Top: Box plot of peak traction position within FAs. Bottom: Fraction of TFM snapshots of FAs in which the position of peak traction was significantly skewed (>0.7 μm) toward the distal FA tip. Values greater than 50% are marked in red. **p < 0.01, NS p > 0.05 as detected by Mann-Whitney test. (D–F) Data shown as mean ± standard error of the mean (SEM). See also Figure S3.
Figure 4
Figure 4. Inhibiting FAK or Altering Paxillin Y31/118 Phosphorylation Reduces FA Force Transmission and Depletes Tugging FA Traction Dynamics
MEFs were cotransfected with nontargeting siRNAs and eGFP-tagged wild-type paxillin (PxnWT) or with paxillin-targeting siRNAs and eGFP-tagged siRNA-resistant paxillin mutants (phosphomimetic [PxnY31/118E] or nonphosphorylatable [PxnY31/118F]), or they were treated with 10 μM FAK inhibitor (PF-228). Cells were plated on 8.6 kPa ECMs. (A) Localization of eGFP-tagged paxillins in FAs (cell edge is outlined in white). (B) Mean FA size (n > 850 FAs from 7 cells). (C) Fraction of FAs ≥ 1.5 μm (n > 850 FAs from 7 cells). (D) Western blot of cell lysates for myosin II regulatory light chain (MLC) and serine 19 phosphorylated MLC (pMLC). MEFs treated with 20 μM ML-7 and 10 μM Y-27632 for 2 hr (PxnWT ML-7) were used as a control. (E) Box plot of total cellular traction normalized to total FA area upon inhibiting FAK (n = 6 cells) or altering paxillin phosphorylation (PxnY31/118E, n = 14 cells or PxnY31/118F, n = 12 cells). (F) Above: Box plot of peak traction position relative to the FA center within single FAs (PxnWT, n = 150 FAs; PF-228, n = 223 FAs; PxnY31/118E, n = 443 FAs; PxnY31/118F, n = 153 FAs). Grey rectangle highlights values that are not significantly different from the FA center, with distal and proximal directions indicated. Bottom: The fraction of TFM snapshots of FAs in which the position of peak traction was significantly skewed (>0.7 μm) toward the distal FA tip. Values greater than 50% are marked in red. **p < 0.01, ***p < 0.001, NS p > 0.05 as detected by Mann-Whitney test. (B and C) Data shown as mean ± SEM. See also Figure S4.
Figure 5
Figure 5. Depleting Vinculin or Inhibiting Paxillin-Vinculin Interaction Reduces FA Force Transmission and Depletes Tugging FA Traction Dynamics
MEFs were cotransfected with nontargeting or vinculin-targeting (VclKD) siRNAs and eGFP-tagged wild-type paxillin (PxnWT) or with paxillin-targeting siRNAs and eGFP-tagged siRNA-resistant paxillin mutant (PxnE151Q). (A) Western blot (WB) of siRNA-mediated depletion of vinculin (VclKD) in MEFs (72 hr after transfection), with tubulin (Tub) as loading control. (B) Anti-GFP immunoprecipitations (IP) of mock-, eGFP-, eGFP-paxillin, or eGFP-paxillinE151Q-transfected MEFs, followed by analysis by WB with antibodies to vinculin and GFP. The top band in the anti-GFP immunoblot is eGFP-paxillin, the lower band a commonly observed degradation product. In (C)–(H), cells were plated on 8.6 kPa ECMs. (C) Mean FA size (n > 850 FAs from 7 cells). (D) Fraction of FAs ≥ 1.5 μm (n > 850 FAs from 7 cells). (E) WB of cell lysates for MLC and pMLC. (F) eGFP-tagged paxillins in FAs (cell edge, white outline). (G) Box plot of total cellular traction normalized to total FA area (n = 6 cells per treatment). (H) Above: Box plot of peak traction position relative to the FA center within single FAs (PxnWT, n = 150 FAs; VclKD, n = 283 FAs; PxnE151Q, n = 204 FAs). Grey rectangle highlights values that are not significantly different from the FA center, with distal and proximal directions indicated. Bottom: The fraction of TFM snapshots of FAs in which the position of peak traction was significantly skewed (>0.7 μm) toward the distal FA tip. Values greater than 50% are marked in red. *p < 0.05, **p < 0.01, ***p < 0.001, NS p > 0.05 as detected by Mann-Whitney test. (C and D) Data shown as mean ± SEM. See also Figure S4.
Figure 6
Figure 6. A FAK/Paxillin/Vinculin Signaling Module Regulates the Range of the ECM Rigidities over which FAs Exhibit Traction Dynamics
MEFs were plated on 4.1 (blue), 8.6 (green), or 32 kPa (orange) ECMs. Cells were cotransfected with nontargeting siRNAs and eGFP-tagged wild-type paxillin (PxnWT) or with paxillin-targeting siRNAs and eGFP-tagged siRNA-resistant paxillin mutants (phosphomimetic [PxnY31/118E], non-phosphorylatable [PxnY31/118F], or vinculin-binding deficient [PxnE151Q]), or they were treated with vinculin-targeting siRNAs and eGFP-paxillin (VclKD). Cells were additionally treated with 10 μM PF-228 to inhibit FAK (PF-228) or 1 μM Y-27632 to inhibit ROCK (light green bars in C and D). (A–C) Top panels: Box plots of the position of peak traction within FAs in cells plated on ECMs of various stiffness. Grey rectangle highlights the values that are not significantly different from the FA center, with distal and proximal directions indicated. Bottom panels: The fraction of TFM snapshots of FAs in which the position of peak traction was significantly skewed (>0.7 μm) toward the distal FA tip measured at the same experimental condition as in the panels directly above. n>200 FA for each experimental condition. Values greater than 50% are marked in red. *p < 0.05, **p < 0.01, ***p < 0.001, NS p > 0.05 as detected by Mann-Whitney test. (D) Phosphorylation of MLC assayed by WB analysis (top panel). Loading controls: total MLC and GFP (middle and bottom panels, respectively). See also Figure S5.
Figure 7
Figure 7. Tugging FA Traction Dynamics Slow Random Cell Migration, Are Dispensable for FA Maturation, Chemotaxis, and Haptotaxis, but Are Critical to Durotaxis
MEFs were treated with nontargeting siRNAs and expressed eGFP-tagged wild-type paxillin (PxnWT), or endogenous paxillin was suppressed by siRNAs, and eGFP-tagged siRNA-resistant paxillin mutants were expressed (phosphomimetic [PxnY31/118E] or vinculin binding-deficient [PxnE151Q]) and imaged by phase-contrast microscopy. (A and B) Cells were plated on 4.1 (blue), 8.6 (green), or 32 kPa (orange) ECMs or treated with 1 μM Y-27632 to inhibit ROCK (light green bars). (A) Mean FA size (>600 FA per condition). Data shown as mean ± SEM (B) Box plots of instantaneous cell migration velocities (n > 7 cells for each condition). (C–J) Analysis of cell migration in response to biochemical gradient as assayed with microfluidic chambers (C–H) or stiffness gradient (I and J). (C and F) Fluorescent images (top panel) of dextran-Cy5 (C, molecular weight [MW] = 10 kDa) or substrate-bound rhodamine-FN (F), with line scans of intensity across the microfluidic chamber (bottom panels). (D,G, and I) Box plots of directional persistence, α, quantified by fitting a plot of MSD overtime (Figures S7A-S7C) data with a power law model (MSD(τ) = 4D*τα, Suraneni et al., 2012). (E, H, and J) Rose diagrams of cell migration (22.5° bins) showing the angle of each turn in the migration track relative to the gradient, with the radius indicating number of measurements. (D, E, G, and H) Comparison of even distribution (−) or concentration gradient (+) of soluble PDGF and substrate-bound FN. (I and J) Comparison of migration on strained ECMs of different stiffness. (K) Box plots of asymmetry in membrane protrusion relative to direction of ECM stiffness gradient. The data represent the fraction of cell protrusion area (10 min interval), which extends toward stiffer ECMs (n > 10 cells per condition). See also Figures S6 and S7 and Movies S3 and S4.

References

    1. Arrieumerlou C, Meyer T. A local coupling model and compass parameter for eukaryotic chemotaxis. Dev Cell. 2005;8:215–227. - PubMed
    1. Brown MC, Perrotta JA, Turner CE. Identification of LIM3 as the principal determinant of paxillin focal adhesion localization and characterization of a novel motif on paxillin directing vinculin and focal adhesion kinase binding. J Cell Biol. 1996;135:1109–1123. - PMC - PubMed
    1. Chan CE, Odde DJ. Traction dynamics of filopodia on compliant substrates. Science. 2008;322:1687–1691. - PubMed
    1. de Rooij J, Kerstens A, Danuser G, Schwartz MA, Waterman-Storer CM. Integrin-dependent actomyosin contraction regulates epithelial cell scattering. J Cell Biol. 2005;171:153–164. - PMC - PubMed
    1. Dumbauld DW, Michael KE, Hanks SK, García AJ. Focal adhesion kinase-dependent regulation of adhesive forces involves vinculin recruitment to focal adhesions. Biol Cell. 2010a;102:203–213. - PMC - PubMed

Publication types

Substances