. 2012 Dec 21;151(7):1617-32.
doi: 10.1016/j.cell.2012.11.039.

A molecular roadmap of reprogramming somatic cells into iPS cells

Affiliations

A molecular roadmap of reprogramming somatic cells into iPS cells

Jose M Polo et al. Cell. .

Abstract

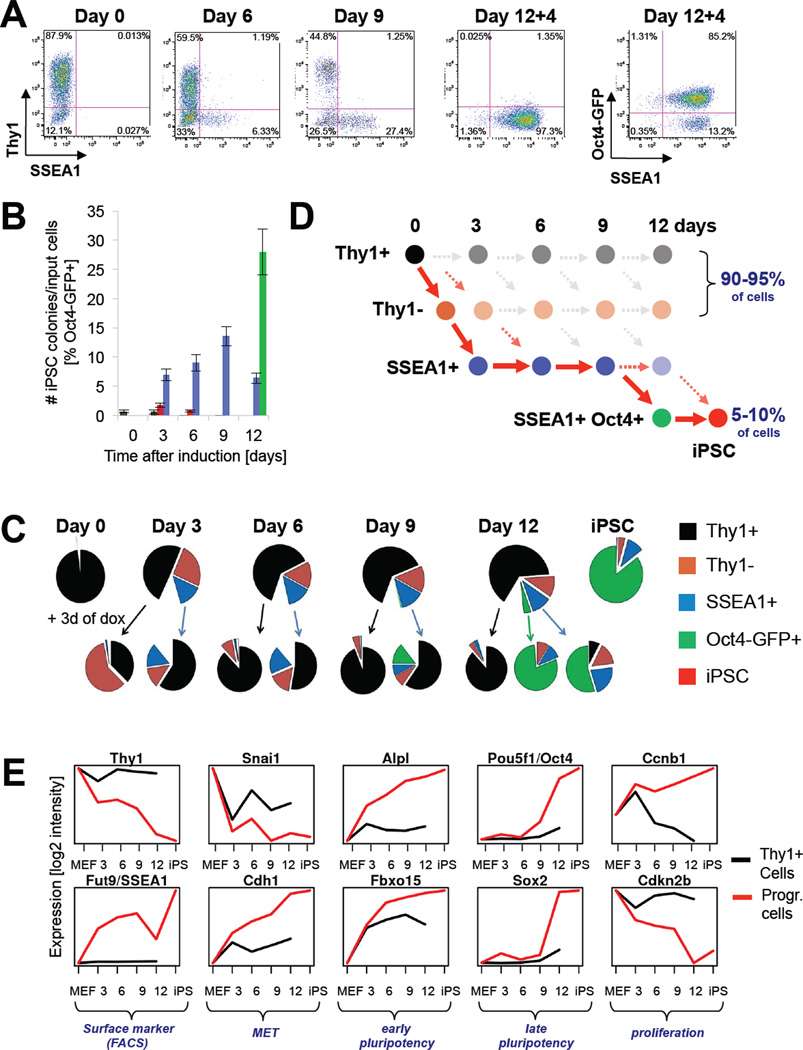
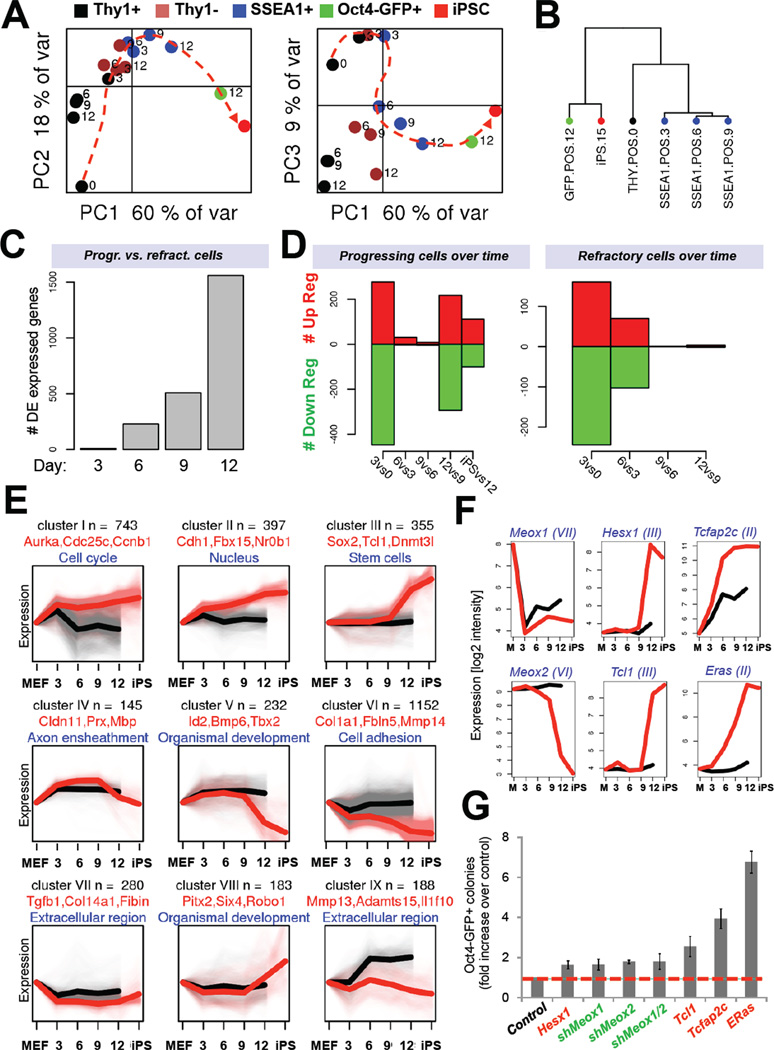
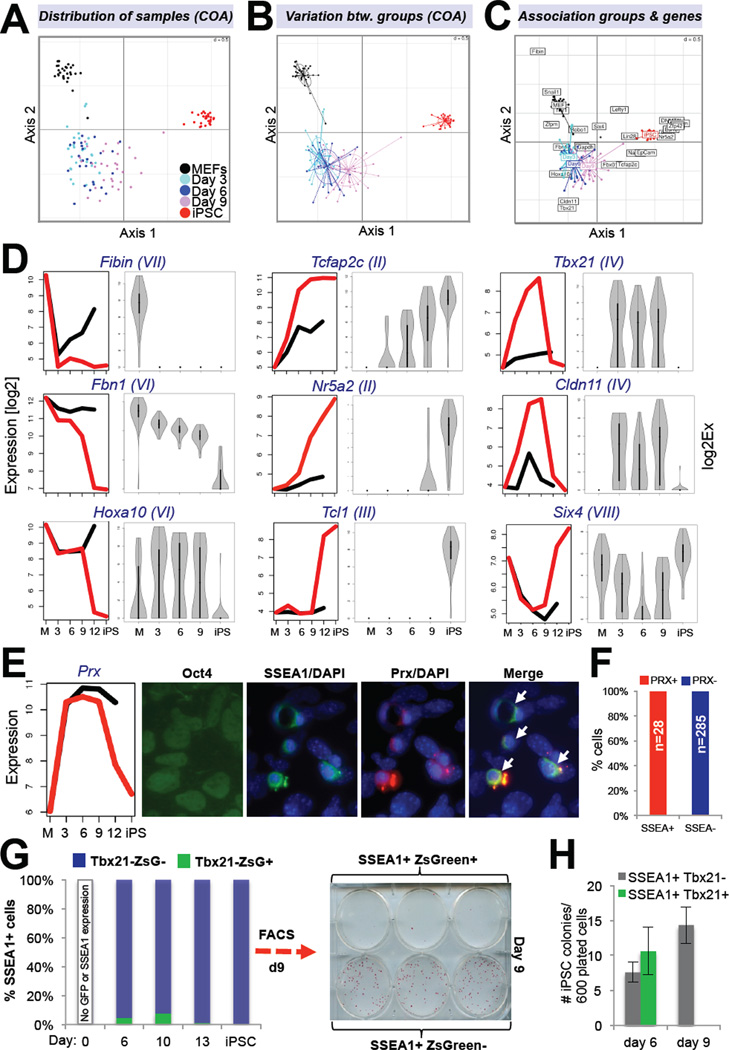
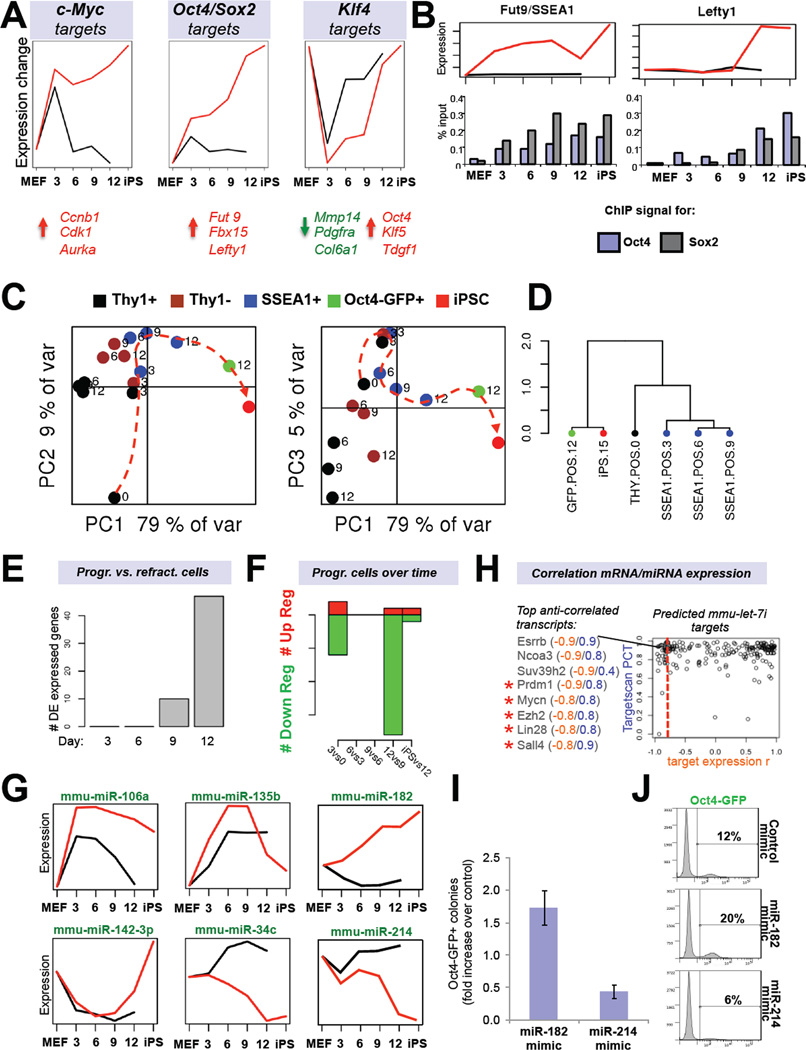
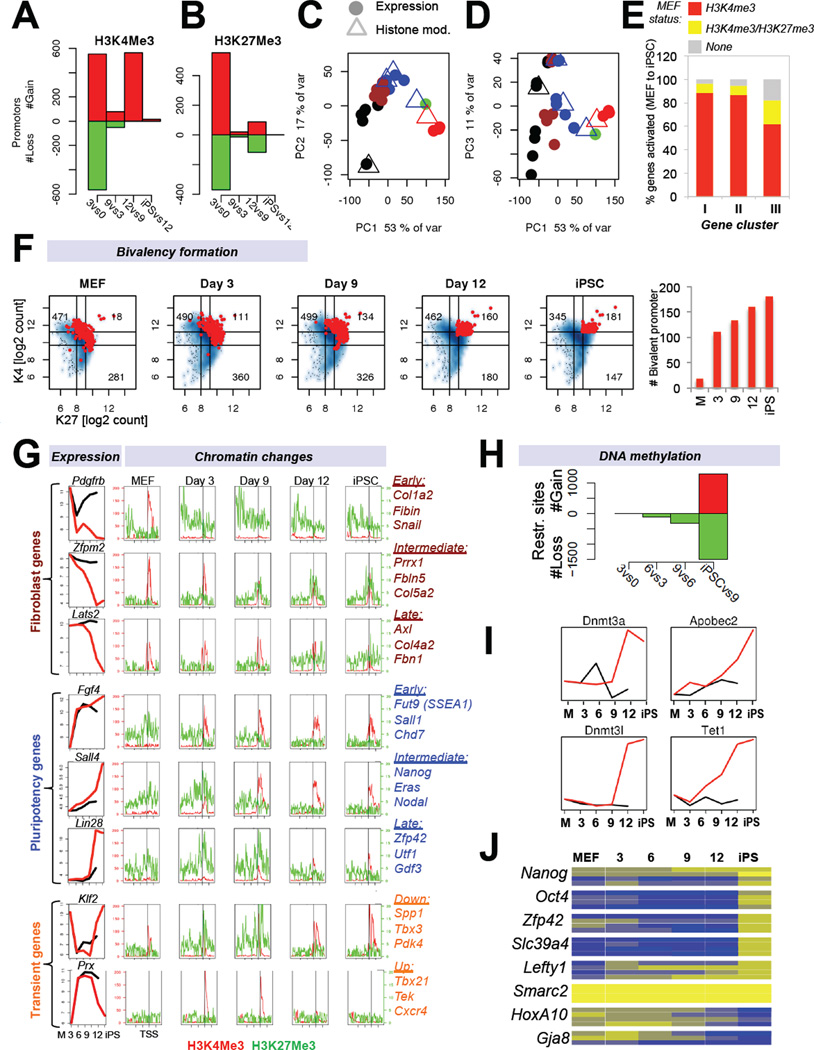
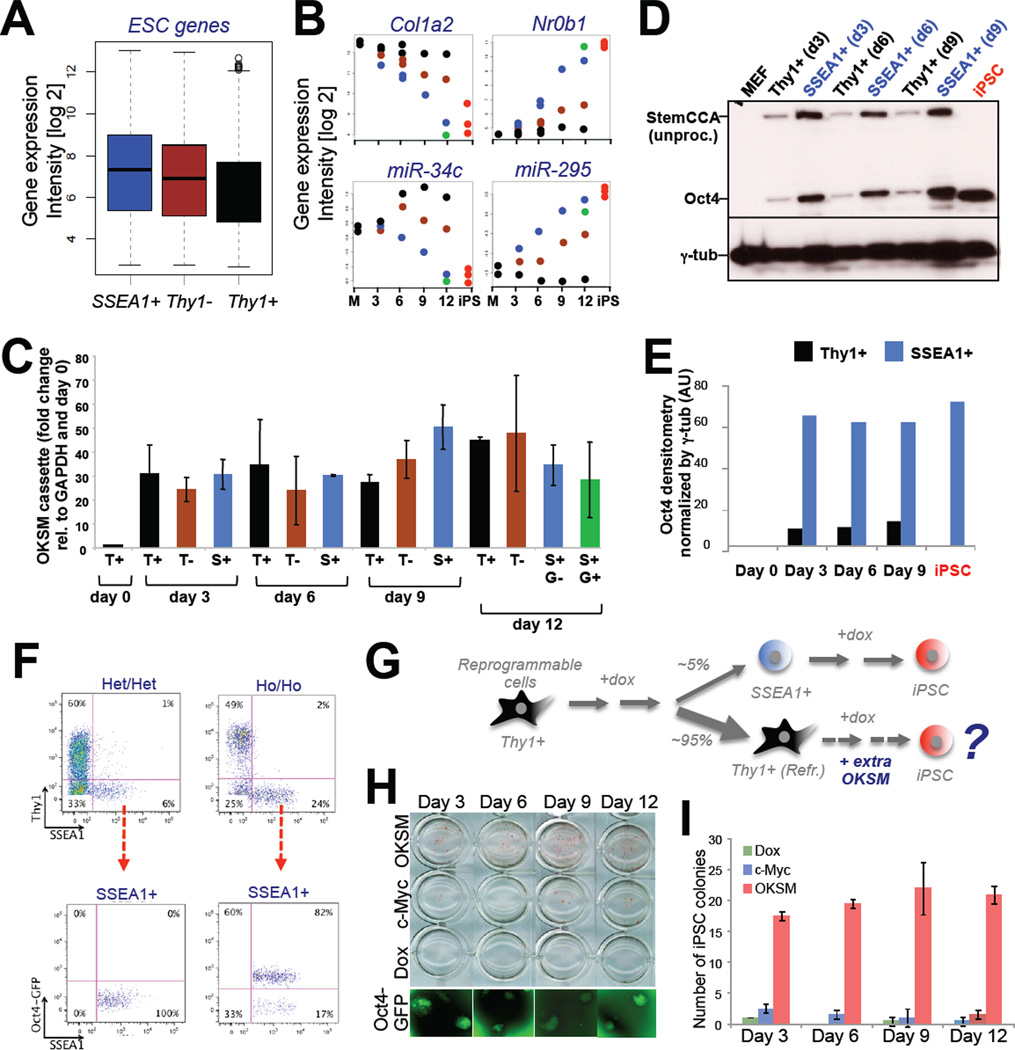
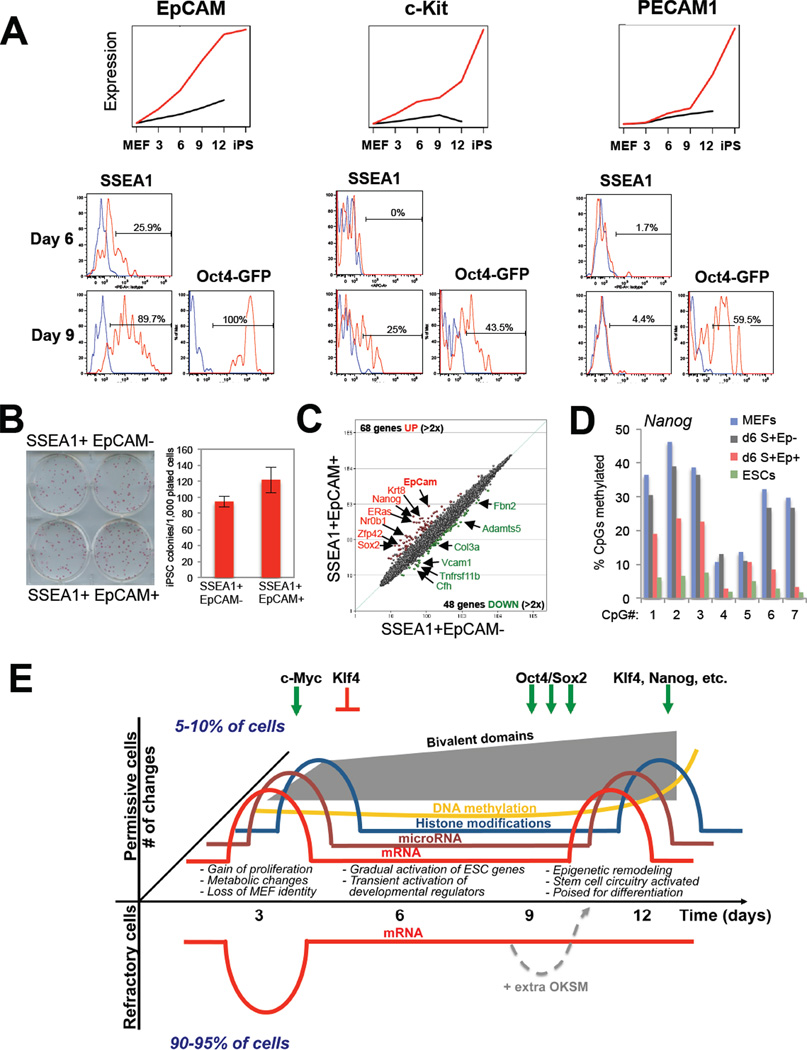
Factor-induced reprogramming of somatic cells into induced pluripotent stem cells (iPSCs) is inefficient, complicating mechanistic studies. Here, we examined defined intermediate cell populations poised to becoming iPSCs by genome-wide analyses. We show that induced pluripotency elicits two transcriptional waves, which are driven by c-Myc/Klf4 (first wave) and Oct4/Sox2/Klf4 (second wave). Cells that become refractory to reprogramming activate the first but fail to initiate the second transcriptional wave and can be rescued by elevated expression of all four factors. The establishment of bivalent domains occurs gradually after the first wave, whereas changes in DNA methylation take place after the second wave when cells acquire stable pluripotency. This integrative analysis allowed us to identify genes that act as roadblocks during reprogramming and surface markers that further enrich for cells prone to forming iPSCs. Collectively, our data offer new mechanistic insights into the nature and sequence of molecular events inherent to cellular reprogramming.


Figures

Figure 1
Figure 1. Strategy for isolating reprogramming intermediates
(A) FACS analysis of reprogrammable MEFs at indicated time points. 12+4 denotes transgene-independent growth for 4 days. (B) Comparison of reprogramming efficiencies of intermediates purified at indicated time points. Note that established iPSCs have a colony formation efficiency of ~30% (Stadtfeld et al., 2008). Data are represented as mean +/− S.E.M. (n=3). (C) Pie charts summarizing FACS analysis of reprogrammable cells at indicated time points (top row). Bottom row shows FACS analysis for Thy1, SSEA1 and Oct4-GFP 3 days after sorting and plating of the above cell populations in the presence of doxycycline. (D) Scheme illustrating the different subpopulations throughout reprogramming. Solid red arrows connect cell populations progressing towards iPSCs as inferred from data in (B). (E) Expression analyses of indicated genes at day 0, 3, 6, 9, 12 of reprogramming and in established iPSCs (black lines depict Thy1+ populations; red lines depict cells undergoing successful reprogramming as defined by red arrows in Figure 1D).
Figure 2
Figure 2. Gene expression dynamics during iPSC formation (see also Figure S1)
(A) Principal component analyses (PCA) of global gene expression data of FACS-sorted subpopulations at indicated time points. (B) Unsupervised hierarchical clustering of gene expression profiles of indicated cell populations. (C) Number of differentially expressed genes between Thy1+ and SSEA1+ cells at indicated time points. (D) Number of differentially expressed (DE) genes in progressing SSEA1+ cells at successive time points. Right panel shows gene expression changes in refractory Thy1+ cells. (E) Gene expression categories (I to IX) clustered by common expression changes during reprogramming (black trendlines depict gene expression patterns in Thy1+ population; red trendlines depict gene expression patterns in cells undergoing successful reprogramming as defined in Figure 1D). Each gene is only represented once per category. (F) Expression analysis of candidate genes selected from (E) for overexpression or knock-down experiments shown in (G). (G) Reprogramming potential of OKSM transgenic MEFs infected with dox-inducible lentiviral vectors expressing the indicated candidate genes or hairpins. Data are represented as mean +/− S.E.M. (n=3).
Figure 3
Figure 3. Characterization of cellular heterogeneity within SSEA1+ cells (see also Figure S2)
(A) Correspondence analysis (COA) of single cell expression data obtained with Fluidigm technology for 26 genes in indicated cell populations. (B) COA of same groups as shown in (A) illustrates variation in gene expression. Size of ovals indicates degree of variation. (C) Biplot displaying overlay of COA with genes associated with individual groups. (D) Comparison of Affymetrix (left) and single cell (right) expression data for 12 selected genes. Gene expression categories, as defined in Figure 2E, of selected candidates are shown in brackets. (E) Immunofluorescence for Oct4, SSEA1 and Prx on reprogrammable MEFs treated with dox for nine days. (F) Quantification of data shown in (E). (G) FACS analysis of Tbx21-ZsGreen tail fibroblasts infected with dox-inducible lentivirus expressing OKSM at indicated time points. (H) Reprogramming potentials of indicated cell populations at days 6 and 9. Data are represented as mean +/− S.E.M. (n=3).
Figure 4
Figure 4. Predicted reprogramming factor activities and microRNA expression dynamics (see also Figure S3)
(A) Transcription factor (TF) activities for c-Myc, Klf4 and the Sox2-Oct4 dimer based on network component analysis. Shown below are examples of activated (red) or repressed (green) targets. (B) Expression dynamics of an early (Fut9; left panel) and late (Lefty1; right panel) Oct4/Sox2 target during reprogramming. Shown below is promoter ChIP analysis for Oct4 and Sox2. (C) Principle component analysis of microRNA expression data of FACS-sorted subpopulations at the indicated time points. (D) Unsupervised hierarchical clustering of indicated microRNA expression profiles. (E) Number of differentially expressed (DE) microRNAs between Thy1+ and SSEA1+ cells at indicated time points. (F) Number of differentially expressed microRNAs between progressing SSEA1+ cell populations at successive time points. (G) Examples of microRNA profiles that change in dynamic patterns. (H) Predicted target genes of let-7c (Targetscan database) are shown based on inverse expression patterns with let-7c. Examples of putative targets with an inverse expression score of −0.8 or higher are shown. Targets marked by red asterisks have previously been validated. (I) iPSC formation efficiencies and (J) Oct4-GFP FACS quantification of reprogrammable MEFs treated with mimics for miR-182 or miR-214. Data are represented as mean +/− S.E.M. (n=3).
Figure 5
Figure 5. Histone and DNA methylation dynamics during cellular reprogramming (see also Figure S4)
(A, B) Enrichment for H3K4me3 or H3K27me3 at promoters of differentially expressed genes in progressing intermediates. (C, D) Superimposition of principal component analyses for genes enriched in H3K4me3 (C) or H3K27me3 (D)(triangles) with gene expression data (circles) of the same cell populations (see Figure 2A for color coding). (E) Display of activated genes from gene expression categories I, II and III (see Figure 2E) in relation to their chromatin status in MEFs. (F) Number of differentially expressed genes that become bivalent (H3K27me3 and H3K4me3 enriched) during reprogramming (red dots = bivalent promoters) and quantification. (G) Integration of gene expression and histone modifications data defines subsets of genes with characteristic expression changes. Shown are examples of fibroblast-associated (top), pluripotency-associated (center) and transiently changing genes (bottom). (H) Number of genes, which change DNA methylation status in progressing cell populations during reprogramming as determined by genome-wide methylation analysis. (I) Expression dynamics of candidate genes associated with DNA methylation and demethylation. (J) Heatmap of DNA methylation analysis of specific CpGs (boxes) in the promoter regions of indicated genes during reprogramming using EpiTYPER DNA methylation analyses. Yellow indicates 0% methylation and blue represents 100% methylation.
Figure 6
Figure 6. Rescue of refractory Thy1+ cells by increased OKSM expression
(A) Box plot depicting average expression levels in Thy1+ cells, Thy1 cells and SSEA1+ cells of genes that are significantly upregulated between MEFs and iPSCs. (B) Expression dynamics of indicated MEF-associated and ESC-associated transcripts in Thy1+, Thy1 and SSEA1+ cells (see Figure 2A for color coding). (C) Exogenous Oct4 expression levels, normalized to GAPDH for the indicated cell populations and time points. (D) Western blot analysis for Oct4 and gamma-tubulin (γ-tub) for the indicated cell populations and time points. Higher molecular weight band for exogenous Oct4 compared with endogenous Oct4 (iPSC) reflects unprocessed protein originating from the polycistronic construct as described previously by Carey, Jaenisch and colleagues (Cell Stem Cell, 2011). (E) Densitometric quantification of Western blot analysis shown in (D). AU, arbitrary units. (F) FACS analysis of reprogrammable fibroblasts carrying one (Het/Het) or two (Ho/Ho) copies each of the OKSM cassette and Rosa26-M2rtTA allele (top row). Bottom row shows FACS analysis for SSEA1 and Oct4-GFP of the same samples. (G) Experimental outline to rescue refractory Thy1+ cells by supplying viral copies of OKSM. (H) Alkaline phosphatase stained colonies obtained after infecting Thy1+ reprogrammable cells at indicated days with a dox-inducible vector expressing OKSM. Controls were uninfected, dox-treated Thy1+ cells (“Dox”) and Thy1+ cells infected with c-Myc virus alone. Representative Oct4-GFP+ colonies are shown at the bottom. (I) Quantification of results in (G). Data are represented as mean +/− S.E.M. (n=3).
Figure 7
Figure 7. Identification of surface markers to enrich for reprogramming intermediates, and model (see also Figure S5)
(A) Expression data and histogram plots of FACS analysis for c-Kit, EpCAM and PECAM1 in SSEA1+ and Oct-GFP+ populations at the indicated days of reprogramming. Red lines depict antibody-specific signal, blue lines show signal obtained with isotype control. No expression was seen before day 6. (B) Potential of EpCAM subpopulations at day 6 to form iPSC colonies. (C) Affymetrix expression analysis of EpCAM subpopulations. (D) Methylation analysis of Nanog promoter by bisulfite sequencing of ESCs, MEFs and intermediates shown in (B). S, SSEA1; Ep, EpCAM. (E) Model summarizing the presented data. Permissive cell populations (positive y-axis) show biphasic pattern of mRNA/miRNA expression and individual histone marks. Bivalent domains are generated gradually after an initial burst. DNA methylation changes occur predominantly at the end of reprogramming. Forced expression of OKSM in refractory cells (negative y-axis)can rescue their ability to form iPSCs. c-Myc/Klf4 mostly drive the first phase while Oct4/Sox2/Klf4 drive the second phase.

References

    1. Bernstein BE, Mikkelsen TS, Xie X, Kamal M, Huebert DJ, Cuff J, Fry B, Meissner A, Wernig M, Plath K, et al. A bivalent chromatin structure marks key developmental genes in embryonic stem cells. Cell. 2006;125:315–326. - PubMed
    1. Brambrink T, Foreman R, Welstead GG, Lengner CJ, Wernig M, Suh H, Jaenisch R. Sequential Expression of Pluripotency Markers during Direct Reprogramming of Mouse Somatic Cells. Cell stem cell. 2008;2:151–159. - PMC - PubMed
    1. Buckley SM, Aranda-Orgilles B, Strikoudis A, Apostolou E, Loizou E, Moran-Crusio K, Farnsworth CL, Koller AA, Dasgupta R, Silva JC, et al. Regulation of Pluripotency and Cellular Reprogramming by the Ubiquitin-Proteasome System. Cell stem cell. 2012 - PMC - PubMed
    1. Buganim Y, Faddah DA, Cheng AW, Itskovich E, Markoulaki S, Ganz K, Klemm SL, van Oudenaarden A, Jaenisch R. Single-Cell Expression Analyses during Cellular Reprogramming Reveal an Early Stochastic and a Late Hierarchic Phase. Cell. 2012;150:1209–1222. - PMC - PubMed
    1. Chang C, Ding Z, Hung YS, Fung PC. Fast network component analysis (FastNCA) for gene regulatory network reconstruction from microarray data. Bioinformatics. 2008;24:1349–1358. - PubMed

Publication types