. 2013 Feb 7;12(2):180-92.
doi: 10.1016/j.stem.2012.11.003. Epub 2012 Dec 20.

H2A.Z facilitates access of active and repressive complexes to chromatin in embryonic stem cell self-renewal and differentiation

Affiliations

H2A.Z facilitates access of active and repressive complexes to chromatin in embryonic stem cell self-renewal and differentiation

Gangqing Hu et al. Cell Stem Cell. .

Abstract

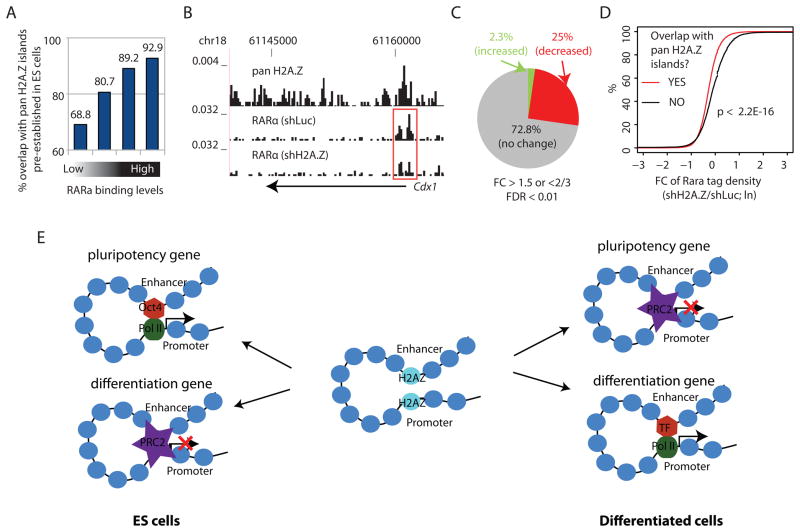
Chromatin modifications have been implicated in the self-renewal and differentiation of embryonic stem cells (ESCs). However, the function of histone variant H2A.Z in ESCs remains unclear. We show that H2A.Z is highly enriched at promoters and enhancers and is required for both efficient self-renewal and differentiation of murine ESCs. H2A.Z deposition leads to an abnormal nucleosome structure, decreased nucleosome occupancy, and increased chromatin accessibility. In self-renewing ESCs, knockdown of H2A.Z compromises OCT4 binding to its target genes and leads to decreased binding of MLL complexes to active genes and of PRC2 complex to repressed genes. During differentiation of ESCs, inhibition of H2A.Z also compromises RA-induced RARα binding, activation of differentiation markers, and the repression of pluripotency genes. We propose that H2A.Z mediates such contrasting activities by acting as a general facilitator that generates access for a variety of complexes, both activating and repressive.


Figures

Figure 1
Figure 1. H2A.Z marks open chromatin and is co-localized with H3K4me3 at promoters and enhancers (see also Figure S1)
A. Left panel: relationship of normalized, averaged tag density of pan H2A.Z across TSSs to expression levels. All non-locally redundant genes were sorted into 5 equal size groups according to their mRNA expression values (RPKM). Right Panel: a similar plot for acH2A.Z across TSSs. B. Left panel: normalized tag density of pan H2A.Z across intergenic p300 binding sites, sorted into 5 equal-size groups by their H3K27ac level. Right Panel: a similar plot for acH2A.Z across intergenic p300 binding sites. C. Heatmaps of pan H2A.Z, acH2A.Z and histone modifications H3K4me3 and H3K27me3 in promoter regions (left panel) and enhancer regions (right panel), ±3 Kb around TSS and intergenic p300 binding sites, respectively (see Supplemental Experimental Procedures for details). The rightmost bars indicate the percentage of promoters and enhancers that showed enrichment of pan H2A.Z for each bin. D. Venn diagrams for promoters (left panel) and enhancers (right panel) occupied by pan H2A.Z and either H3K4me3 (green) or H3K27me3 (red). E. Enhancers associated with both H2A.Z and H3K4me3 are more likely to be active. Boxplots of (i) H3K27ac ChIP-seq tag densities, (ii) RNA Pol II ChIP-seq tag densities, and (iii) BNase-Seq tag densities, which measure chromatin accessibility around intergenic p300 binding sites that are bound by H2A.Z (+/− 2.5K bps; H2A.Z bound enhancers). The binding sites are separated into two groups based on presence (w/) or absence (w/o) of H3K4me3 islands. The top and bottom of the box represent 25th and 75th percentile, respectively. The upper whisker represents the smaller of the maximum and upper quartile + 1.5 IQR (interquartile range), while the lower whisker represents the larger of the minimun and lower quartile − 1.5 IQR. P-values were calculated by the t-test. (iv) % of H2A.Z-bound enhancers (Y-axis) whose target genes exhibit lower expression than the value specified by the X-axis. The potential target of an H2A.Z-bound enhancer is defined by its nearest gene within 100Kbp. A line shifted to the left side indicates a globally lower level of expression. The P-value was calculated by the Kolmogorov-Smirnov Test.
Figure 2
Figure 2. Inter-regulation of H2A.Z and H3K4me3 and H3K27me3 at enhancers (see also Figure S2, Table S1)
A. MA analysis (see Supplemental Experimental Procedures for details) for H3K4me3 (left panel) and H3K27me3 (right panel) in enhancer regions. The analysis was made from H2A.Z knockdown cells and shLuc control.. B. MA analysis for RbBP5 (left panel) and Suz12 (right panel) in enhancer regions, as in Panel A. C. Left panel: RbBP5 islands from enhancer regions were sorted into quartiles by the levels of H3K4me3. Shown for each group is a boxplot (see Figure 1E legend for explanation) for the fold change of RbBP5 tag density (shH2A.Z/shLuc). Right panel: as left panel, except that the calculation was made for SUZ12 and H3K27me3. P values were calculated by the t-test. D. MA analysis for H3K4me3 (left panel) and H2A.Z (right panel) in enhancer regions. The analysis was made from MLL4 knockdown cells and shLuc control. E. Left panel: H2A.Z islands from enhancer regions were sorted into quartiles by the levels of RbBP5 binding. Shown for each group is a boxplot (see Figure 1E legend for explanation) for the fold change of RbBP5 tag density (shMLL4/shLuc). Right panel: as left panel, except that the calculation was made for H2A.Z and H3K4me3. P values were calculated by the t-test. F. Empirical cumulative distribution for the fold change of H2A.Z ChIP-Seq tag density (shMLL4/shLuc) for enhancers that show H3K4me3 decrease by more than 1.5 fold upon MLL4 knockdown (red line). Y-axis shows the % of enhancers that exhibit a lower FC of H2A.Z level than the value specified by the X-axis. Enhancers that show H3K4me3 increase by more than 1.5 fold are chosen as control (green line). A line shifted to the left means a systematically more decrease in the H2A.Z levels. P-value was calculated by Kolmogorov-Smirnov Test.
Figure 3
Figure 3. H2A.Z regulates nucleosome organization and chromatin accessibility at enhancers (see also Figure S3)
A. The nucleosome level at p300-bound enhancers is significantly increased after knockdown of H2A.Z. B. Percentage of short fragments (<120 bps) as a function of position relative to the p300 binding site. C. Normalized BNase-Seq tag density (blue) and nucleosome tag density (black) in regions ±1 Kbp around TSS. Inferred nucleosome positions are numbered as indicated. The regions immediately upstream of the TSS and the linker region between nucleosomes +1 and +2 that are preferentially digested by Benzonase are highlighted in gray. D. Normalized BNase-Seq tag densities across TSSs (upper panel) and across intergenic p300 binding sites (lower panel). The TSSs and p300 binding sites were sorted into five equal-sized groups based on gene expression level and H3K27ac level, respectively. E. UCSC Genome Browser images for the BNase-Seq tag distribution in H2A.Z knockdown and control cells. Potential enhancer regions associated with Klf4 (left) and Tbx3 (right) are chosen as examples. p300 genomic regions that show significantly decreased levels of chromatin accessibility following knockdown of H2A.Z are highlighted with red rectangles. F. The percentages of hypersensitive sites that show a significant increase in accessibility (green), decrease in accessibility (red), or no change in accessibility (gray) following knockdown of H2A.Z.
Figure 4
Figure 4. H2A.Z is required for ES cell self-renewal (see also Figure S4)
A. H2A.Z RNAi ES cell colonies are scored by morphology: compact and round (ES-like), flattened and intermediate. Scale bar, 100μm. B. GFP+ ES cells were sorted into a 96-well plate having a MEF feeder layer. One week later, colonies were scored by morphology. The experiments were carried out for H2A.Z knockdown ES cells and control ES cells side-by-side and were repeated four times. The percentages of colonies that maintain ES-like morphology (compact and round) are represented as mean +/− SEM. The P-value was calculated by the t-test. C. H2A.Z knockdown (shH2A.Z) and shLuc control ES cells stained for alkaline phosphatase activity. D. FACS analysis showing the distribution of expression of SSEA-1 (a pluripotency marker for murine ESCs) and SSEA-4 (a differentiation marker for murine ESCs) relative to OCT4 (a pluripotency TF) for ES cells with H2A.Z knockdown (shH2A.Z) and shLuc control cells. The analysis was done after two days of culture following re-plating from individual ES colonies. E. RT-PCR results (averages of three replicates) for mRNAs of four pluripotency genes and two early differentiation markers in the H2A.Z knockdown (shH2A.Z) and shLuc control ES cells. Data are represented as mean +/− standard deviation. F. Venn diagrams for genes responsive to H2A.Z knockdown in ES cells (up-regulated or down-regulated by more than 1.5 fold and FDR < 0.001; left circles) and genes that are up-or down-regulated during EB formation from ESCs to EB day 3 (EB-associated genes; right circles).
Figure 5
Figure 5. H2A.Z is required for efficient bindings of OCT4
A. Average profile of H2A.Z tag density around OCT4 binding sites in mouse ESCs. B. UCSC Genome Browser image of tag distribution of OCT4, RbBP5 and H3K4me3 in the putative enhancer regions downstream of the Klf4 gene in control and H2A.Z knockdown ESCs. The genomic region that shows significant decreases in the levels of Oct4, RbBP5 and H3K4me3 is highlighted by the rectangle. C. Average profile of OCT4 tag density around intergenic p300 binding sites in the H2A.Z knockdown (shH2A.Z) and control (shLuc) ES cells. D. The percentages of OCT4 binding sites that showed a significant increase (green), decrease (red), or no change (gray) after knockdown of H2A.Z. E. Left: intergenic OCT4 binding sites that co-localize with RbBP5 are separated into two groups based on whether or not OCT4 binding is significantly decreased upon H2A.Z knockdown (FC > 1.5, FDR < 0.001). The empirical cumulative distribution is plotted for the fold change of RbBP5 ChIP-Seq tag density for each group (knockdown/control). Right: as the left panel, except that the calculation was made for SUZ12 (X-axis). A line shifting to the left means a greater decrease in RbBP5 (or SUZ12) binding levels. P-values were calculated by Kolmogorov-Smirnov Tests.
Figure 6
Figure 6. H2A.Z is required for efficient differentiation of ESCs (see also Figure S5)
A. Comparative morphology of H2A.Z knockdown (shH2A.Z) and control (shLuc) EBs at day 4, day 7 and day 14. Primitive endoderm layers are indicated by red arrows. B. RT-PCR results for mRNAs from the H2A.Z knockdown (shH2A.Z) and shLuc (control) EBs. Data are represented as mean +/− standard deviation. C. Left: the percentage of genes down-regulated by H2A.Z knockdown at EB day 3 (Y-axis) plotted for genes that are significantly up-regulated (blue) and unchanged (red) in transition from wt ES cells to EB day 3. Right: the percentage of genes up-regulated by H2A.Z knockdown at EB day 3 (Y-axis) plotted for genes that are significantly down-regulated (blue) and unchanged (red) from wt ES cells to EB day 3. P-values were calculated by the t-test. D. Left panel: each point represents genes up-regulated by at least alpha-fold from ESC to EB day 3 in the control cells. The percentage of genes with expression values that follow the order: EB day 3 (shLuc) > EB day 3 (shH2A.Z) > ES is calculated for each point (Y-axis). The expression values of all genes are randomly shuffled independently for EB day 3 (shLuc), EB day 3 (shH2A.Z) and ESCs and are repeated many times to estimate the expectated percentage. Right panel: similar to the left panel but for genes that are down-regulated by at least alpha-fold from ESCs to EB day 3 in the control cells. The Y-axis shows the percentage of genes with expression levels following the order EB day 3 (shLuc) < EB day 3 (shH2A.Z) < ES. Data are represented as mean +/− standard deviation
Figure 7
Figure 7
H2A.Z facilitates RARα binding during RA-induced ESC differentiation. A. RARα bound genomic regions were sorted into quartiles based on RARα enrichment levels after 3 hours of RA exposure. The Y-axis indicates the percentage of RARα bound regions that overlap with pan H2A.Z islands identified in ESCs. B. UCSC Genome Browser image of tag distributions of pan H2A.Z in ES cells and RARα in H2A.Z knockdown (shH2A.Z) and control (shLuc) cells 3 hrs after RA exposure for a known RAR target gene cdx1. The promoter region that shows a significant decrease in RARα binding is highlighted by the red rectangle. C. The percentages of RARα binding sites that showed a significant increase (green), decrease (red), or no change (gray) in RARα binding after knockdown of H2A.Z. D. RARα binding sites are separated into two groups based on whether or not overlapping with a pan H2A.Z island identified in the ES cells. The empirical cumulative distribution is plotted for the fold change of RARα ChIP-Seq tag density for each group (shH2A.Z/shLuc). A line shifting to the left means systematically more decrease in the RARα levels. The P-value was calculated by Kolmogorov-Smirnov Test. E. Differential roles of H2A.Z in active genes and repressed genes in the self-renewal and differentiation of ESCs (see DISCUSSION for details).

Comment in

  • H2A.Z sets the stage in ESCs.
    Pandey R, Dou Y. Pandey R, et al. Cell Stem Cell. 2013 Feb 7;12(2):143-4. doi: 10.1016/j.stem.2013.01.012. Cell Stem Cell. 2013. PMID: 23395439

References

    1. Amat R, Gudas LJ. RARgamma is required for correct deposition and removal of Suz12 and H2A.Z in embryonic stem cells. J Cell Physiol. 2011;226:293–298. - PMC - PubMed
    1. Ang YS, Tsai SY, Lee DF, Monk J, Su J, Ratnakumar K, Ding J, Ge Y, Darr H, Chang B, et al. Wdr5 mediates self-renewal and reprogramming via the embryonic stem cell core transcriptional network. Cell. 2011;145:183–197. - PMC - PubMed
    1. Barski A, Cuddapah S, Cui K, Roh TY, Schones DE, Wang Z, Wei G, Chepelev I, Zhao K. High-resolution profiling of histone methylations in the human genome. Cell. 2007;129:823–837. - PubMed
    1. Bruce K, Myers FA, Mantouvalou E, Lefevre P, Greaves I, Bonifer C, Tremethick DJ, Thorne AW, Crane-Robinson C. The replacement histone H2A.Z in a hyperacetylated form is a feature of active genes in the chicken. Nucleic acids research. 2005;33:5633–5639. - PMC - PubMed
    1. Cao R, Zhang Y. SUZ12 is required for both the histone methyltransferase activity and the silencing function of the EED-EZH2 complex. Mol Cell. 2004;15:57–67. - PubMed

Publication types

MeSH terms

Associated data