. 2013 Jan;19(1):35-42.
doi: 10.3201/eid1901.120493.

Automated biosurveillance data from England and Wales, 1991-2011

Affiliations

Automated biosurveillance data from England and Wales, 1991-2011

Doyo G Enki et al. Emerg Infect Dis. 2013 Jan.

Abstract

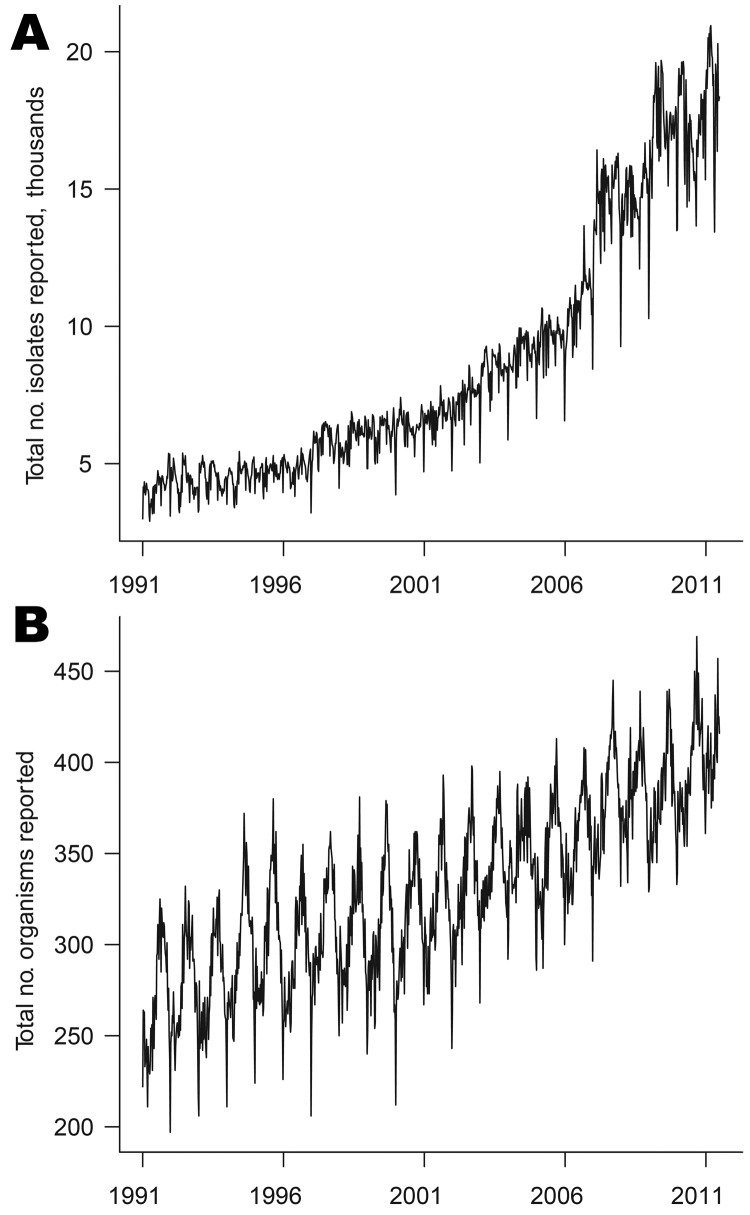
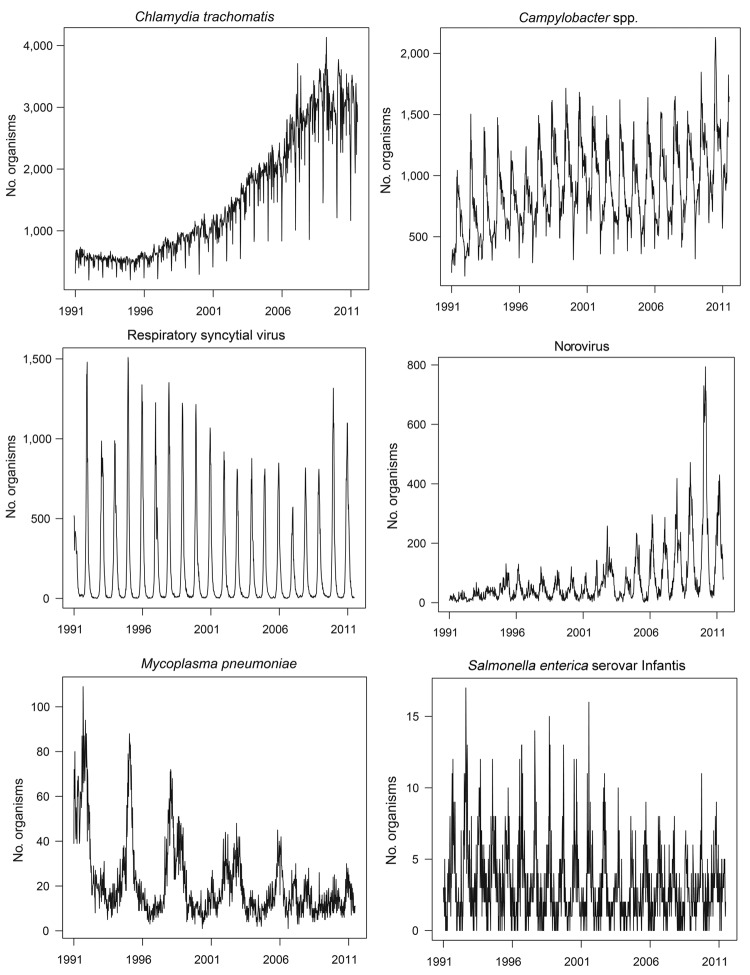
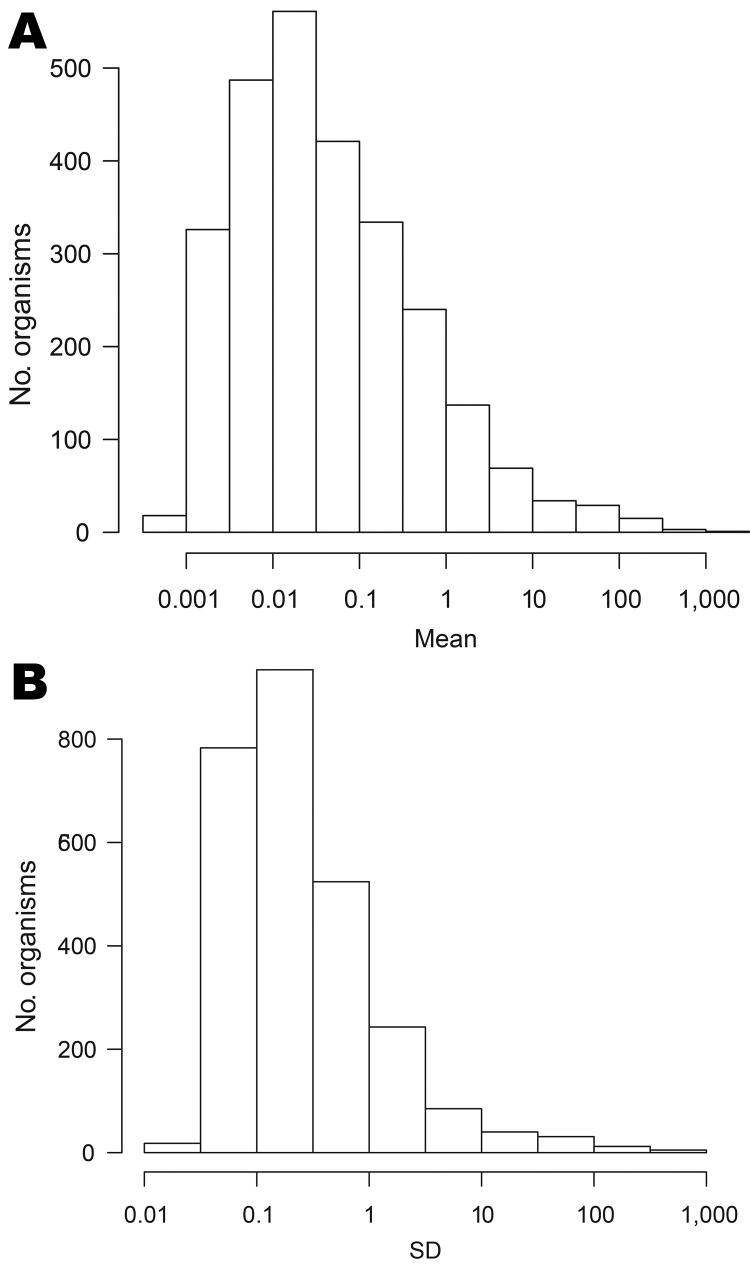
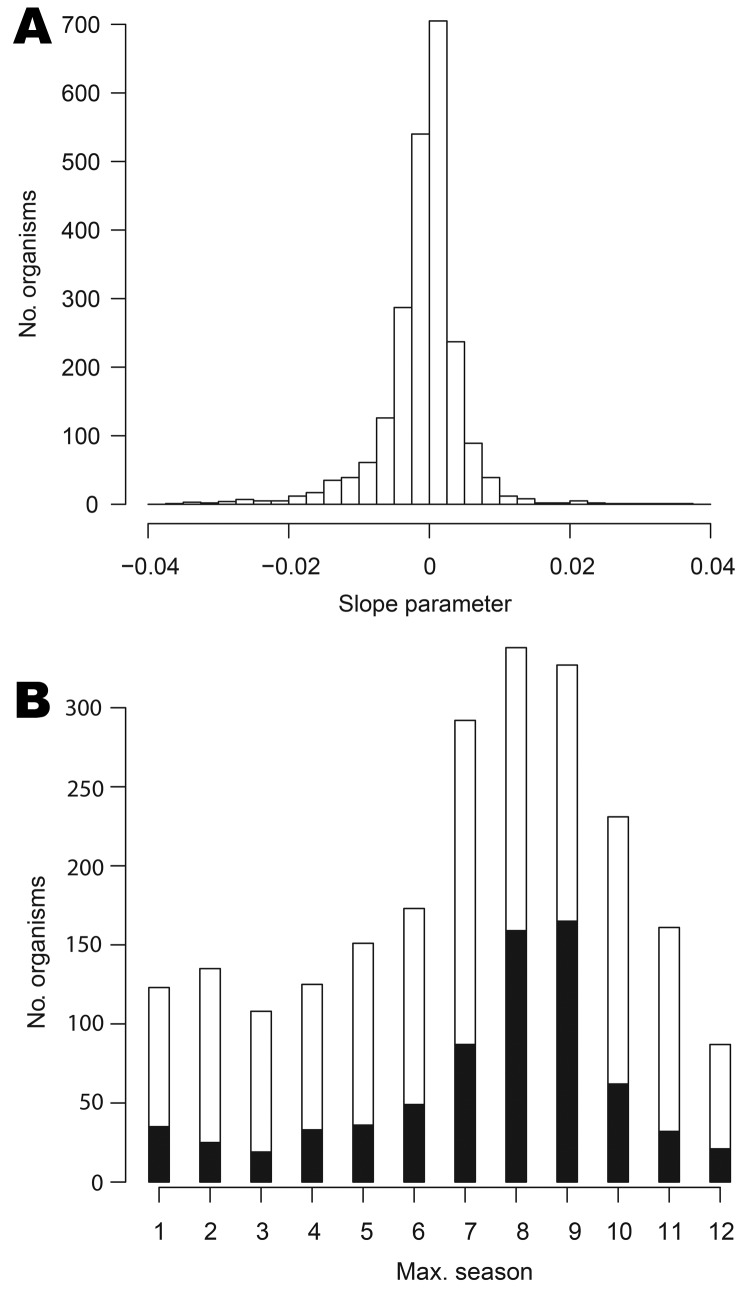
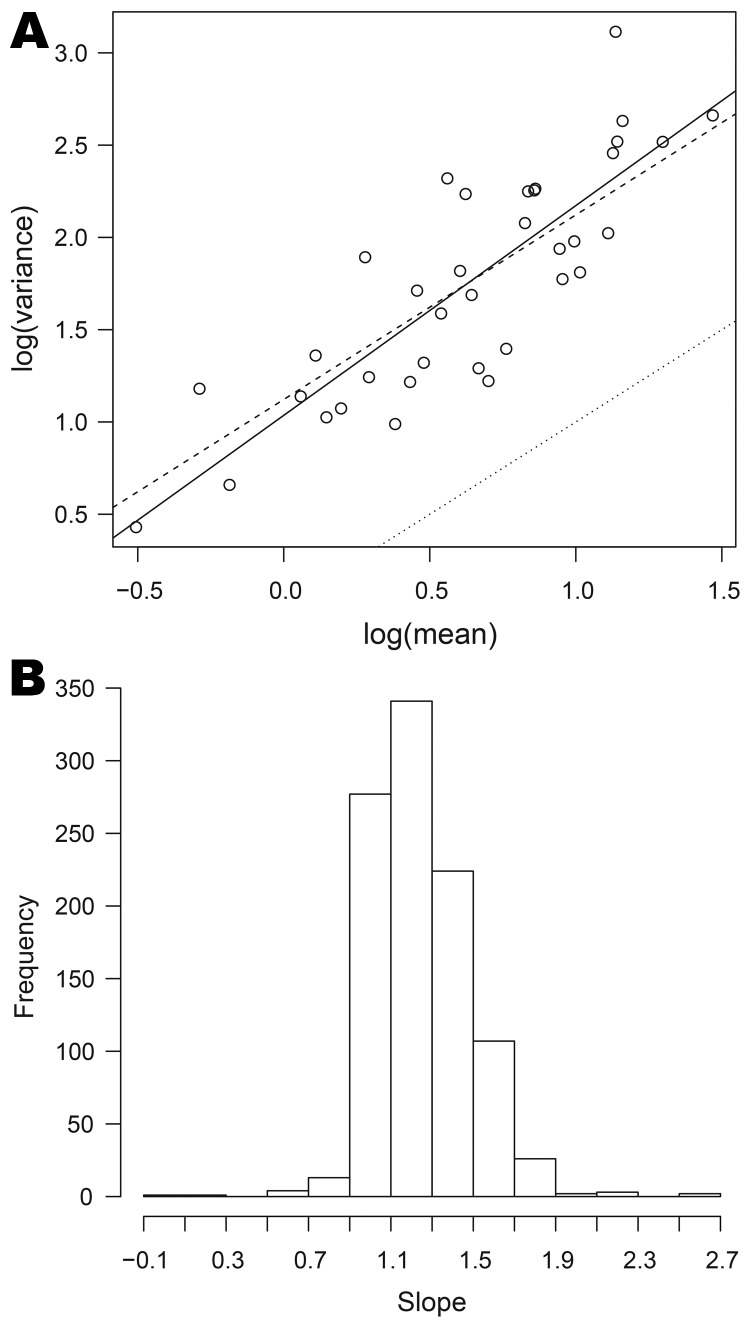
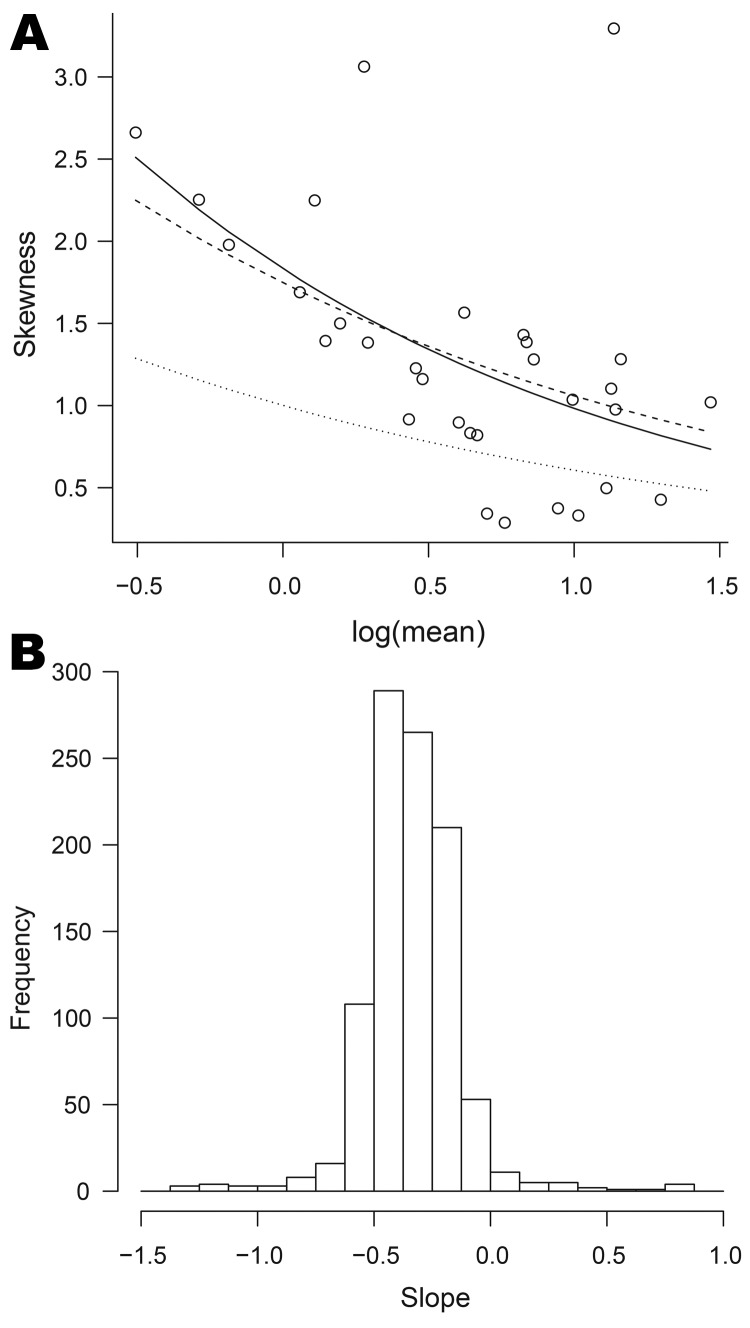
Outbreak detection systems for use with very large multiple surveillance databases must be suited both to the data available and to the requirements of full automation. To inform the development of more effective outbreak detection algorithms, we analyzed 20 years of data (1991-2011) from a large laboratory surveillance database used for outbreak detection in England and Wales. The data relate to 3,303 distinct types of infectious pathogens, with a frequency range spanning 6 orders of magnitude. Several hundred organism types were reported each week. We describe the diversity of seasonal patterns, trends, artifacts, and extra-Poisson variability to which an effective multiple laboratory-based outbreak detection system must adjust. We provide empirical information to guide the selection of simple statistical models for automated surveillance of multiple organisms, in the light of the key requirements of such outbreak detection systems, namely, robustness, flexibility, and sensitivity.


Figures

Figure 1
Figure 1
Weekly counts of organisms by date of specimen collection, England and Wales, 1991–2011: A) isolates; B) organism types.
Figure 2
Figure 2
Weekly counts for 6 selected organisms, by date of specimen collection, England and Wales, 1991–2011.
Figure 3
Figure 3
Distributions of mean (A) and SD (B) of weekly counts for all organisms, England and Wales, 1991–2011.
Figure 4
Figure 4
A) Distribution of estimated linear trend parameters (units: per week) for data on 2,250 organisms (excluding 4 organisms with extreme slopes), England and Wales, 1991–2011. B) Stacked bar chart of modal seasonal period for 2,254 organisms. The black bar sections represent organisms for which the seasonal effect is statistically significant.
Figure 5
Figure 5
Relationships between mean and variance for data on organisms collected, England and Wales, 1991–2011. A) The log of variance plotted against log of mean for Cyclospora spp. The full line is the best fit to the points; the dashed line corresponds to the quasi-Poisson model; the dotted line corresponds to the Poisson model. B) Histogram of the slopes of the best-fit lines for 1,001 organisms; the value 1 corresponds to the quasi-Poisson model (equation 1).
Figure 6
Figure 6
Relationships between mean and skewness for data on organisms collected, England and Wales, 1991–2011. A) Skewness plotted against log of mean for Cyclospora spp. The full curve is the best fit to the points; the dashed curve corresponds to the negative binomial model; the dotted curve corresponds to the Poisson model. B) Histogram of the parameters corresponding to the best-fit curves for 1,001 organisms; the value −0.5 corresponds to the negative binomial model (equation 2).

References

    1. Brookmeyer R, Stroup DF, editors. Monitoring the health of populations. Oxford (UK): Oxford University Press; 2004.
    1. Lawson AB, Kleinman K, editors. Spatial and syndromic surveillance for public health. Chichester (UK): Wiley; 2005
    1. Wagner M, Moore A, Aryel R, editors. Handbook of biosurveillance. Burlington (MA): Academic Press; 2006.
    1. Mead PS, Slutsker L, Dietz V, McCaig LF, Bresee JS, Shapiro C, et al. Food-related illness and death in the United States. Emerg Infect Dis. 1999;5:607–25. 10.3201/eid0505.990502 - DOI - PMC - PubMed
    1. Adak GK, Long SM, O’Brien SJ. Trends in indigenous foodborne diseases and deaths, England and Wales: 1992 to 2000. Gut. 2002;51:832–41. 10.1136/gut.51.6.832 - DOI - PMC - PubMed

Publication types

MeSH terms

LinkOut - more resources