. 2013 Mar;181(3):207-22.
doi: 10.1016/j.jsb.2012.12.005. Epub 2012 Dec 20.

Structural analysis of reactionary dentin formed in response to polymicrobial invasion

Affiliations

Structural analysis of reactionary dentin formed in response to polymicrobial invasion

Nattida Charadram et al. J Struct Biol. 2013 Mar.

Abstract

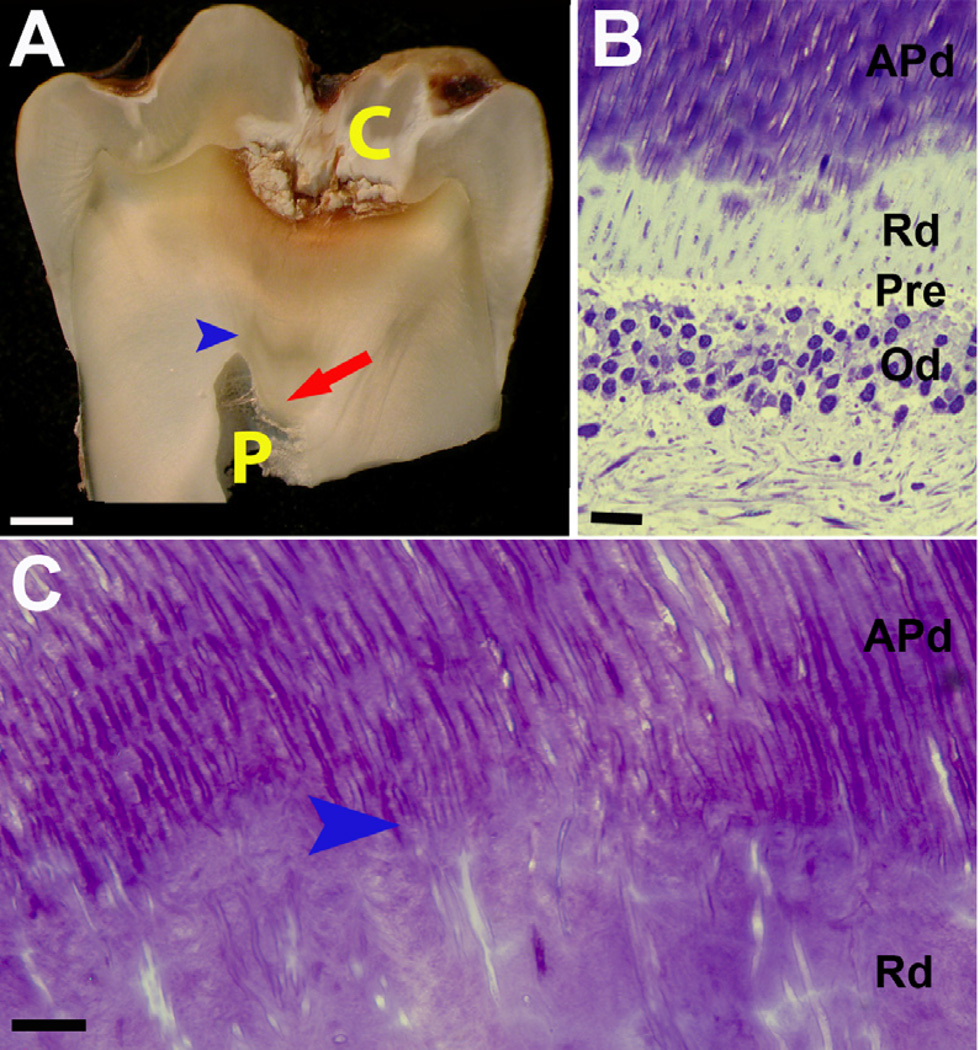
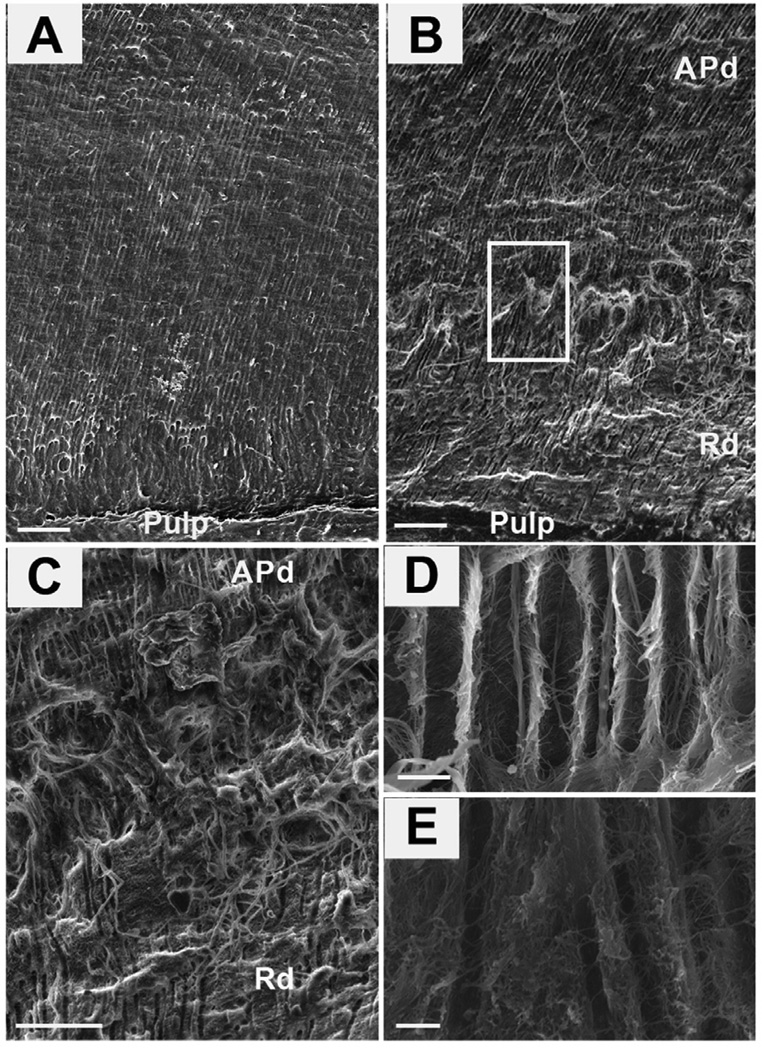
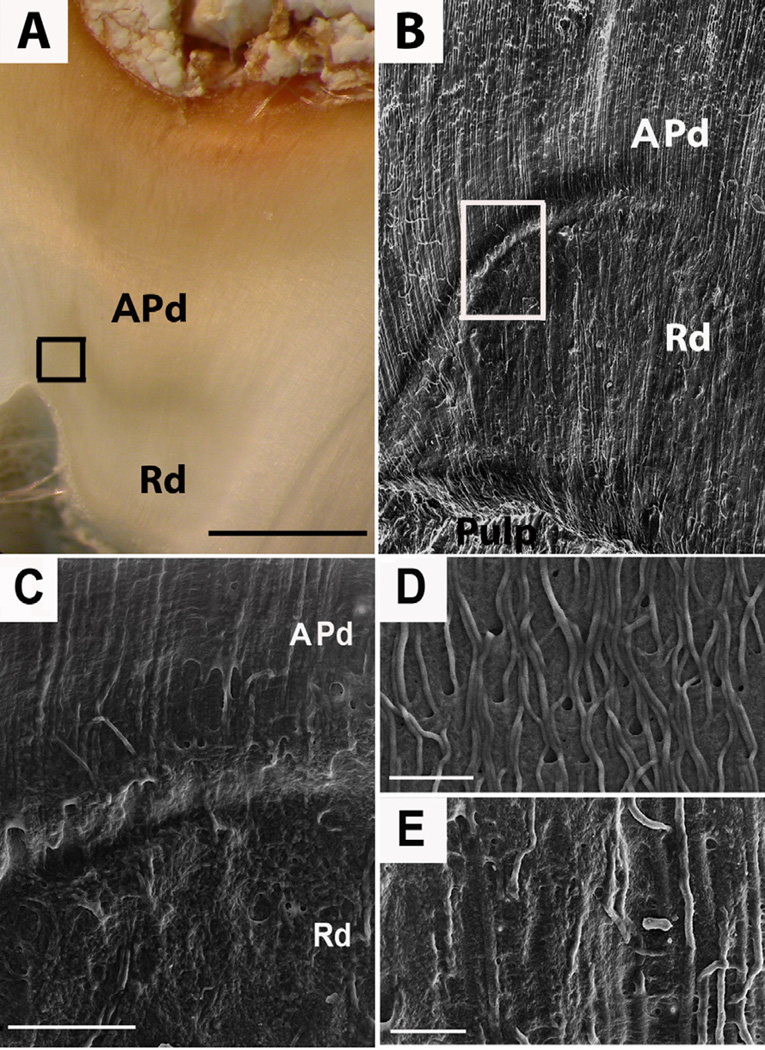
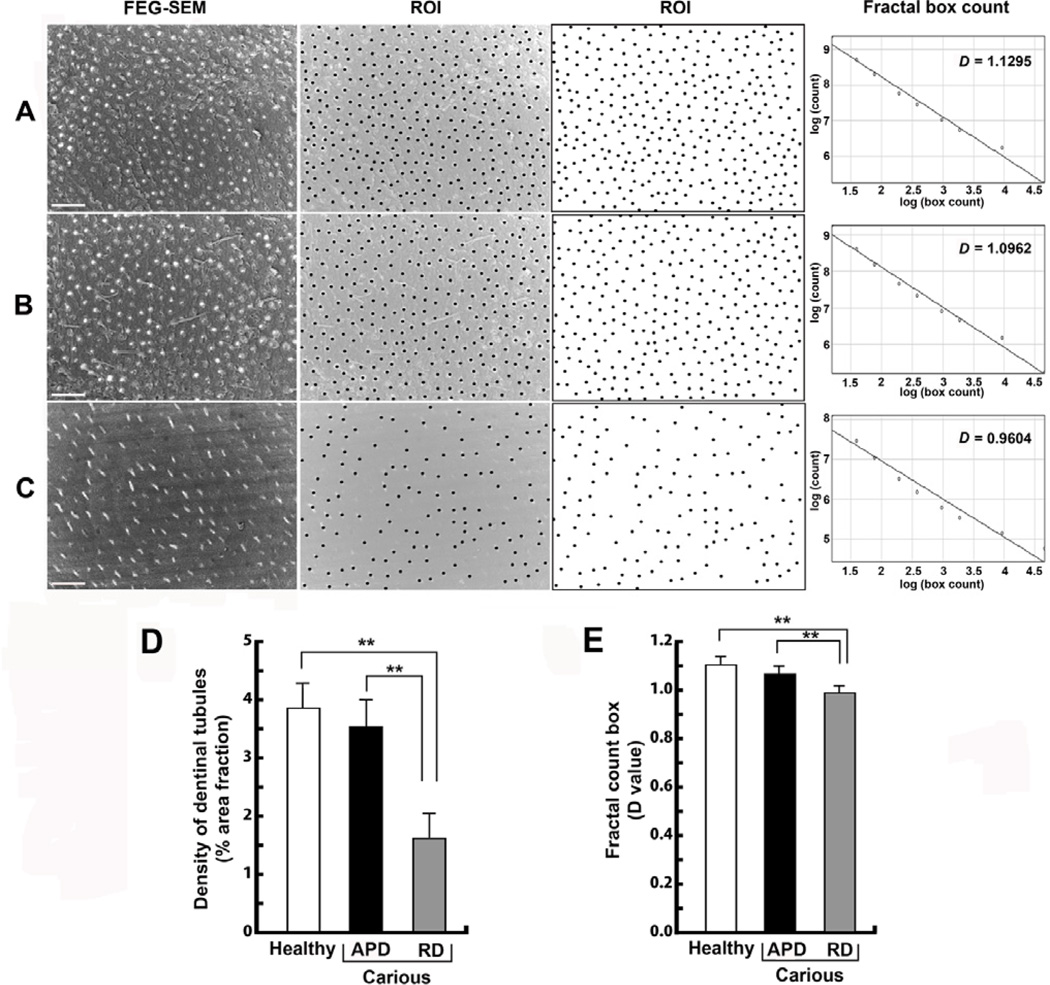
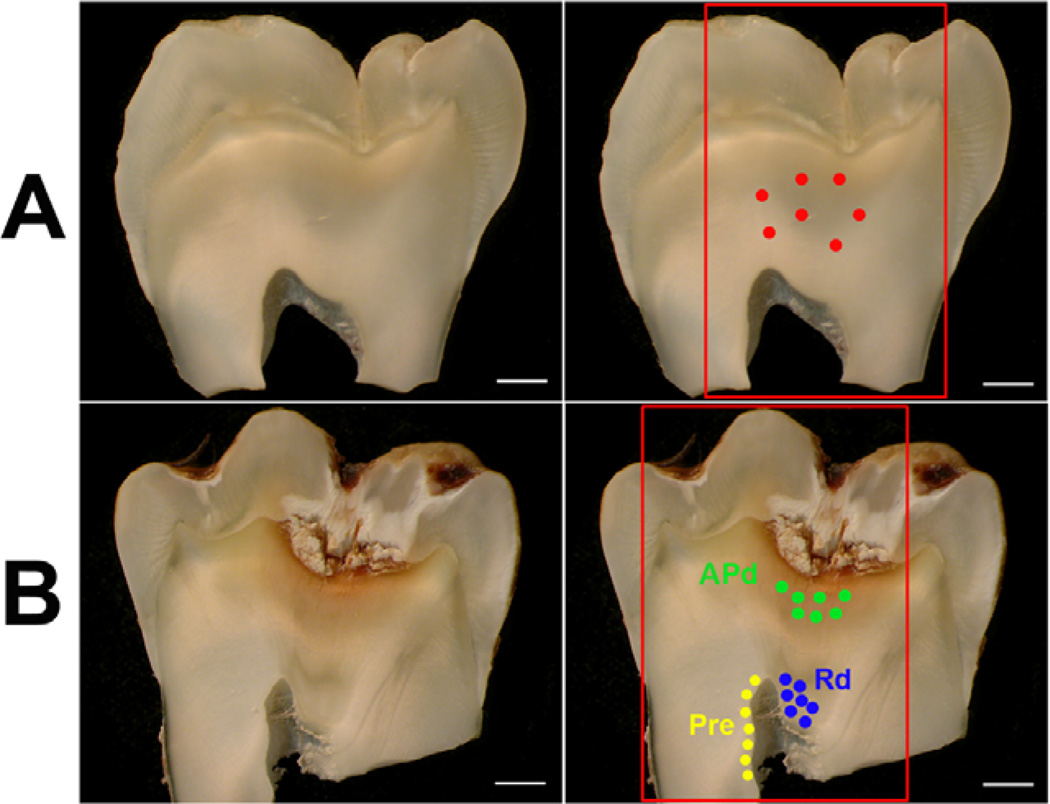
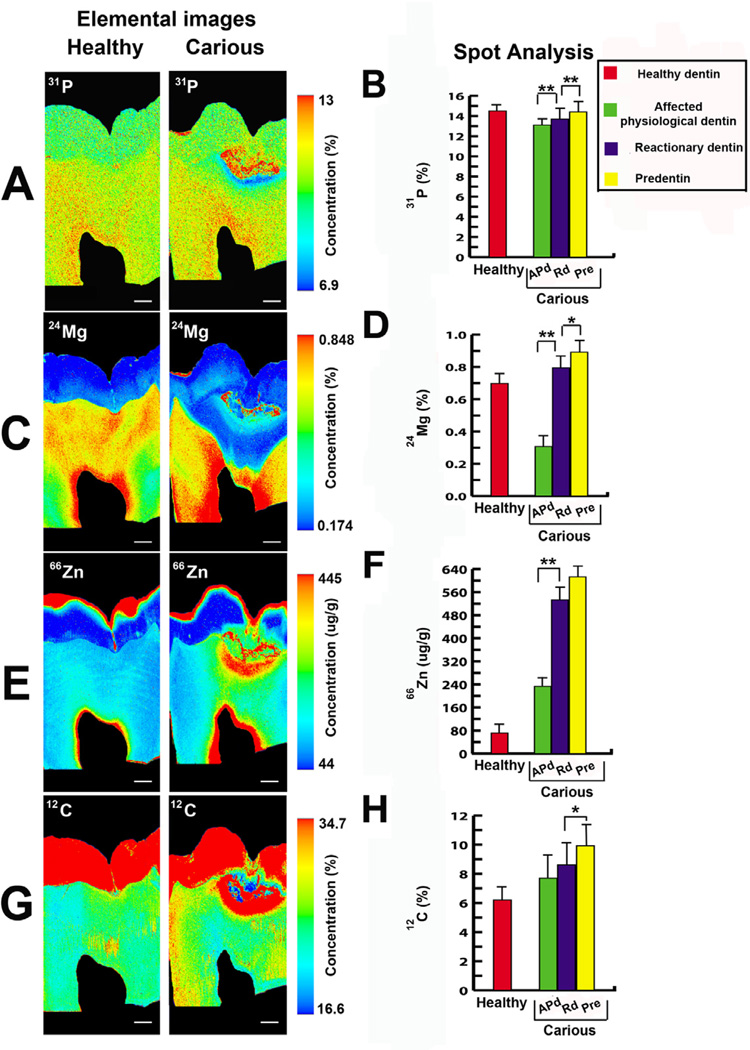
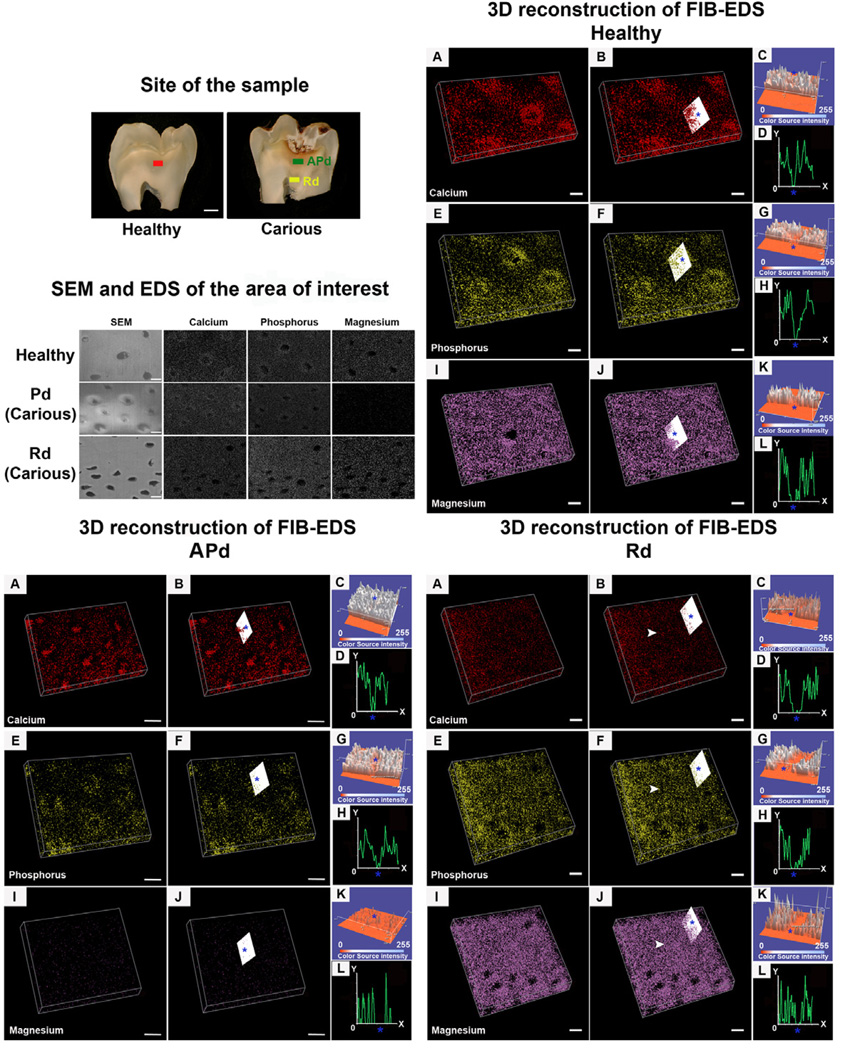
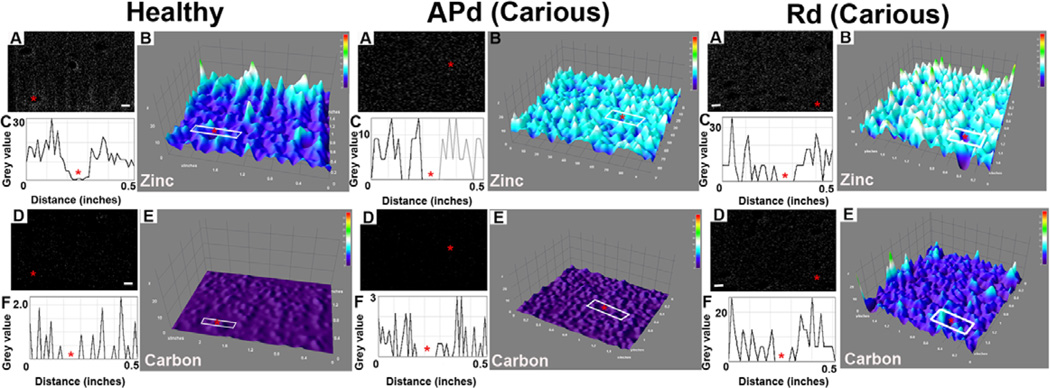
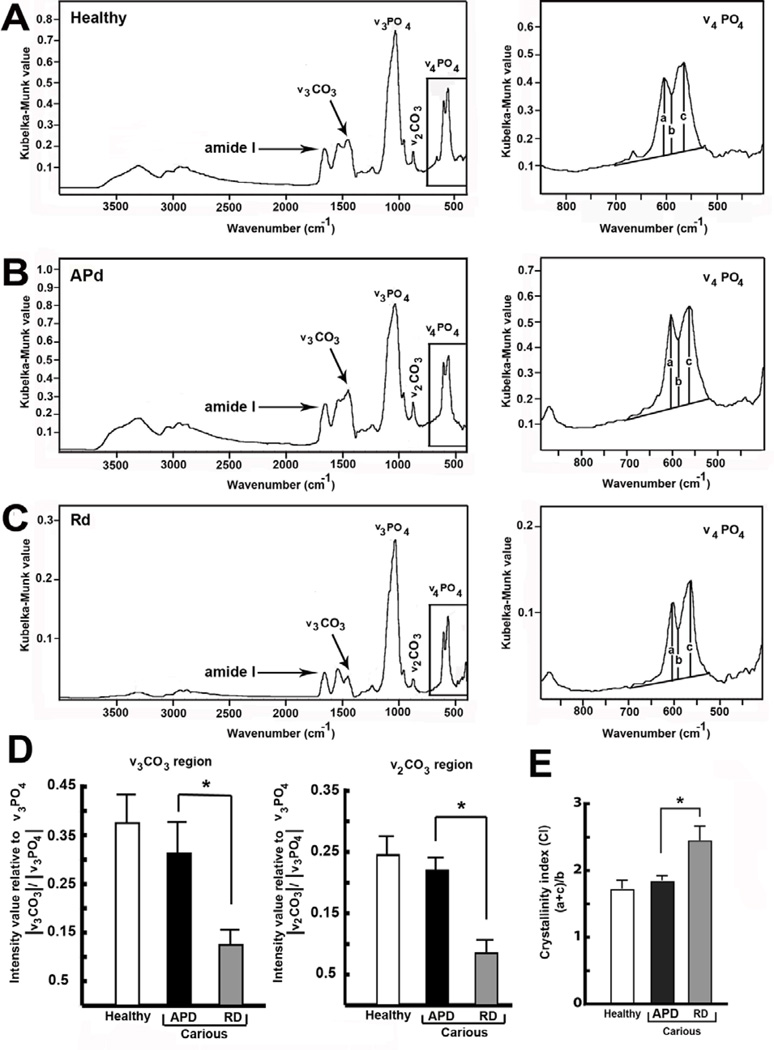
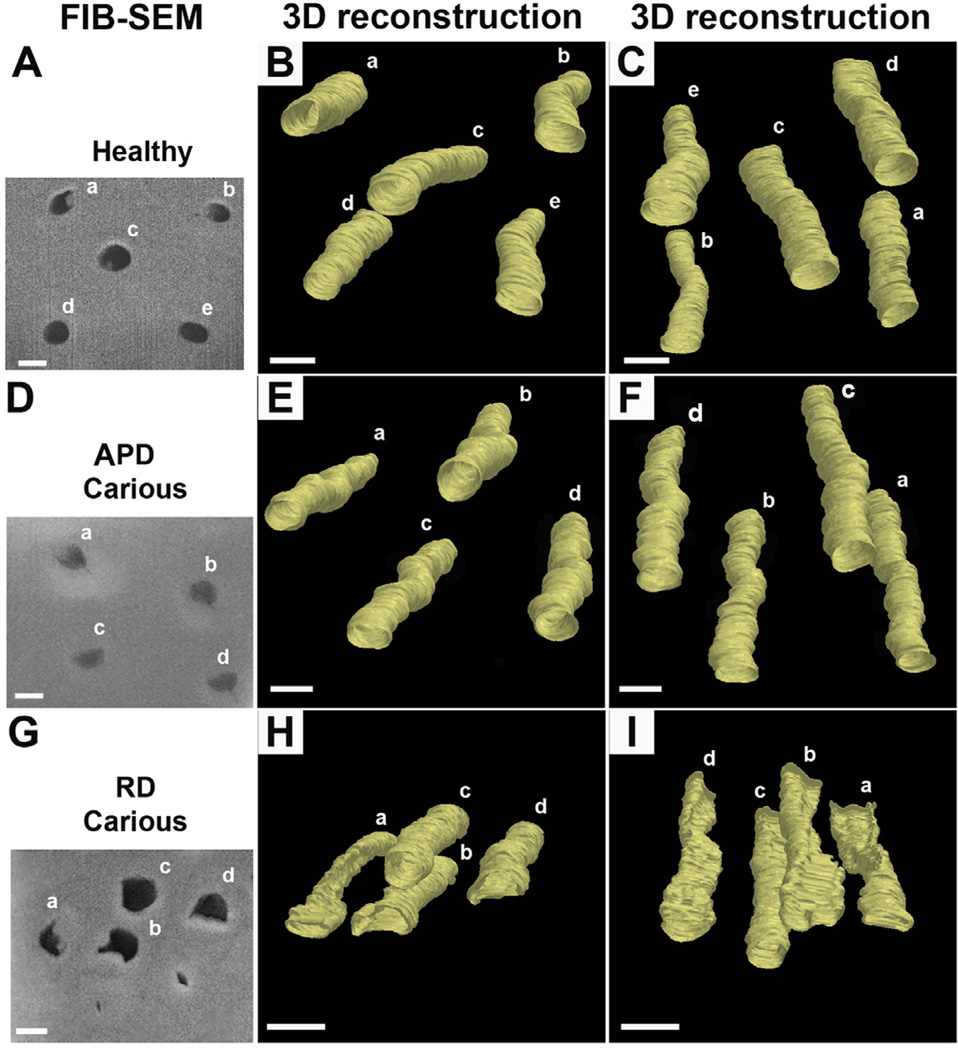
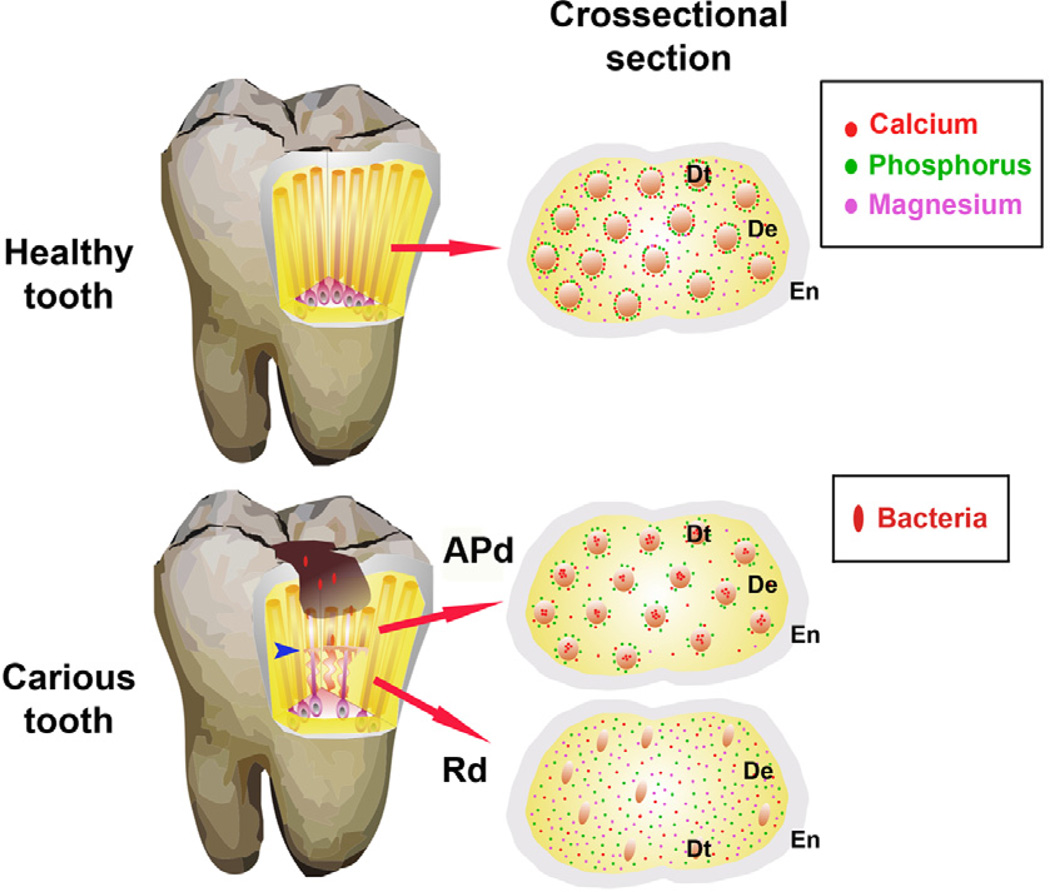
In response to microbial invasion of dentin odontoblasts secrete an altered calcified matrix termed reactionary dentin (Rd). 3D reconstruction of focused-ion-beam scanning electron microscopy (FIB-SEM) image slices revealed helical tubular structures in Rd that contrasted with regular cylindrical tubules characteristic of dentin from healthy teeth and affected so-called physiological dentin (Pd) lying exterior to Rd. This helical structure in Rd provided effective constriction of tubule lumen diameter that formed a barrier to bacterial advance towards the dental pulp. SEM of resin cast preparations revealed altered extension of odontoblast processes through Rd. The distribution of key mineral elements was studied by combination of 3D reconstruction of focused-ion-beam based X-ray microanalysis (FIB-EDS), laser ablation-inductively coupled plasma-mass spectrometry (LA-ICP-MS) and diffuse reflectance infrared Fourier transform spectroscopy (DRIFTS). There was a marked redistribution of calcium and phosphorous in Rd together with an increase of diffusely deposited magnesium compatible with the mineral deposition phase of synthesis of this altered matrix. Changes in tubule structure and mineral content characteristic of Rd are consistent with reduced hardness and lower elastic modulus reported for this matrix. Findings provide insight into the unique structure of Rd synthesised as a primary response to infection.


Conflict of interest statement

Conflict of interest: All the authors state that they have no conflicts of interest.

Figures

Figure 1
Figure 1. Representative images demonstrating the localized response of reactionary dentin (Rd) formation
(A) In this carious tooth, Rd (red arrow) is deposited beneath the carious lesion (C) and affected physiological dentin (APd) with an obvious boundary between APd and Rd (blue arrow head). The pulp (P) has been reduced by deposition of Rd. (B) Toluidine blue stain of longitudinal section from an early stage of Rd formation showing the interface between odontoblasts (Od) and dentin. The limited amount of Rd is located inferior to APd but superior to pre-dentin (Pre) and the odontoblasts (Od). Scale bar 10 µm. (C) High magnification of Toluidine blue of longitudinal section of dentin from carious tooth presents the structure of Rd relative to APd. The varying course and wide to narrow lumen observed in Rd suggestive of spiral conformation. Scale bar 10 µm.
Figure 2
Figure 2. Scanning electron micrographs (SE detector at 10.00 kV) showing the tubular structure of healthy and carious samples
Reactionary dentin (Rd) displays fewer tubules with constrictions and irregular shapes. (A) A low magnification view (X400) of a fresh fracture of a healthy dentin sample in longitudinal section. Scale bar 20 µm. (B) A low magnification view (X400) of a carious sample reveals the different structure in the area of affected physiological dentin (APd) compared to reactionary dentin (Rd). Scale bar 20 µm. (C) A high magnification view (X1,200) of the boundary between APd and Rd of the boxed area in B. Scale bar 20 µm. (D) A high magnification view (X2,500) of the morphology of Pd. Scale bar 2 µm. (E) A high magnification view (X2,500) of the morphology of Rd. Scale bar 2 µm.
Figure 3
Figure 3. Resin-cast technique of carious dentin samples investigated by scanning electron microscopy (SE detector at 10.00 kV) showing the network of odontoblastic processes in dentin
Reactionary dentin (Rd) presents fewer odontoblastic processes with more irregular shape. (A) Representative image demonstrating position and boundary (boxed) between APd and Rd. Scale bar 2 mm. (B) A low magnification view (X400) of the carious sample reveals the different structure of affected physiological dentin (APd) compared to Rd; also the clear separation between APd and Rd evident by the transition zone (boxed). Scale bar 20 µm. (C) A high magnification view (X1,200) of the boundary between APd and Rd of the boxed area in B. Scale bar 20 µm. (D) A high magnification view (X1,800) of the morphology of the odontoblastic processes in APd. Scale bar 10 µm. (E) A high magnification view (X1,800) of the morphology of the odontoblastic processes in Rd. Scale bar 10 µm.
Figure 4
Figure 4. Representative images demonstrating the tubular distribution pattern in healthy and carious samples
Rd presents fewer numbers of tubules and with a lower degree of order of tubular distribution pattern compared to healthy dentin and APd. (A) Cross-sectional view of tubular distribution pattern in a healthy tooth. Uniformly distributed tubules are observed (first to third panel) [ROI = region of interest]. Scale bar 20 µm. Findings were confirmed by analysis of fractal count box (fourth panel). (B) Tubular distribution pattern of APd from a carious tooth. Uniformly distributed tubules are also observed in APd (first to third panel). Scale bar 20 µm. (C) Tubular distribution pattern of Rd from carious tooth indicates a lower degree of order of tubular distribution pattern (first to third panel). Scale bar 20 µm. (D) Bar chart demonstrating the percentage area fraction of the density of dentinal tubules in each area (n=27 fields from 3 teeth). (E) Bar chart representing degree of order in each dentin area (n=27 fields from 3 teeth). The data for tubular analysis are expressed as mean values ± SD. ** p < 0.02.
Figure 5
Figure 5. Representative images demonstrating the area analysed by LA-ICP-MS in both healthy and carious samples
(A) Longitudinal section of healthy sample (first and second panels). The area in the red box demonstrates the area analysed for elemental images and the seven red spots indicate the area analysed for spot analysis (second panels). Scale bar 2 mm. (B) Longitudinal section of carious sample (first and second panels). The area in the red box shows the area analysed for elemental imaging. The green spots show the areas of spot analysis of affected physiological dentin (APd), the blue spots demonstrate the area of spot analysis of reactionary dentin (Rd) and the yellow spots reveal the area of spot analysis for pre-dentin (Pre). Scale bar 2 mm.
Figure 6
Figure 6. Representative elemental images (31P, 24Mg, 66Zn and 12C) of the areas analysed in healthy and carious samples in longitudinal section by LA-ICP-MS including physiological dentin (Pd), affected physiological dentin (APd), reactionary dentin (Rd) and pre-dentin (Pre)
The bar charts represent quantitative data (31P, 24Mg, 66Zn and 12C) for seven spot analysis of affected physiological dentin (APd), reactionary dentin (Rd) and pre-dentin (Pre) in carious samples and physiological dentin (Pd)in healthy samples. [31P], [24Mg] and [66Zn] were significantly increased in Rd compared to APd. [31P], [24Mg] and [12C] were significantly different between Rd and Pre. All values depict means ± SD. *P ≤ 0.05; ** P ≤ 0.02. (A) Elemental image of [31P] in healthy (first panel) and carious (second panel) samples. In carious samples [31P] gradually increased toward the pulp (n=3 teeth). Scale bar 2 mm. (B) The bar chart presents the significant increase of [31P] in Rd compared to APd and increase in Pre compared to Rd (n=6 teeth). (C) Elemental mapping of the [24Mg] gradient in healthy (first panel) and carious (second panel) samples. In carious samples, [24Mg] decreased in APd under the carious lesion but increased in the area close to the pulp (n=3 teeth). Scale bar 2 mm. (D) The bar chart shows the marked increase of [24Mg] in Rd compared to APd but gradual increase in Pre compared to Rd (n=6 teeth). (E) Elemental images of [66Zn] in healthy (first panel) and carious (second panel) samples. In carious samples, APd under carious lesion shows intense [66Zn] gradient but higher intensity of [66Zn] was found close to the pulp (n=3 teeth). Scale bar 2 mm. (F) The bar chart reveals the significant increase of [66Zn] in Rd compared to APd (n=6 teeth). (G) Elemental images of [12C] in healthy (first panel) and carious (second panel) samples (n=3 teeth). Scale bar 2 mm. (H) The bar chart shows high variation of [12C] in APd of carious sample. The difference was not significant between APd and Rd. However, the difference in [12C] content in Pre and Rd was significant (n=6 teeth).
Figure 7
Figure 7. Representative images of the areas analysed and 3D reconstruction of the elements of interest (calcium, phosphorus and magnesium) in healthy and carious samples obtained by FIB-EDS analysis
Differences in distribution of elements of interest in each area including dentin in healthy sample, affected physiological dentin (APd) and reactionary dentin (Rd) in carious samples were found. The examples of the analysed sites from the samples are demonstrated in “Site of the sample”. The red bar is the analysed site from a healthy dentin sample, the green bar represents analysed site in APd and the yellow bar represents the analysed site in Rd from a carious sample. Scale bar 2 mm. The cross-sectional zones of sites of interest observed under SEM and the example of a single slide EDS scan on those samples are exhibited in “SEM and EDS of area of interest”. Scale bar 2 µm. Healthy sample. (A) 3D reconstruction of calcium detected by FIB-EDS scanned from cross-sections of dentin. Scale bar 2 µm. (B) The slice analysed (white slice) shows accumulation of calcium around dentinal tubules (blue star) but dispersion of calcium in the inter-tubular area. Scale bar 2 µm. This was confirmed by surface plot (C) and plot profile (D). (E) 3D reconstruction of FIB-EDS scans of phosphorus from cross-sections of dentin. Scale bar 2 µm. (F) Accumulation of phosphorus around the dentinal tubules (blue star) was also observed (white slice). Scale bar 2 µm. This observation was confirmed by surface plot (G) and plot profile (H). (I) 3D reconstruction of magnesium in cross-sections. Scale bar 2 µm. (J) Similar distribution of magnesium around the tubules (blue star) and inter-tubular dentin was found. Scale bar 2 µm. Analyses from surface plots (K) and plot profiles (L) confirmed the observation (n=2 teeth). Affected physiological dentin (APd) from carious sample. (A) 3D reconstruction of detected calcium from FIB-EDS of cross-sections of dentin. Scale bar 2 µm. (B) The analysis (white slice) reveals a calcium plug inside the tubule (blue star). No accumulation of calcium around the tubules was detected. Scale bar 2 µm. The observation was confirmed by surface plot (C) and plot profile (D). (E) 3D reconstruction of phosphorus detected by FIB-EDS scan from cross-sections of dentin. Scale bar 2 µm. (F) The accumulation of phosphorus around dentinal tubules (blue star) was observed. Lower intensity of phosphorus was recorded in inter-tubular dentin. Scale bar 2 µm. Confirmed by surface plot (G) and plot profile (H). (I) 3D reconstruction of magnesium in cross-sections of dentin. Magnesium had very weak signal in APd. Scale bar 2 µm. (J) The analysis (white slice) indicates the similarity of the distribution of magnesium in the area around dentinal tubules (blue star) and inter-tubular dentin. Scale bar 2 µm. This observation was confirmed by analysis of surface plots (K) and plot profiles (L) (n=2 teeth). Reactionary dentin (Rd) from carious sample. (A) 3D reconstruction of calcium detected from FIB-EDS scans in cross-sections. Scale bar 2 µm. (B) The analysis (white slice) reveals the similarity of distribution of calcium between peritubular (blue star) and inter-tubular dentin. The same intensity of calcium signal was observed in areas devoid of tubules (white arrow). Scale bar 2 µm. This observation was confirmed by surface plots (C) and plot profiles (D). (E) 3D reconstruction of detected phosphorus from FIB-EDS scans from cross-sections of dentin. Scale bar 2 µm. (F) Phosphorus was also detected in areas devoid of tubules (white arrow). Phosphorus was similarity distributed in the peritubular (blue star) and inter-tubular dentin. Scale bar 2 µm. Findings were confirmed by surface plots (G) and plot profiles (H). (I) 3D reconstruction of magnesium in cross-sections of dentin. Scale bar 2 µm. (J) High intensity of magnesium was detected throughout Rd including area devoid of tubules (white arrow). Similarity intensitiy of magnesium signal was detected for peritubular (blue star) and inter-tubular dentin. Scale bar 2 µm. This was confirmed by surface plots (K) and plot profiles (L) (n=2 teeth).
Figure 8
Figure 8. Representative images for zinc and carbon distribution detected by FIB-EDS from cross-sections of dentin
The different intensities and distribution of these elements in each area are displayed. Healthy sample. (A) Representative image of FIB-EDS scan for zinc. Scale bar 2 µm. (B) 3D surface plot of FIB-EDS image of zinc presents a weak signal, with accumulation of zinc around the tubules (red star). (C) Plot profile of the area in white box in (B) confirms the accumulation of zinc around the tubule (red star). (D) Representative image of detected carbon from FIB-EDS scan. Scale bar 2 µm. (E) The 3D surface plot of carbon presents a weak signal with similar distribution between peritubular and inter-tubular dentin surrounding the tubule (red star). (F) The plot profile in white box (E) confirms the finding (n=2 teeth). Affected physiological dentin (APd) from carious sample. (A) Representative image of zinc detected by FIB-EDS. Scale bar 2 µm. (B) 3D surface plot reveals the higher intensity of zinc compared to healthy sample. Accumulation of zinc around dentinal tubules (red star) was preserved. Confirmed by plot profiles (C). (D) Representative image of carbon detected by FIB-EDS. Scale bar 2 µm. (E) The 3D surface plot presents a weak signal for carbon in APd with dispersed distribution. (F) Plot profile of the area in white box (E) confirms this observation (n=2 teeth). Reactionary dentin (Rd) from carious sample. (A) Representative image of detected zinc from FIB-EDS. Scale bar 2 µm. (B) The 3D surface plot shows higher intensity of zinc in Rd compared to healthy and APd but similar distribution of zinc was observed. (C) Plot profile in white box (B) confirms the finding. (D) Representative image of carbon detected from FIB-EDS. Scale bar 2 µm. (E) The 3D surface plot shows higher intensity of carbon in Rd compared to healthy dentin and APd. The similarity of distribution of carbon in the area around the tubule (red star) and inter-tubular dentin is apparent. (F) Plot profiles in white box (E) confirm the observation (n=2 teeth).
Figure 9
Figure 9. Diffuse reflectance infrared Fourier transform spectroscopy (DRIFTS) analysis of dentin powder
(A) DRIFTS absorbance spectrum of healthy dentin powder (first panel). Detailed DRIFTS absorbance spectrum of healthy dentin powder between 400 and 850 cm−1 (second panel). (B) DRIFTS absorbance spectrum of APd powder (first panel). Details DRIFTS absorbance spectrum of APd powder between 400 and 900 cm−1 (second panel). (C) DRIFTS absorbance spectrum of Rd powder (first panel) and the DRIFTS absorbance spectrum of Rd powder between 400 and 900 cm−1 (second panel). (D) Bar graph representing intensity value relative to anti-symmetric ν3 PO4 stretching mode in ν3 CO32− and ν2 CO3 regions (n=3 teeth). The B-type carbonate substitution in Rd is lower compared to healthy dentin and APd in both regions. (E) Bar graph demonstrating Crystallinity Index (CI) produced by (a+c)/b. In Rd, CI is significantly higher compared to healthy dentin and APd (n=3 teeth). The data for DRIFTS analysis are expressed as mean values ± SD. * p ≤ 0.05.
Figure 10
Figure 10. Representative images from 3D reconstruction of cross-sections of areas of interest using FIB-SEM
Difference in tubular structure of dentin in Rd compared with healthy dentin and APd, was observed. (A) Cross-section of analysed site in healthy sample observed under SEM. Scale bar 2 µm. (B) and (C) 3D reconstruction of tubular structure in healthy sample in different views. Uniformly round tubules were observed (n=40 tubules from 2 teeth). Scale bar 2 µm. (D) Scanning electron micrograph of a cross-section of APd in carious sample. Scale bar 2 µm. (E) and (F) different views of the 3D reconstruction of tubular structure in APd from carious sample. Round tubular structure as seen in healthy sample was observed (n=40 tubules from 2 teeth). Scale bar 2 µm. (G) Cross-section of Rd from carious sample observed under SEM. The slit and irregular structures of dentinal tubules are evident. Scale bar 2 µm. (H) and (I) 3D reconstruction of tubular structure in Rd from carious sample in different views. Note the twisted appearance of the dentinal tubules in Rd (n=40 tubules from 2 teeth). Scale bar 2 µm.
Figure 11
Figure 11. Diagrammatic representation of tooth structure affected by the carious Process
Healthy tooth. Cross-section shows the enamel (En), dentin (De) and dentinal tubules (Dt) with mineral content. A highly mineralised calcium and phosphorus annular ring surrounding each Dt is observed with dispersion of magnesium in peritubular and inter-tubular dentin. Carious tooth. When bacterial invasion occurs calcium is lost from peritubular dentin and forms an intra-tubular plug. The phosphorus annular ring persists in affected physiological dentin (APd), but magnesium decreases. Reactionary dentin (Rd) formed in response to carious stimulation displays lower numbers of tubules and odontoblast processes. The cross-section shows reduction of diameter of tubules with scattered distribution of all elements but higher intensity of phosphorus and magnesium compared to dentin from healthy teeth and APd. The modified helical tubular structure in Rd (blue arrow) helps prevent the invasion of bacteria and potentially, acts as a shock absorber to compensate for the loss of upper tooth structure due to the carious lesion.

References

    1. Addadi L, Weiner S. Interactions between acidic proteins and crystals: stereochemical requirements in biomineralization. Proc Natl Acad Sci U S A. 1985;82:4110–4114. - PMC - PubMed
    1. Addadi L, Geva M, Weiner S. On how proteins interact with crystals and their effect on crystal formation. Z Kardiol. 2001;90:92–98. - PubMed
    1. Addadi L, Raz S, Weiner S. Taking advantage of disorder: amorphous calcium carbonate and its roles in biomineralization. Adv Mat. 2003;15:959–970.
    1. Bergman B, Friberg U, Lohmander S, Oberg T. Morphologic and autoradiographic observations on the effect of zinc deficiency on endochondral growth sites in the white rat. Odontol Revy. 1970;21:379–399. - PubMed
    1. Blumenthal NC, Posner AS. Effect of preparation conditions on the properties and transformation of amorphous calcium phosphate. Mat Res Bull. 1972;7:1181–1190.

Publication types

LinkOut - more resources