. 2013 Feb;20(2):237-43.
doi: 10.1038/nsmb.2466. Epub 2012 Dec 23.

Evolutionary conservation of codon optimality reveals hidden signatures of cotranslational folding

Affiliations

Evolutionary conservation of codon optimality reveals hidden signatures of cotranslational folding

Sebastian Pechmann et al. Nat Struct Mol Biol. 2013 Feb.

Abstract

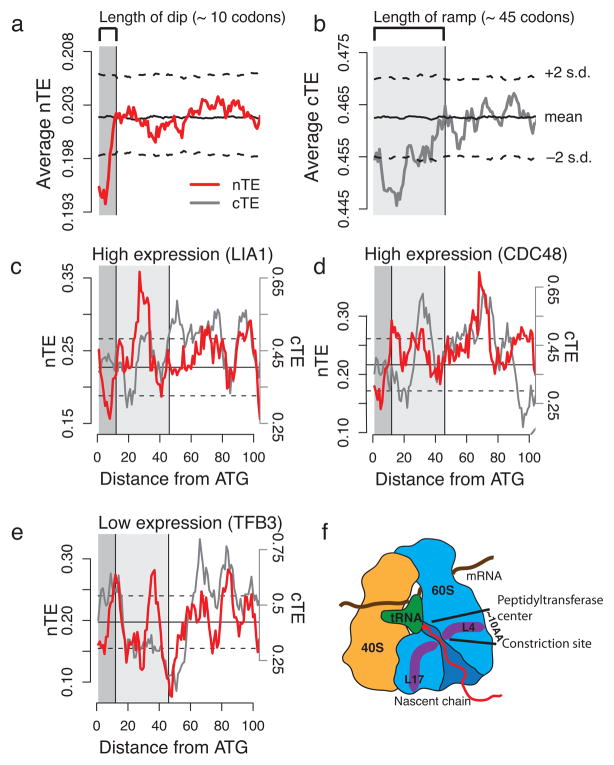
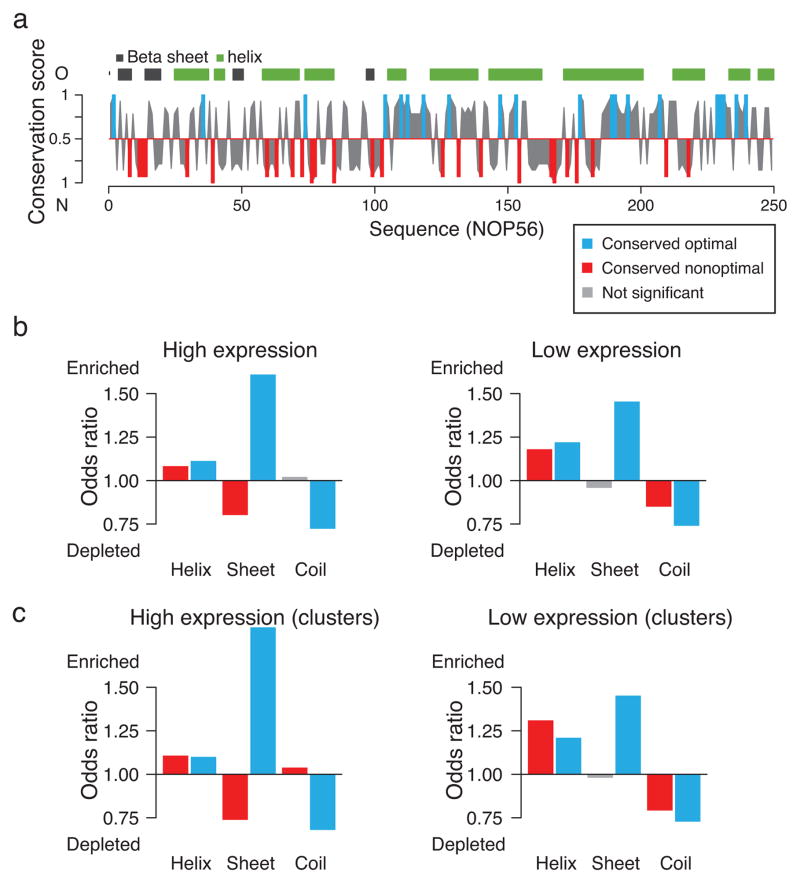
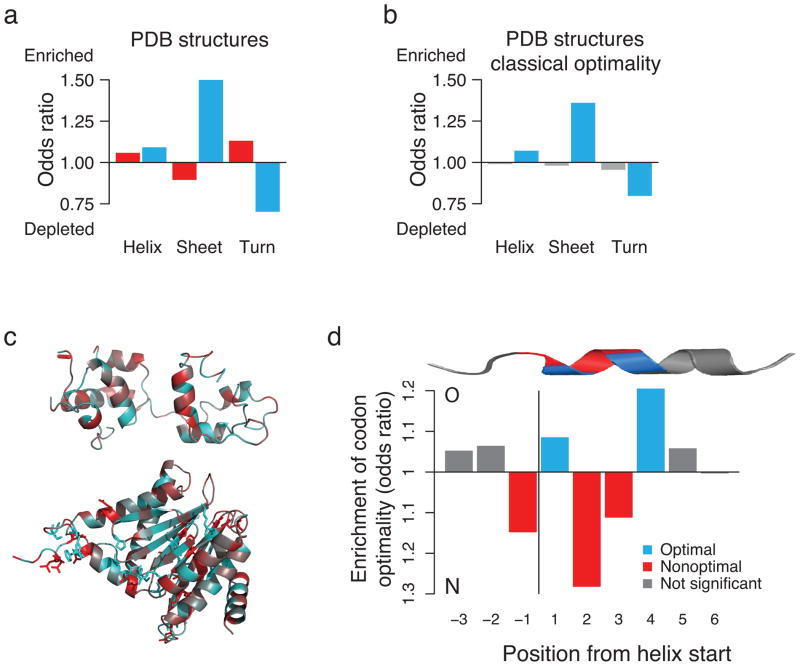
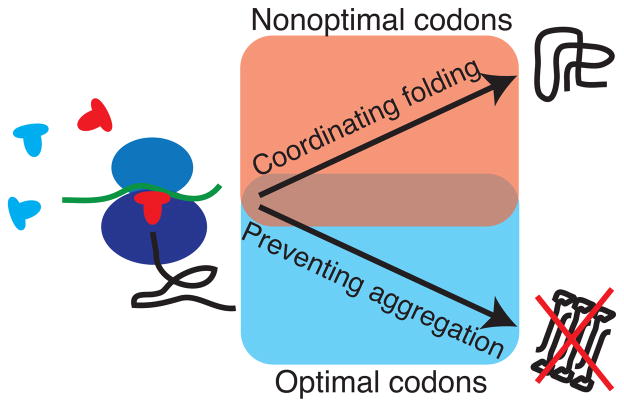
The choice of codons can influence local translation kinetics during protein synthesis. Whether codon preference is linked to cotranslational regulation of polypeptide folding remains unclear. Here, we derive a revised translational efficiency scale that incorporates the competition between tRNA supply and demand. Applying this scale to ten closely related yeast species, we uncover the evolutionary conservation of codon optimality in eukaryotes. This analysis reveals universal patterns of conserved optimal and nonoptimal codons, often in clusters, which associate with the secondary structure of the translated polypeptides independent of the levels of expression. Our analysis suggests an evolved function for codon optimality in regulating the rhythm of elongation to facilitate cotranslational polypeptide folding, beyond its previously proposed role of adapting to the cost of expression. These findings establish how mRNA sequences are generally under selection to optimize the cotranslational folding of corresponding polypeptides.


Figures

Figure 1
Figure 1
A normalized translational efficiency scale that balances tRNA supply and demand. (a) Charged tRNAs recognize the codons in the mRNA and deliver the corresponding amino acid for elongation of the nascent chain. (b) The competition for tRNAs depends on both their availability in the cellular tRNA pool (supply), and the usage of the corresponding codons in the cell (demand). (c) The classical translational efficiency (cTE) scale is the established tRNA adaptation index. Codons that are over-represented in the most highly expressed genes are marked as optimal, and nonoptimal otherwise. (d) The normalized translational efficiency (nTE) scale is defined by dividing the cTE by the codon usage, incorporating the competition between tRNA supply and demand. Codons are optimal if their relative tRNA availability exceeds the relative codon usage. The set of optimal codons from the classical scale is indicated with *. (e) Comparison of the cTE and nTE scales. (f) Correlations between the cTE and nTE scales and the codon usage.
Figure 2
Figure 2
A conserved short “dip” of low translational efficiency at the beginning of mRNAs. (a) The average nTE profile of the S. cerevisiae genome exhibits a very short “dip” of low translational efficiency at the beginning of the coding regions that spans approx. across the first 10 codons. (b) The average cTE profile shows an initial region of low translational efficiency that spans approx. across 35–50 codons, previously reported as the “ramp”. (c–e) The nTE scale reveals short “dips” in individual genes such as the highly expressed hydroxylase LIA1 (c) and cell division control protein CDC48 (d), and the lowly expressed RNA polymerase II transcription factor TFB3 (e). In contrast, the cTE scale does neither reveal the “ramp” nor the “dip” in individual profiles. (f) The length of the “dip” matches approx. the distance from the peptidyltransferase center of the ribosome to a constriction site within the exit tunnel, where ribosomal proteins L4 and L17 sense nascent chains.
Figure 3
Figure 3
Site-specific evolutionary conservation of codon optimality. (a) Optimal (O) and nonoptimal (N) codons are projected onto an exemplary sequence alignment of the S. cerevisiae gene RIB5, and shown together with positional conservation scores. Significantly conserved optimal codons are indicated in blue, and nonoptimal codons in red. (b) Comparison of the distributions of random (grey histogram and black line) and observed (red line) conservation scores. Sites with higher conservation scores than expected by chance, i.e. outside the alignment-specific significance thresholds (dotted lines), are considered significantly conserved sites. (c) Fraction of analyzed ORFs that show a higher number of significantly conserved optimal and nonoptimal sites than would be expected by chance, thus can be assumed under selective pressure. (d) Distributions of significance thresholds for conserved optimal and nonoptimal codons for highly and lowly expressed genes, obtained using the nTE scale. (e) Fraction of ORFs under selective pressure computed with classical codon optimality. If perfect site-specific conservation of optimal codons can already be observed by chance, selection for the site-specific conservation of optimal codons cannot be assumed, and these cases are thus indicated as ‘not significant’. (f) Distributions of significance thresholds for conserved optimal and nonoptimal codons for highly and lowly expressed genes, obtained using the cTE scale.
Figure 4
Figure 4
Conserved codon optimality associates with signatures of co-translational folding. (a) Exemplary conservation profile of codon optimality for the gene NOP56, calculated using the nTE scale, together with the predicted protein secondary structure. Conserved optimal codons are shown in blue, conserved nonoptimal codons in red, and not significantly conserved sites in grey. (b) Associations between conserved codon optimality and predicted secondary structure for highly (left) and lowly (right) expressed genes. (c) As in (b), but for conserved optimal and nonoptimal codons that appear in clusters.
Figure 5
Figure 5
Conserved codon optimality maps onto known protein structures. (a) Associations between clusters of conserved codon optimality and secondary structures in experimentally determined protein structures. (b) Associations between codon optimality as defined in cTE, and secondary structures in experimental PDB structures. All associations for nonoptimal codons are lost. (c) Secondary structure representations, colored according to the conservation of nonoptimal (red) and optimal (blue) codons, of the exemplary Myosin light chain 1 (top, PDB structure: 1M45_A) and 20S proteasome subunit (bottom, 1RYP_G). (d) A distinct and positional pattern of optimal and nonoptimal codons characterizes α-helices in S. cerevisiae. Positions 1 and 4 are strongly enriched in optimal codons, while the transition into the helix as well as positions 2 and 3 show a clear preference for nonoptimal codons
Figure 6
Figure 6
Optimal and nonoptimal codons in protein synthesis and co-translational folding. Optimal codons are translated faster and more accurately, while nonoptimal codons can induce translational pausing. Evolutionarily conserved optimal codons are found predominantly at sites where translational accuracy is important to prevent aggregation. Evolutionarily conserved nonoptimal codons are found preferentially in secondary structure elements that can fold co-translationally, even already inside the ribosomal exit tunnel.

References

    1. Gingold H, Pilpel Y. Determinants of translation efficiency and accuracy. Mol Syst Biol. 2011;7:481. - PMC - PubMed
    1. Akashi H. Synonymous codon usage in Drosophila melanogaster: natural selection and translational accuracy. Genetics. 1994;136:927–935. - PMC - PubMed
    1. Drummond DA, Wilke CO. Mistranslation-induced protein misfolding as a dominant constraint on coding-sequence evolution. Cell. 2008;134:341–352. - PMC - PubMed
    1. Cabrita LD, Dobson CM, Christodoulou J. Protein folding on the ribosome. Curr Opin Struct Biol. 2010;20:33–45. - PubMed
    1. Thanaraj TA, Argos P. Ribosome-mediated translational pause and protein domain organization. Protein Sci. 1996;5:1594–612. - PMC - PubMed

Publication types