. 2013 Mar 1;187(5):543-51.
doi: 10.1164/rccm.201207-1217OC. Epub 2012 Dec 21.

Is passive diagnosis enough? The impact of subclinical disease on diagnostic strategies for tuberculosis

Affiliations

Is passive diagnosis enough? The impact of subclinical disease on diagnostic strategies for tuberculosis

David W Dowdy et al. Am J Respir Crit Care Med. .

Abstract

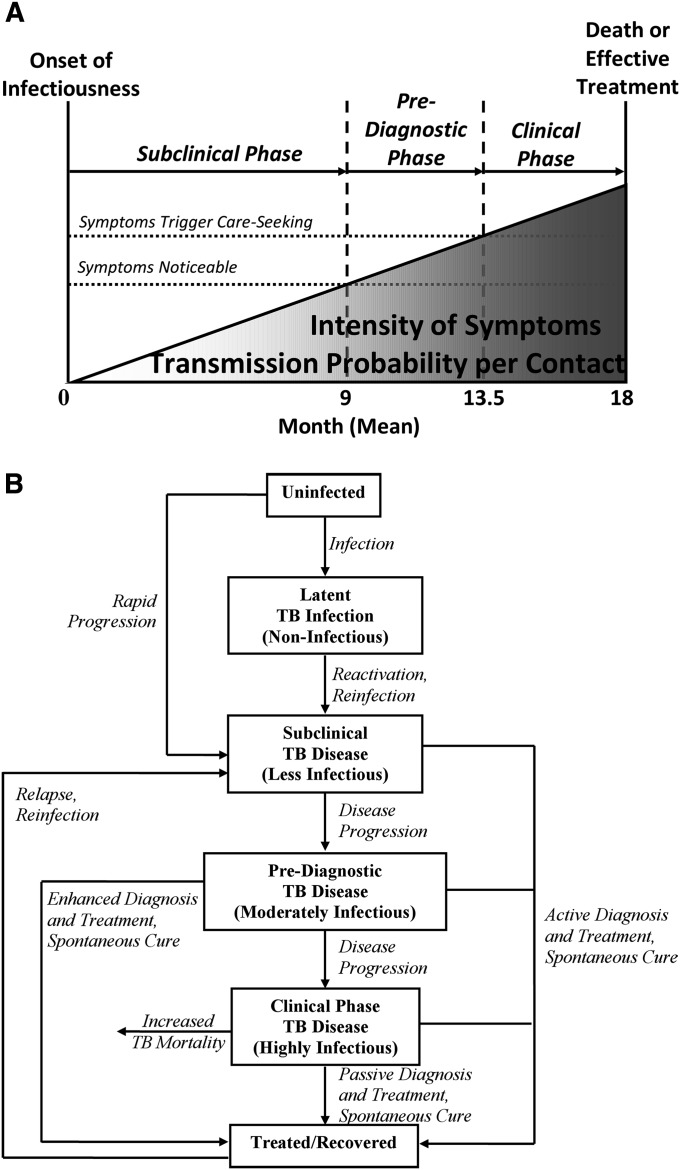
Rationale: Tuberculosis (TB) is characterized by a subclinical phase (symptoms absent or not considered abnormal); prediagnostic phase (symptoms noticed but diagnosis not pursued); and clinical phase (care actively sought). Diagnostic capacity during these phases is limited.

Objectives: To estimate the population-level impact of TB case-finding strategies in the presence of subclinical and prediagnostic disease.

Methods: We created a mathematical epidemic model of TB, calibrated to global incidence. We then introduced three prototypical diagnostic interventions: increased sensitivity of diagnosis in the clinical phase by 20% ("passive"); early diagnosis during the prediagnostic phase at a rate of 10% per year ("enhanced"); and population-based diagnosis of 5% of undiagnosed prevalent cases per year ("active").

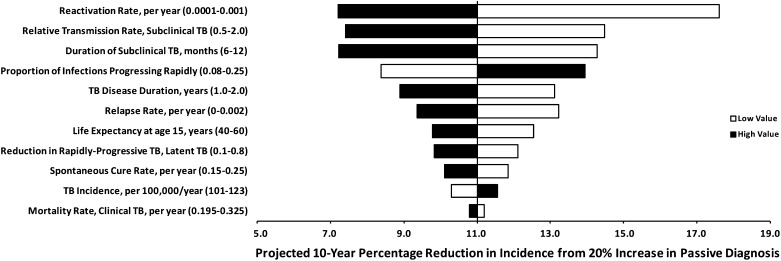
Measurements and main results: If the subclinical phase was ignored, as in most models, the passive strategy was projected to reduce TB incidence by 18% (90% uncertainty range [UR], 11-32%) by year 10, compared with 23% (90% UR, 14-35%) for the enhanced strategy and 18% (90% UR, 11-28%) for the active strategy. After incorporating a subclinical phase into the model, consistent with population-based prevalence surveys, the active strategy still reduced 10-year TB incidence by 16% (90% UR, 11-28%), but the passive and enhanced strategies' impact was attenuated to 11% (90% UR, 8-25%) and 6% (90% UR, 4-13%), respectively. The degree of attenuation depended strongly on the transmission rate during the subclinical phase.

Conclusions: Subclinical disease may limit the impact of current diagnostic strategies for TB. Active detection of undiagnosed prevalent cases may achieve greater population-level TB control than increasing passive case detection.


Figures

Figure 1.
Figure 1.
Subclinical, prediagnostic, and clinical periods in tuberculosis (TB). Mycobacterium tuberculosis can be cultured from the sputum of individuals before the onset of noticeable symptoms, which in turn occurs before those people seek diagnosis. During this time, the lung bacillary burden, an important determinant of symptom intensity and per-contact transmission probability, increases. (The linear plane is not intended to imply that this increase is necessarily linear.) The subclinical phase lasts from the onset of infectiousness (for which we take the ability to culture M. tuberculosis as a proxy) to the onset of noticeable symptoms (i.e., the presence of which patients would affirm if asked). The prediagnostic phase lasts from the onset of noticeable symptoms to the point at which those symptoms begin to trigger diagnostic attempts. (A) Clinical progression. (B) Compartmental model.
Figure 2.
Figure 2.
Tuberculosis transmission rate as a function of time. Although the infectious burden (probability of successful infection per contact) likely increases with time over the course of disease, the rate of transmission (infectious burden × susceptible contact rate) may peak during the subclinical, prediagnostic, or clinical phases. (A) Cases of tuberculosis infect all susceptible close contacts (e.g., household members) early in their disease course, such that the transmission rate peaks during the subclinical phase. (B) The effective contact rate remains constant, such that the transmission rate increases throughout the disease course. (C) The effective contact rate decreases slowly over time as individuals infect close contacts, reduce mobility, and take simple measures (e.g., covering cough with hands) to prevent transmission. The primary model described in the text assumes equal mean rates of transmission in the subclinical, prediagnostic, and diagnostic periods (without specifying the shape of the transmission curves). (D) One such formulation is shown.
Figure 3.
Figure 3.
Epidemiologic impact of diagnostic strategies, assuming different subclinical and prediagnostic phases. Graphs show the reduction in tuberculosis (TB) incidence at the end of 10 years, relative to continuation of current trajectories, after increasing the rate of symptom-driven diagnosis by 20% (passive, diamonds), diagnosing 10% of all individuals with prediagnostic TB per year (enhanced, squares), and diagnosing 5% of all prevalent cases in the population per year (active, triangles). Vertical lines denote the baseline scenario (subclinical phase of 9 mo, prediagnostic phase of 4.5 mo, and clinical phase of 4.5 mo). For every 1-month increase in the subclinical phase, A and B assume a 1-month decrease in the clinical phase, whereas the prediagnostic phase remains constant. C and D assume that both the prediagnostic and clinical phases decrease by 0.5 month. In E and F, a 1-month increase in the prediagnostic phase results in a 1-month decrease in the clinical phase. A, C, and E assume that the TB transmission rate in the subclinical phase is 25% of that in the prediagnostic and clinical phases. B, D, and F assume that transmission is constant throughout (i.e., the primary analysis).
Figure 4.
Figure 4.
One-way sensitivity analysis: epidemiologic impact of improved passive diagnosis. Bars represent the 10-year percentage reduction in incidence after improving passive case detection and treatment by a factor of 20% under the baseline scenario (subclinical phase 9 mo; prediagnostic phase 4.5 mo; clinical phase 4.5 mo), with the vertical line at 11% reduction representing the reference scenario in Table 2. Solid bars denote variation of the corresponding parameter to its high value in Table 1, open bars to the low value. Parameters to which the model is most sensitive appear at the top of the diagram. The corresponding analysis for enhanced diagnosis is similar in the rank-ordering of parameters’ importance; active diagnosis is less sensitive to the duration or relative transmission rate of subclinical tuberculosis (TB).
Figure 5.
Figure 5.
Multivariable sensitivity analysis. Partial rank correlation coefficients (shown on the x axis) describe the degree of correlation between the corresponding parameter and 10-year reduction in tuberculosis (TB) incidence for passive (top), enhanced (middle), and active (bottom) diagnostic strategies after adjustment for the effects of other parameters in the model. Larger bars (i.e., parameters appearing at the top of each diagram) suggest that the outcome is more sensitive to the corresponding parameter value. Open bars correspond to those parameters that describe the subclinical infectious phase.

References

    1. Stop TB. Partnership. The global plan to stop TB, 2011–2015. Transforming the fight: towards elimination of tuberculosis. Geneva: World Health Organization; 2011.
    1. Dye C, Garnett GP, Sleeman K, Williams BG. Prospects for worldwide tuberculosis control under the WHO DOTS strategy. Lancet 1998;352:1886–1891 - PubMed
    1. Komatsu R, Korenromp EL, Low-Beer D, Watt C, Dye C, Steketee RW, Nahlen BL, Lyerla R, Garcia-Calleja JM, Cutler J, et al. Lives saved by Global Fund-supported HIV/AIDS, tuberculosis and malaria programs: estimation approach and results between 2003 and end-2007. BMC Infect Dis 2010;10:109. - PMC - PubMed
    1. World Health Organization. Global tuberculosis control: WHO report 2011. Geneva: WHO Press; 2011.
    1. Boehme CC, Nabeta P, Hillemann D, Nicol MP, Shenai S, Krapp F, Allen J, Tahirli R, Blakemore R, Rustomjee R. Rapid molecular detection of tuberculosis and rifampin resistance. N Engl J Med 2010;363:1005–1015 - PMC - PubMed

Publication types