. 2013 Jan 31;493(7434):684-8.
doi: 10.1038/nature11738. Epub 2012 Dec 23.

Visualization of splenic marginal zone B-cell shuttling and follicular B-cell egress

Affiliations

Visualization of splenic marginal zone B-cell shuttling and follicular B-cell egress

Tal I Arnon et al. Nature. .

Abstract

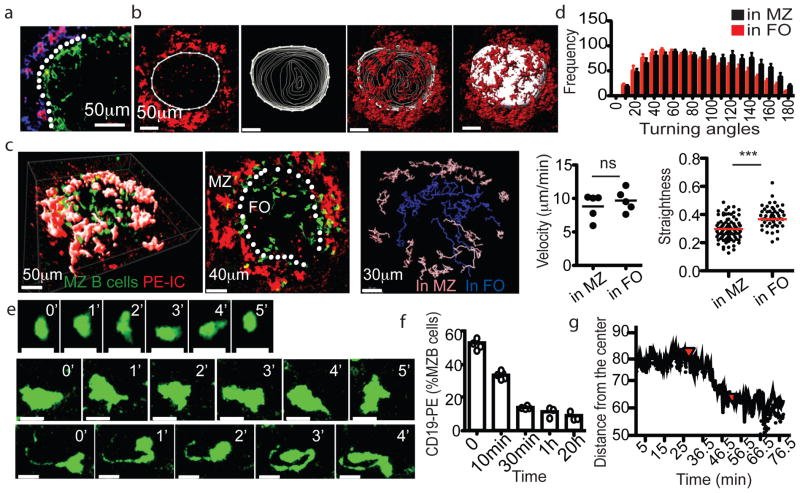
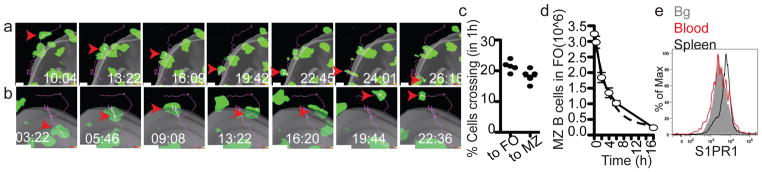
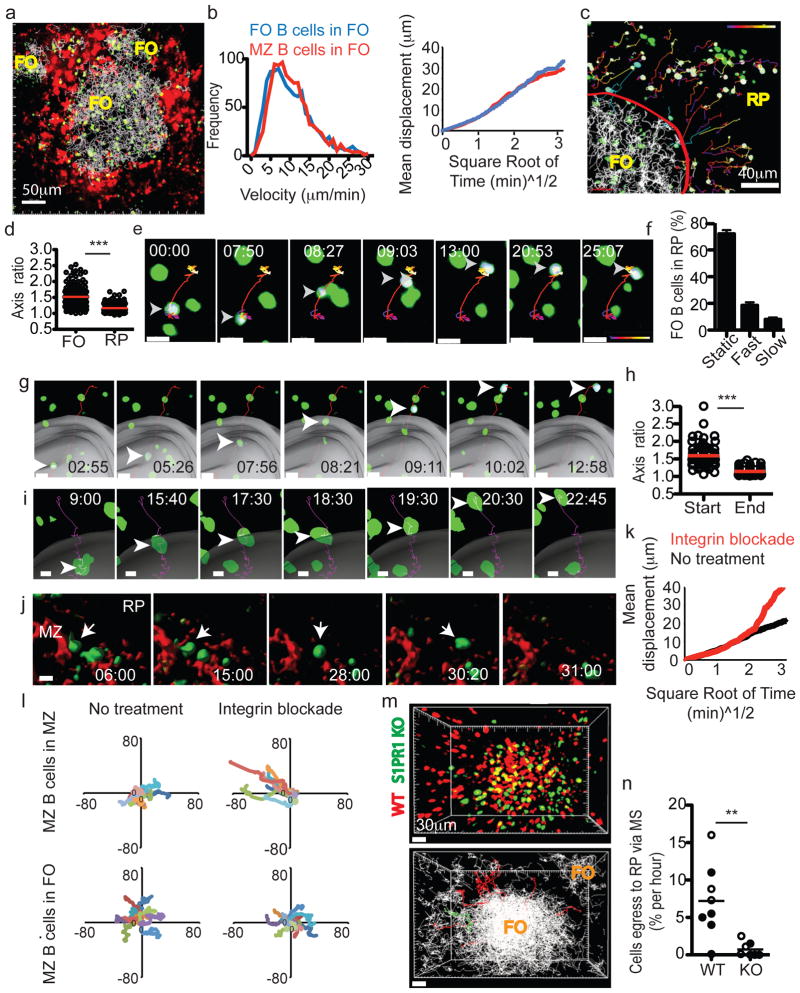
The splenic marginal zone is a unique microenvironment where resident immune cells are exposed to the open blood circulation. Even though it has an important role in responses against blood-borne antigens, lymphocyte migration in the marginal zone has not been intravitally visualized due to challenges associated with achieving adequate imaging depth in this abdominal organ. Here we develop a two-photon microscopy procedure to study marginal zone and follicular B-cell movement in the live mouse spleen. We show that marginal zone B cells are highly motile and exhibit long membrane extensions. Marginal zone B cells shuttle between the marginal zone and follicles with at least one-fifth of the cells exchanging between compartments per hour, a behaviour that explains their ability to deliver antigens rapidly from the open blood circulation to the secluded follicles. Follicular B cells also transit from follicles to the marginal zone, but unlike marginal zone B cells, they fail to undergo integrin-mediated adhesion, become caught in fluid flow and are carried into the red pulp. Follicular B-cell egress via the marginal zone is sphingosine-1-phosphate receptor-1 (S1PR1)-dependent. This study shows that marginal zone B cells migrate continually between marginal zone and follicles and establishes the marginal zone as a site of S1PR1-dependent B-cell exit from follicles. The results also show how adhesive differences of similar cells critically influence their behaviour in the same microenvironment.


Figures

Figure 1
Figure 1. Adoptive transfer system for GFP labeling MZ B cells
(a) Frequency of CD35hiCD23lo MZ B cells amongst B220+ cells in CD19−/− mice before (left) or 8 wks after (right) transfer of GFP+ B cells. (b) Phenotype of CD19+ GFP+ B cells from A. Numbers indicate % of cells in gate. (c) In vivo anti-CD19PE labeling of MZ-phenotype (CD23loCD35hi) B cells. (d) Spleen section from mouse reconstituted with 2:1 mixture of non-tg and GFP+ B cells, stained with anti-GFP (green) and DAPI (blue). Marginal sinus is indicated by the dashed white line. (e) Spleen sections from the indicated mice that had received PE-IC (red) 16hr earlier, stained for CD169 (green) and CD35 (blue).
Figure 2
Figure 2. MZ B cells are migratory and exhibit long membrane processes
(a) Figure 4. Splenic FO B cell migration and S1PR1 requirement for exit a) Spleen section showing PE-IC (red), SIGN-R1 (blue) and CD169 (green) distribution two hours after PE-IC injection. White dotted line indicates location of sinus. (b) Generation of MZ-FO boundary surface. Left image shows an example contour drawn ~10μm internal to the PE-ICs to represent the boundary in a single x–y slice (3μm). Middle images show contours drawn for each slice in the 60μm z stack. Right image shows final surface with overlaid PE-IC stain. (c) TPLSM of GFP+ MZ B cells in reconstituted CD19−/− spleen. Left panel shows a 57μm z-projection view. Middle panel shows a 30μm slice from the center of this region. Location of marginal sinus is indicated (white dotted line). Right, representative classification of MZ B cell tracks based on positioning with respect to surface. Pink, in MZ; blue, in FO. (d) Median velocity, distribution of turning angles and straightness of MZ B cells (5 data sets from 3 mice). (e) Time-lapse images of two MZ B cells (middle and bottom panels) compared with a FO B cell (top panels). All cells are GFP+. Scale bars, 10μm. (f, g) Kinetics of MZ B cell displacement into the FO following FTY720 treatment. (f) Frequency of in vivo anti-CD19-PE labeled MZ B cells at the indicated time after FTY720 injection (n=6 mice), detected by flow cytometry. (g) Average distance of GFP+ MZ B cells from the most center point over time during TPLSM imaging. Red arrow at 25 min, time of FTY720 injection. (Second red arrow, time of anesthetic reinjection). In d, c, f, bars or lines indicate means (error bars, SEM). *** p<0.0005 and ns, not significant (p>0.05) by unpaired Student’s t-test.
Figure 3
Figure 3. MZ B cells migrate bidirectionally between MZ and FO
(a) MZ B cell crossing from MZ into FO. (b) MZ B cell migrating from FO to MZ. Grey surface represents MZ-FO interface. Time lapse is in min:sec. Arrowheads point to cell location at each time point and line indicates tracked path of cell. (c) MZ B cells shuttling rate (5 data sets from 3 mice). (d) Decay rate of MZ B cells from the FO following integrin blockade. The number of MZ B cells remaining in the FO was determined at each time point, showing a decay rate of 23% per hour (1 representative experiment out of 3). (e) Flow cytometric analysis of S1PR1 on MZ B cells in spleen (blue line) or after 1hr exposure to blood (red line). Bg, background.
Figure 4
Figure 4. Splenic FO B cell migration and S1PR1 requirement for exit
(a) 54μm z-projection view showing transferred FO B cells (green) and their tracks (white lines) and PE-IC-labeled macrophages (red). (b) Instantaneous velocities (left) and displacement versus square root of time (right) of FO and MZ B cells in the FO. Data from at 5–6 experiments (3–4 mice). (c) 45μm z-projection view of FO B cells (green) in FO and red pulp (RP). Red line, MZ-FO border; white lines, tracks of FO B cells in FO; time-coded colored lines, FO B cells in RP; blue lines, FO B cells in transition from FO to MZ. Cells tracked outside the FO are highlighted with a white surface. (d) Axis ratio of FO B cells in FO and RP. (e) FO B cell movement in the RP. (f) Percentage of cells in RP exhibiting stationary (‘Static’), rapid (‘Fast’) or migratory (‘Slow’) behavior (5 experiments in 3 mice, n= 550 cells). (g) FO B cell crossing from FO to MZ. Grey surface, MZ–FO interface. (h) Axis ratio of FO B cells migrating from FO to MZ at start and end of track (n= 24 cells). (i–l) Intravital TPLSM of MZ B cells following integrin blockade. (i) MZ B cell crossing from FO to MZ. (j) MZ B cell movement from MZ to RP. (k) Displacement versus square root of time (right) of MZ B cells in the MZ before (black) and two hours after (red) integrin blockade. (l) Superimposed 10-min tracks of randomly selected MZ B cells, in the x–y plane. Units are in micrometers. Data for I–L were from 8 experiments (3 mice). (m) Upper, 90μm z-projection view of WT (red) and S1PR1 KO (green) FO B cells in spleen. Lower, automated tracks of transferred B cells (white). Tracks of WT cells (11 red lines) and KO cells (1 green line) leaving FO are shown. (n) FO egress rate of WT and S1PR1 KO B cells. Open circles, MZ–FO interface determined based on PE-IC labeling; filled circles, interface determined based on FO B cell tracks. In e, g, I, j, elapsed time is in min:sec, arrowheads point to tracked cells and scale bar indicates 10μm. In f, h, n, bars or lines represent mean (error bars in f, ±SEM).

References

    1. Schmidt EE, MacDonald IC, Groom AC. Comparative aspects of splenic microcirculatory pathways in mammals: the region bordering the white pulp. Scanning Microsc. 1993;7:613–628. - PubMed
    1. Mebius RE, Kraal G. Structure and function of the spleen. Nat Rev Immunol. 2005;5:606–616. - PubMed
    1. Martin F, Kearney JF. Marginal-zone B cells. Nat Rev Immunol. 2002;2:323–335. - PubMed
    1. Pillai S, Cariappa A. The follicular versus marginal zone B lymphocyte cell fate decision. Nature Reviews Immunology. 2009;9:767–777. - PubMed
    1. MacLennan ICM, Gray D, Kumararatne DS, Bazin H. The lymphocytes of splenic marginal zones: a distinct B-cell lineage. Immunol Today. 1982;3:305–307. - PubMed

Publication types

MeSH terms