. 2013 Feb;15(2):189-200.
doi: 10.1038/ncb2663. Epub 2012 Dec 23.

Loss of Par3 promotes breast cancer metastasis by compromising cell-cell cohesion

Affiliations

Loss of Par3 promotes breast cancer metastasis by compromising cell-cell cohesion

Bin Xue et al. Nat Cell Biol. 2013 Feb.

Abstract

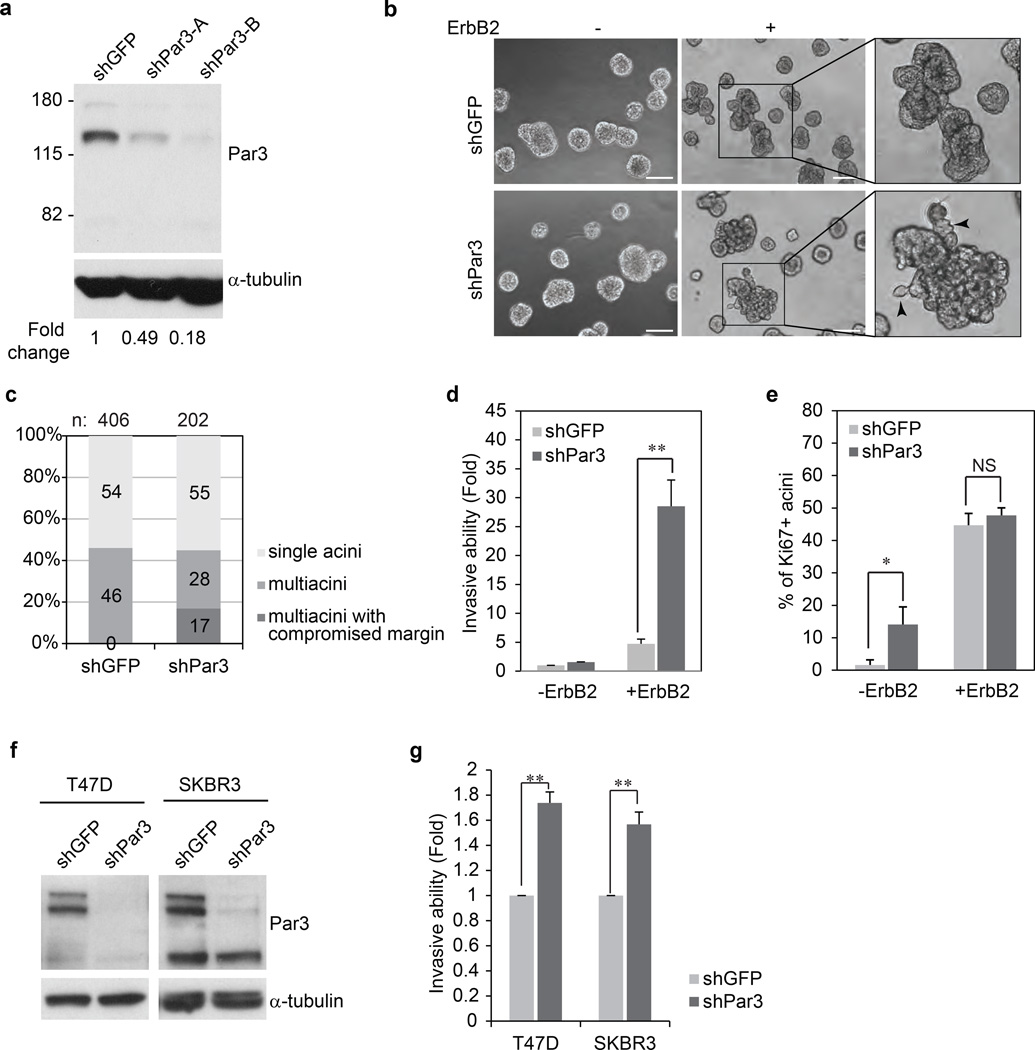
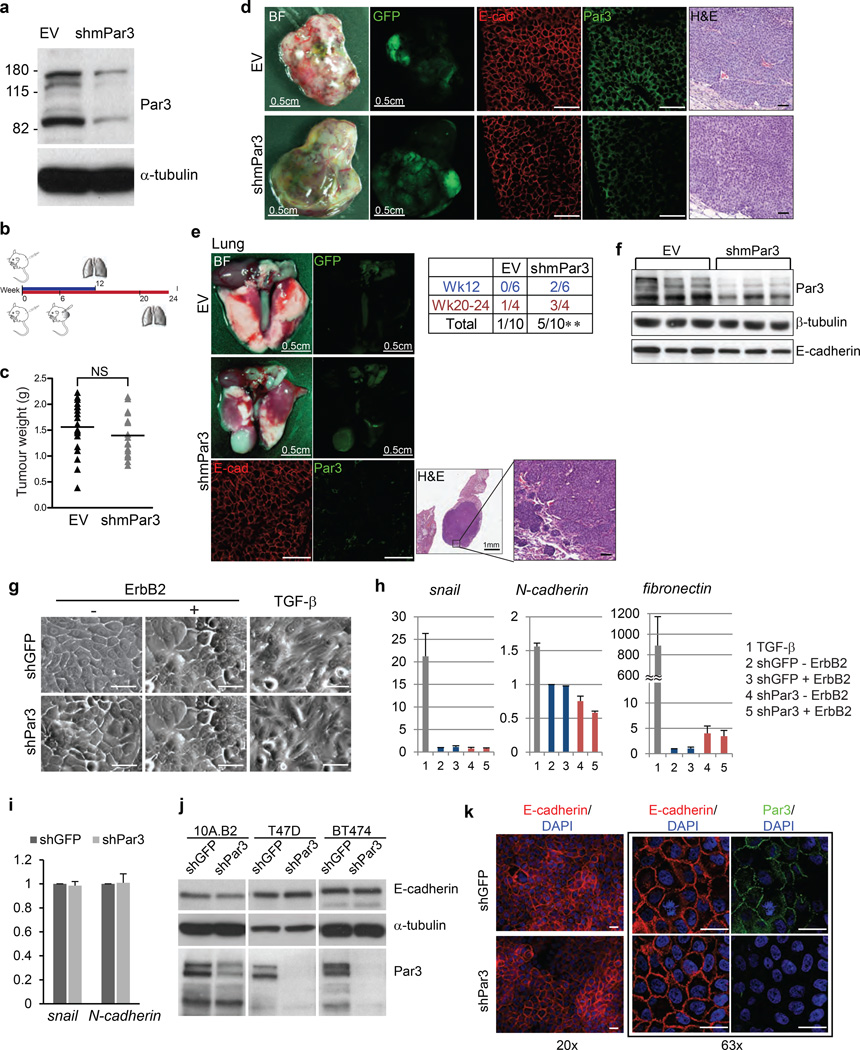
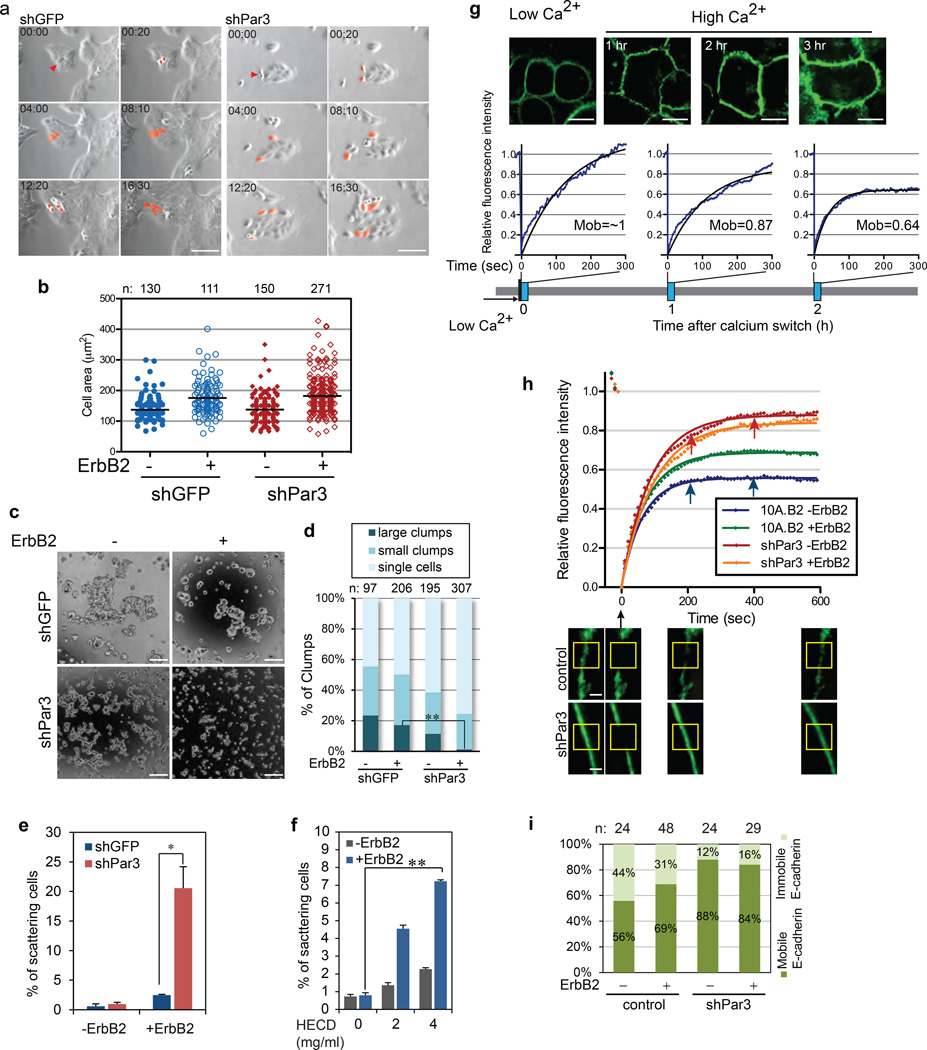
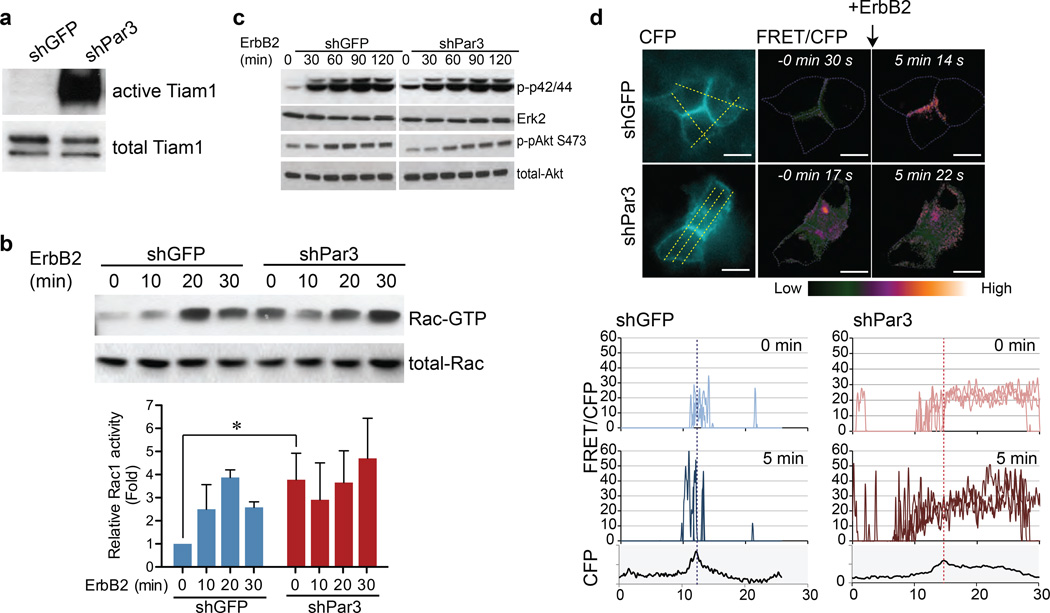
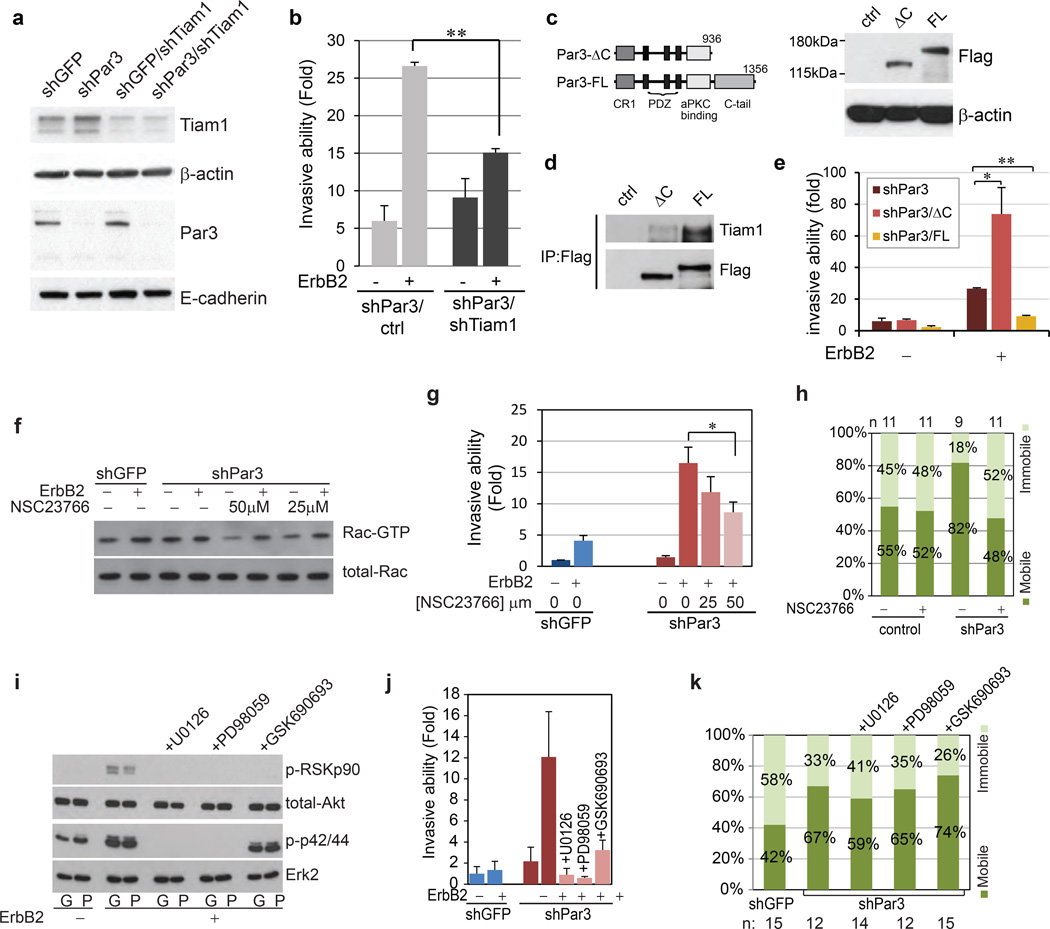
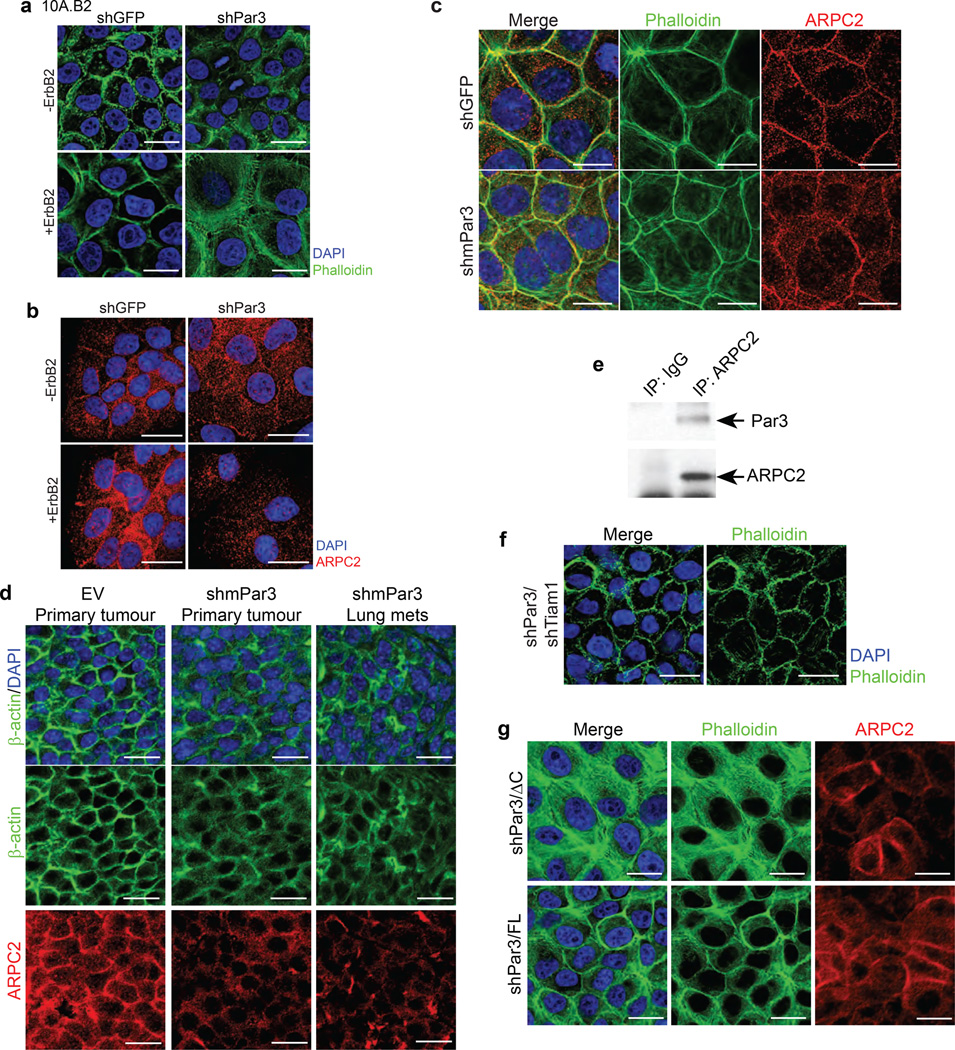
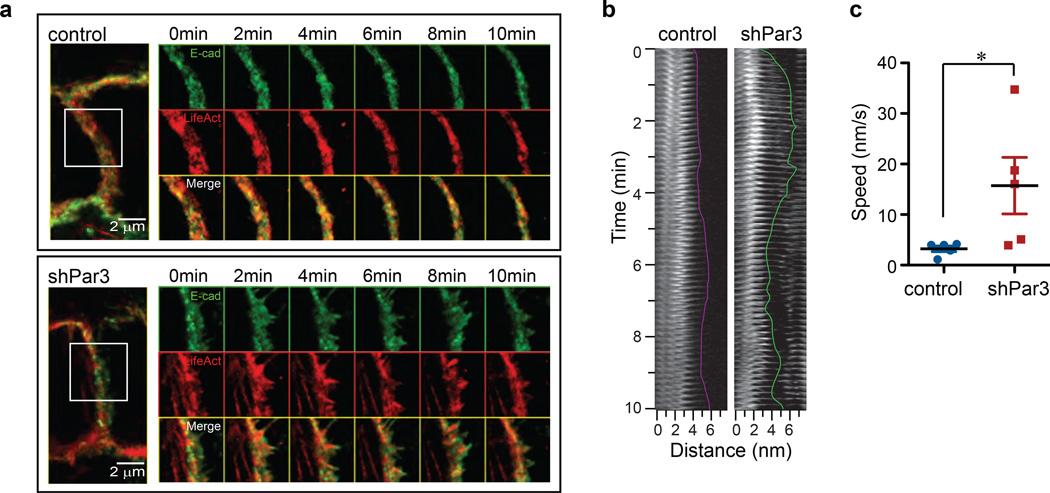
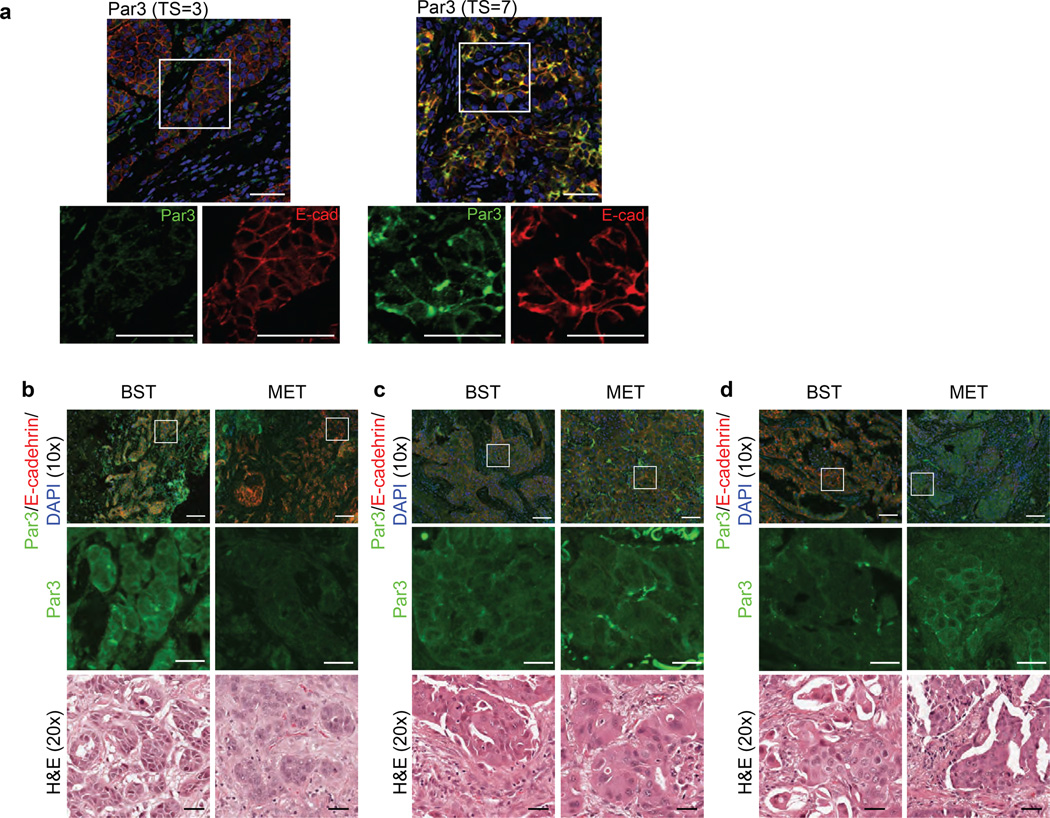
The mechanisms by which tumour cells metastasize and the role that cell polarity proteins play in this process are not well understood. We report that partitioning defective protein 3 (Par3) is dysregulated in metastasis in human breast cancer, and is associated with a higher tumour grade and ErbB2-positive status. Downregulation of Par3 cooperated with ErbB2 to induce cell invasion and metastasis in vivo. Interestingly, the metastatic behaviour was not associated with an overt mesenchymal phenotype. However, loss of Par3 inhibited E-cadherin junction stability, disrupted membrane and actin dynamics at cell-cell junctions and decreased cell-cell cohesion in a manner dependent on the Tiam1/Rac-GTP pathway. Inhibition of this pathway restored E-cadherin junction stability and blocked invasive behaviour of cells lacking Par3, suggesting that loss of Par3 promotes metastatic behaviour of ErbB2-induced tumour epithelial cells by decreasing cell-cell cohesion.


Figures

Figure 1
Figure 1. Loss of Par3 cooperates with ErbB2 to induce invasive behaviour in mammary epithelial cells
(a) Par3 protein level in 10A.B2 cells expressing GFP shRNA and two shRNAs targeting Par3. (b) Phase contrast images of day 12 acinar structures unstimulated (−) or stimulated (+) with dimerizer AP1510, a small molecule ligand to activate ErbB2, for four days. Right panels show a higher magnification of the multiacinar structures. Arrows point to the protrusions from the multiacinar. (Scale bar = 100 µm) (c) ErbB2 activated acini were classified according to their microscopic morphology. Multiacinar structures were identified as those having three or more acinar structures and those with invasive protrusions were categorized as those with compromised margin. Percentages were determined by scoring 406 acini for shGFP and 2002 for shPar3. (d) 10A.B2 cells stably expressing shGFP or shPar3 were seeded for transwell invasion assays, with or without activation of ErbB2 and incubated for 48 hours. Results are represented as fold change in invasion compared to shGFP cells without ErbB2 stimulation. The data are presented as mean ± SEM collected from three independent experiments; +ErbB2 **P=007 by Student’s t-test. (e) Percentage of Ki67 positive acini. Day 16 acini from 10A.B2 shGFP, 10A.B2 shPar3 cells were grown with or without ErbB2 stimulation for 4 days and immunostained for Ki67. The data are presented as mean ± SEM collected from four independent experiments, −ErbB2 *P=0.069, +ErbB2 P=0.510 by Student’s t-test. (NS) (f) Lysates from shGFP or shPar3 T47D and SKBR3 cells were analysed for Par3 protein levels. (g) T47D and SKBR3 cells were seeded for transwell invasion assays and incubated for 24 hours and 72 hours respectively. Invaded cells were quantified represented as fold change in invasion compared to shGFP cells. The data are presented as mean ± SEM collected from three independent experiments; T47D **P=0.002, SKBR3 **P=0.009 by Student’s t-test.
Figure 2
Figure 2. Downregulation of Par3 promotes metastasis without EMT
(a) Validation of shRNA against mouse Par3 (shmPar3) in mouse mammary epithelial Comma1-D cells by immunoblot. (b) Schematic illustration of the transplantation experiment. (c) Weight of tumours grown from MMTV/NDL empty vector (EV) or mPar3 shRNA (shmPar3) transplantation at week12. The solid lines represent the mean value. n=18 (EV) and 17 (shmPar3). P=0.290 (NS) by unpaired t-test. Bright field and GFP images of (d) primary tumours collected 12 weeks after transplantation or (e) the representative lungs collected 24 weeks after transplantation are shown. Tissue sections from the primary tumours or the lung metastasis in shmPar3 transplantation or primary tumours were stained with immunoflorescent labels against E-cadherin and Par3 or H&E. (Scale bar = 50 µm) (e) The incidence of lung metastasis is shown in the table. EV P=0.341 (NS), shmPar3 **P=0.008 by one sample t-test with test value=0. (f) Cell lysates from primary tumours grown from transplantation were analysed for Par3 and E-cadherin and β-tubulin was served as loading control by immunoblot. (g) Phase contrast images of 10A.B2 cells untreated or treated with ErbB2 dimerizer or TGF-β (5.0 ng/ml) for four days. (Scale bar = 100 µm) (h) Expression of mesenchymal markers in 10A.B2 cells was determined by quantitative PCR using primers against snail, N-cadherin and fibronectin. The data were normalized to β-actin mRNA levels, TGF-β stimulation was used as positive control. The data were presented as mean ± SEM collected from three independent experiments. (i) mRNA from T47D cells was examined for snail and N-cadherin levels by quantitative PCR. The data were normalized to β-actin and fold changes are shown as mean ± SEM collected from 3 independent experiments. (j) Protein lysates from shGFP or shPar3 10A.B2, T47D and BT474 cells were analysed for changes in E-cadherin protein levels. (k) Confluent 10A.B2 cells were immunostained for E-cadherin and the nuclei. Boxed images show the immunostaining for Par3 and E-cadherin at higher magnification. (Scale bar = 20 µm)
Figure 3
Figure 3. Loss of Par3 weakens cell-cell adhesions and inhibits E-cadherin junction stability
(a) 10A.B2 cells were grown on plastic dishes with ErbB2 stimulation and imaged every 10 minutes for 18 hours. Still snapshots are shown. In 00:00 images, the red arrows point to a mother cell. In subsequent images, the red colour tracks the progeny of the mother cells. (Scale bar = 100 µm) (b) Cell spreading assay with 10A.B2 cells. The graph shows the scatter plot of the cell area. The solid lines represent the mean value. (c) 10A.B2 cells were cultured in hanging drops as indicated for 20 hours, and then imaged by phase contrast microscopy. Representative images from each condition are shown. (Scale bar = 100 µm) (d) The clump size was measured and categorized into single cell, small clumps (2~10 cells) and large clumps (more than 10 cells). The percentage of clumps was presented as a bar graph on the right. **P=0.0045 by Student’s t-test. (e) Quantification of cell scattering of 10A.B2 shGFP or shPar3 cells grown on plastic dishes, without (−) or with (+) ErbB2 stimulation for 24 hours. A cell was scored as a scattered cell if it lost contact with its neighbours. Results are presented as mean ± SEM from three independent experiments. (f) Quantification of cell scattering of 10A.B2 cells grown in the presence of HECD-1 or control mIgG for 24 hour. (n=3, mean ± SEM). (g) Confluent monolayer of control or shPar3 10A.B2 cells expressing E-cadherin-GFP were incubated in low calcium medium for four hours and switched to high calcium medium. FRAP analysis was performed at indicated time points. The black lines indicate best fitting curves of nonlinear regression analysis. E-cadherin mobility was calculated from the fitting curves. Sample size n=8, 9 and 8 respectively. (Scale bar = 10 µm) (h) FRAP was conducted on control and shPar3 cells expressing E-cadherin-GFP. The bottom panel shows the representative confocal sections of the cells before and after various time points after photobleaching. The yellow-boxes mark the bleached regions. (Scale bar = 2 µm) (i) Quantification of E-cadherin immobile and mobile fractions from Fig 3g. Sample sizes are shown above the graph.
Figure 4
Figure 4. Loss of Par3 induces aberrant activation of Tiam1-Rac signalling
(a) Cell lysates from shGFP or shPar3 10A.B2 cells were subjected to Tiam1 Rac-GEF activity assay. The level of active Tiam1 pulled down by Rac1 G15A agarose beads (upper panel) and total Tiam1 (lower panel) were monitored by immunoblotting with Tiam1 antibody. (b) Cell lysates, from confluent monolayers stimulated with ErbB2 dimerizer for indicated times, were incubated with GST-PAK1 agarose beads and bound active Rac (Rac-GTP) was monitored by immunoblotting with anti-Rac antibody. Total Rac levels were monitored using one tenth of the input lysate. Quantification of relative levels of Rac-GTP of three independent experiments is shown in the graph below (mean ± SEM). (c) Cell lysates from confluent monolayers stimulated with ErbB2 for indicated time were analysed for phospho-p42/44, total Erk2, phospho-Akt S473 and total Akt levels by immunoblot analysis. (d) Confluent 10A.B2 cells expressing Raichu-Rac were treated with ErbB2 dimerizer. CFP and FRET images were obtained before stimulation and five minutes after stimulation. Representative FRET/CFP ratio images after background subtraction are shown. The ratio is represented by LUT colours from green to orange. All images were normalized using the same threshold and ratio range. The CFP donor images are shown on the left. (Scale bar = 20 µm)The change in Rac activity was presented by plotting the histogram of the indicated lines across the cells (yellow lines) in the normalized ratio pixel images. The dotted vertical lines in the graphs represent the cell-cell junction determined by the maximum CFP intensity.
Figure 5
Figure 5. Contribution of Tiam1-Rac and ErbB2 signalling to Par3 loss-induced phenotype
(a) Immunoblot of Tiam1 level in 10A.B2 shGFP or shPar3 cells expressing shRNA targeting Tiam1. (b) 10A.B2 shPar3 cells expressing control vector or shTiam1 were subjected to transwell invasion assays as indicated. Invaded cells were quantified and presented as fold change compared to shGFP cells without ErbB2 stimulation. Data are shown as mean ± SEM collected from three independent experiments;. **P=0.001 by Student’s t-test. (c) Left Panel: Schematic representation of Par3 full length (FL) and ΔC constructs used in this study. Abbreviation: CR1, conserved region 1. Right Panel: Cell lysates from 10A.B2 shPar3 expressing RNAi-resistant Flag-tagged Par3-FL and Par3-ΔC were immunoblotted using antibody against Flag. (d) Lysates from cells expressing control vector, Flag-Par3-FL or Flag-Par3-ΔC were immunoprecipitated with anti-Flag antibody and immunoblotted for Tiam1. (e) shPar3 cells expressing control vector, Flag-Par3-FL or Flag-Par3-ΔC, without or with ErbB2 stimulation, were subjected to transwell invasion assay. (mean ± SEM from 3 independent experiments. Student’s t-test: *P=0.08, **P<4.15E-05) (f) Cell lysates from 10A.B2 cells stimulated with ErbB2 dimerizer for 15 minutes in the absence (−) or presence (+) of two different concentrations of NSC23766 were subjected to Rac activity assay. (g) 10A.B2 shGFP or shPar3 cells were were subjected to transwell invasion assay as described above. The Rac inhibitor, NSC23766, was added at the indicated concentrations at the same time as ErbB2 activation. (mean ± SEM from 3 independent experiments, Student’s t-test: *P=0.051). (h) FRAP analysis was conducted on the E-cadherin-GFP expressing 10A.B2 cells in the absence or presence of 50 µM NSC23766 compound. The E-cadherin immobile and mobile fractions were calculated and plotted. Sample sizes are listed above the graph. (i) Cell lysates form shGFP (G) or shPar3 (P) cells stimulated with ErbB2 dimerizer for 30 minutes in the absence or presence of 1 µM U0126, 50 µM PD98056 or 300 nM GSK690693 were analysed for phospho-RSKp90, total-Akt, phospho-p42/44 and total Erk2 by Western blot. The cells treated with inhibitors were subjected to (j) transwell invasion assay (mean ± SEM, n=3) and (k) E-cadherin FRAP analysis (sample sizes are listed below the graph) as described above.
Figure 6
Figure 6. Loss of Par3 induces changes in actin organization and mislocalizes Arp2/3 complex
Confluent monolayers of 10A.B2 cells expressing shGFP or shPar3, without or with ErbB2 activation, were (a) stained with phalloidin for F-actin (green) and nuclei (DAPI, blue), or (b) immunostained with ARPC2 (red). (c) Eph4 mammary epithelial cells expressing shGFP or shmPar3 were stained with phalloidin for actin cytoskeleton (green) and immunostained for ARPC2 (red). (d) Tissue sections of tumours generated using MMTV-NDL tumour cells infected with vector or mPar3 RNAi lentivirus were immunostained for actin cytoskeleton (β-actin, green) or ARPC2 (red). (e) Cell lysates from confluent monolayers of 10A.B2 cells were immunoprecipitated using anti-ARPC2 and immunoblotted as indicated. Rabbit IgG was used as non-specific control in the experiments. (f) shPar3 10A.B2 cells expressing Tiam1 shRNA were stained with phalloidin for actin cytoskeleton. (g) shPar3 10A.B2 cells expressing Par3-FL and Par3-ΔC were stained with phalloidin for actin cytoskeleton (green) and immunostained for ARPC2 (red). (Scale bar = 20 µm above)
Figure 7
Figure 7. Loss of Par3 introduces changes in actin and E-cadherin dynamics at cell-cell junctions
(a) Confluent monolayers of control and shPar3 10A.B2 cells stably co-expressing E-cadherin-GFP and TagRFP-Lifeact were imaged every 5 seconds for 10 minutes. Representative images of cell-cell junctions are shown. The right panels show time-lapse montages at 2 minute intervals of an area delineated by a white box in the cell-cell junction images in the left panel. (b) Kymograph of a representative region of TagRFP-Lifeact at the cell-cell junction in control cells (left) or shPar3 cells (right). (c) The mean speed of five protrusions was measured from kymographs and shown in the graph. *P=0.056 by Student’s t-test .
Figure 8
Figure 8. Dysregulation of Par3 in human breast cancer
(a) IHC for Par3 protein expression representing a low (Total Score, TS=3) and high (TS=7) Allred score (Par3: green, E-cadherin: red, nuclei: DAPI). The lower panels represent a zoomed image of the samples. (Scale bar = 50 µm) (b), (c) and (d) Primary human breast tumours (BST) and matched metastasis (MET) were immunostained for Par3 (green) and E-cadherin (red). (Scale bar = 100 µm) Middle inserts are zoomed images of the boxed region. Bottom inserts correspond to H&E stained images of the tumour or metastasis. (Scale bar = 20 µm) (b) shows the representative pair in which the metastasis has a decrease in the level of membrane Par3 expression compared to the matched primary tumour. (c) shows the representative pair in which Par3 protein expression is at the same level in BST and MET. (d) shows the representative pair in which the metastasis has an decrease in the level of membrane Par3 expression compared to the matched primary tumour.

References

    1. Gomes JE, Bowerman B. Caenorhabditis elegans par genes. Curr Biol. 2002;12:R444. - PubMed
    1. Kirby C, Kusch M, Kemphues K. Mutations in the par genes of Caenorhabditis elegans affect cytoplasmic reorganization during the first cell cycle. Dev Biol. 1990;142:203–215. - PubMed
    1. Debnath J, Muthuswamy SK, Brugge JS. Morphogenesis and oncogenesis of MCF-10A mammary epithelial acini grown in three-dimensional basement membrane cultures. Methods. 2003;30:256–268. - PubMed
    1. Suzuki A, Ohno S. The PAR-aPKC system: lessons in polarity. J Cell Sci. 2006;119:979–987. - PubMed
    1. Mellman I, Nelson WJ. Coordinated protein sorting, targeting and distribution in polarized cells. Nat Rev Mol Cell Biol. 2008;9:833–845. - PMC - PubMed

Publication types

MeSH terms