. 2013 Jan;15(1):17-27.
doi: 10.1038/ncb2646.

An integrin-ILK-microtubule network orients cell polarity and lumen formation in glandular epithelium

Affiliations

An integrin-ILK-microtubule network orients cell polarity and lumen formation in glandular epithelium

Nasreen Akhtar et al. Nat Cell Biol. 2013 Jan.

Abstract

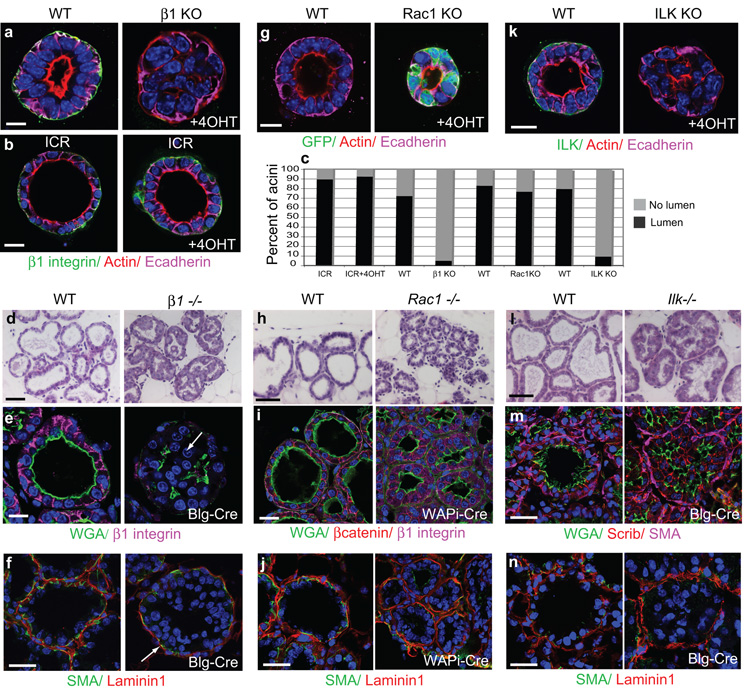
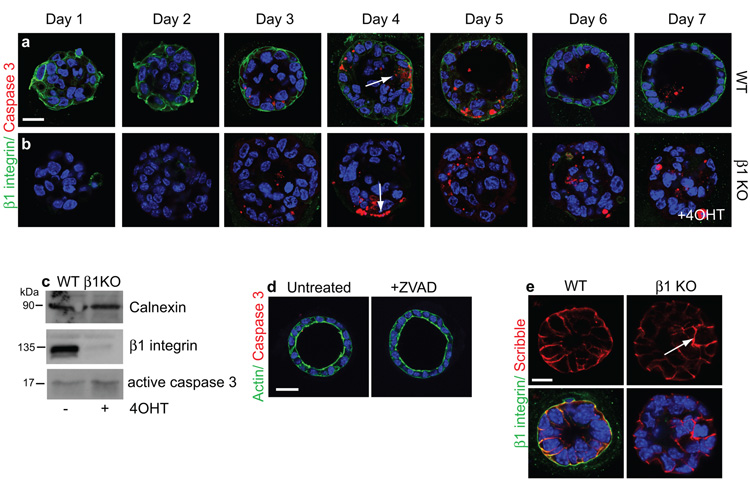
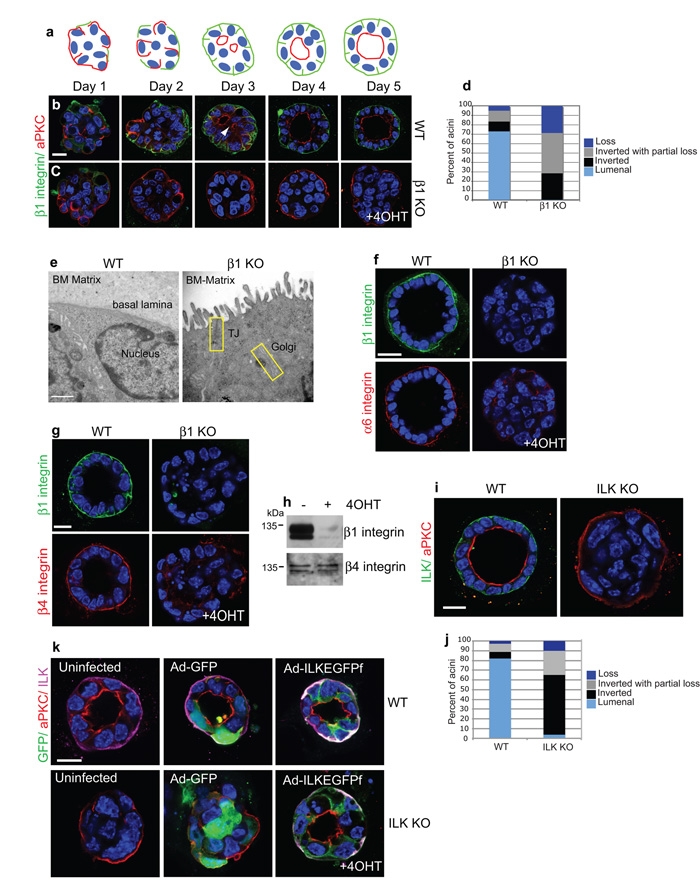
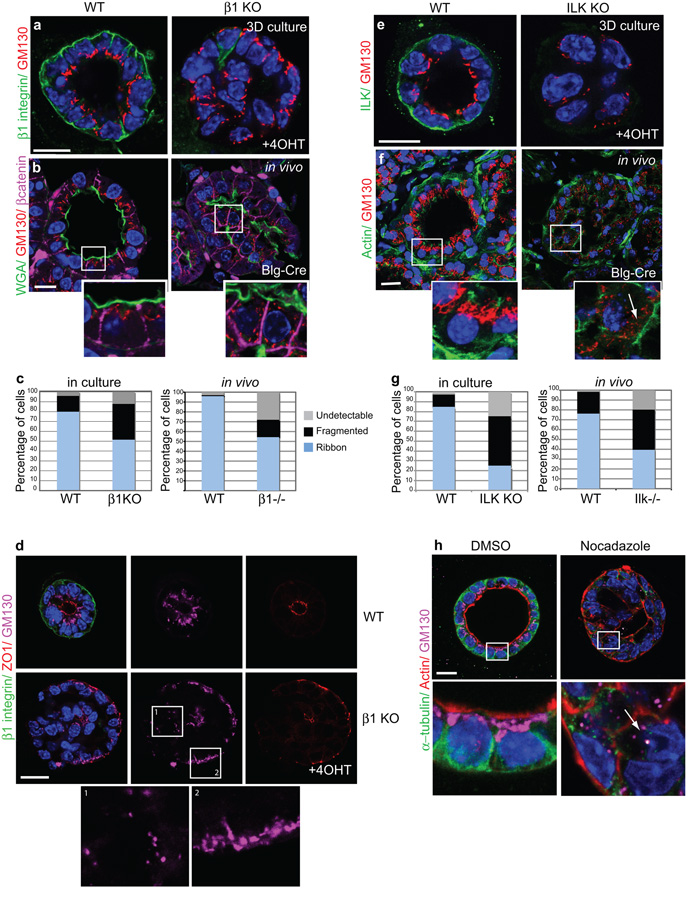
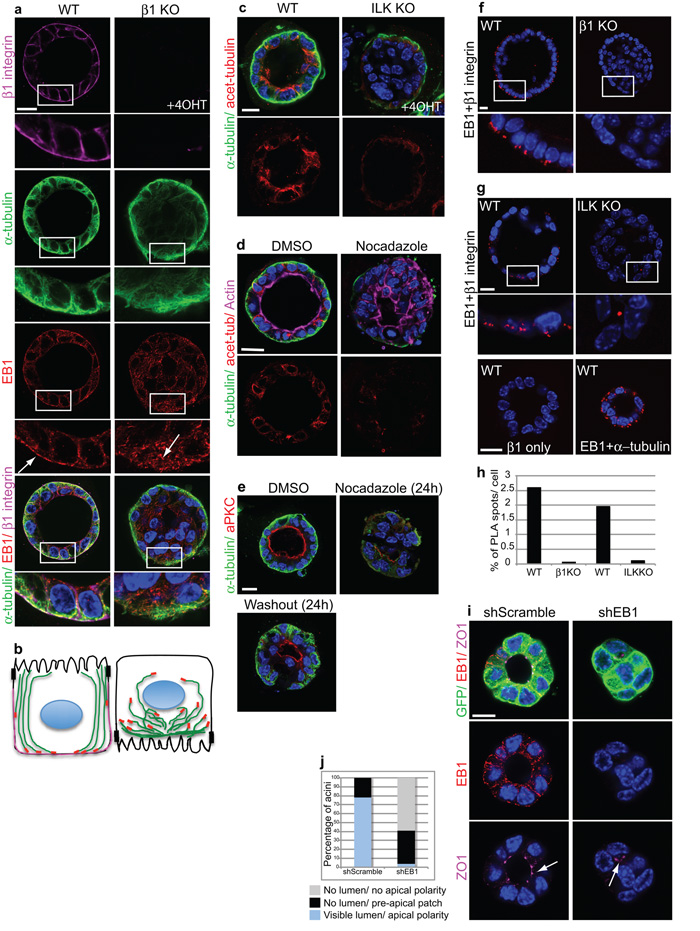
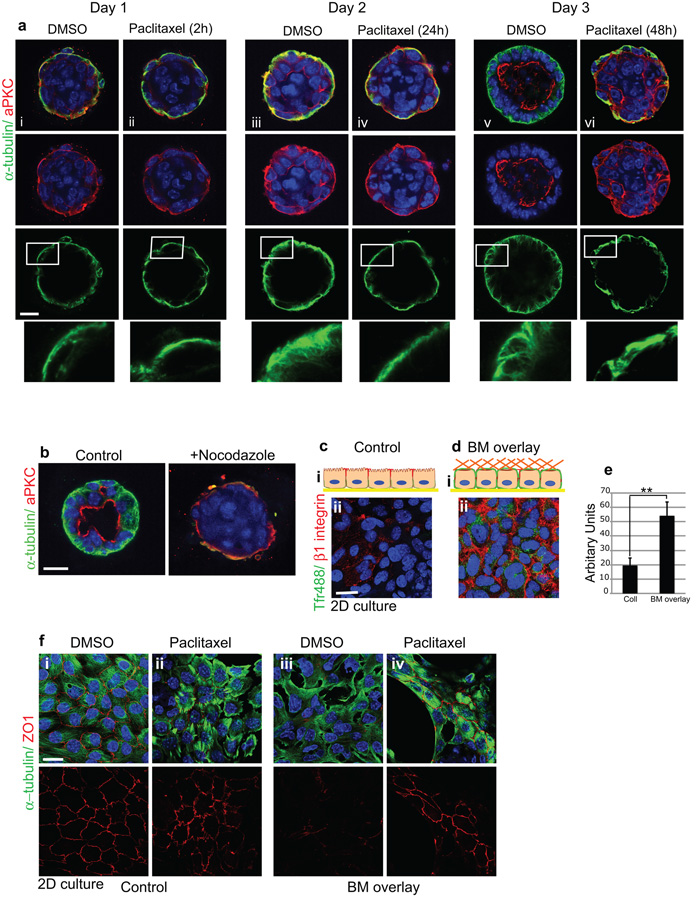
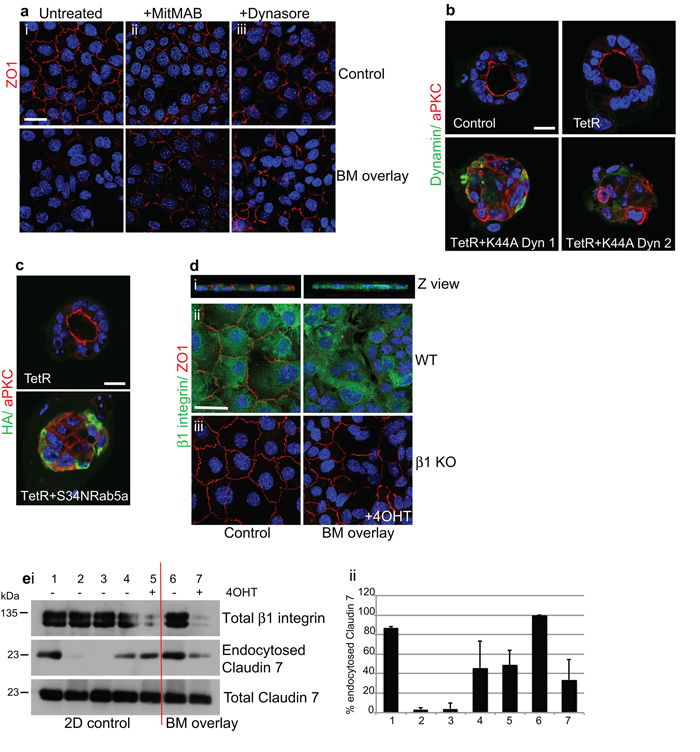
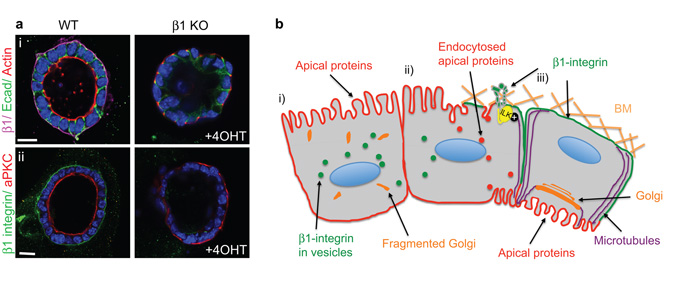
The extracellular matrix has a crucial role in determining the spatial orientation of epithelial polarity and the formation of lumens in glandular tissues; however, the underlying mechanisms remain elusive. By using Cre–Lox deletion we show that β1 integrins are required for normal mammary gland morphogenesis and lumen formation, both in vivo and in a three-dimensional primary culture model in which epithelial cells directly contact a basement membrane. Downstream of basement membrane β1 integrins, Rac1 is not involved; however, ILK is needed to polarize microtubule plus ends at the basolateral membrane and disrupting each of these components prevents lumen formation. The integrin–microtubule axis is necessary for the endocytic removal of apical proteins from the basement-membrane–cell interface and for internal Golgi positioning. We propose that this integrin signalling network controls the delivery of apical components to the correct surface and thereby governs the orientation of polarity and development of lumens.


Figures

Figure 1
Figure 1. Deletion of β1-integrins or ILK disrupts acinar morphogenesis
(a) Immunofluorescence staining of MECs isolated from β1fx/fx;CreER™ mice and cultured in 3D on BM-matrix. 4OHT added at the time of plating cells, caused β1-integrin deletion and absence of lumens. Bar: 10μm. (b) No lumen disruption in acini from non-transgenic ICR mice, treated with 4OHT. Bar: 10μm. (c) Quantification of ICR, β1-KO, Rac1-KO, ILK-KO acini with lumens, n=100 for each condition, 3 independent experiments. (d) H+E staining of lactation day 2 (L2) mammary glands isolated from β1−/− mice (β1fx/fx;Blg- Cre) and their WT littermates (β1fx/fx ). Bar: 40 μm. (e) L2 WT and β1−/− glands, immuno-stained for β1-integrin, and WGA to detect apical surfaces and lumens. Note that cells protrude into the luminal space of β1−/− glands. Bar: 15 μm. (g) Immunofluorescence staining of MECs isolated from Rac1fx/fx:LSLYFP:CreER™ mice and cultured in 3D on BM-matrix. 4OHT added at the time of plating cells, caused Rac1 deletion but no lumen loss. Bar: 10 μm. (h) H+E staining of L2 mammary glands isolated from Rac1−/− mice (Rac1fx/fx:LSLYFP:WAPi- Cre) and their WT littermates (Rac1fx/fx ). Bar: 40μm (i) L2 WT and Rac1−/− glands, immuno-stained for β1-integrin, βcatenin and WGA-488 to detect basolateral and apical surfaces, respectfully. Bar: 30μm. (k) Immunofluorescence staining of MECs from Ilkfx/fx:CreER™ mice and cultured in 3D on BM-matrix. 4OHT added at the time of plating cells, caused ILK deletion and lumen loss. Bar: 10μm. (l) H+E staining of L8 mammary glands from Ilk−/− mice (Ilkfx/fx:Blg-Cre) and their WT littermates (Ilkfx/fx ). Note the activation of the Blg-Cre promotor is asynchronous in vivo, thus some lumens may already exist before the Ilk gene was ablated. Bar: 40μm. (m) L8 WT and Ilk−/− glands, immuno-stained for Scribble, Smooth muscle actin (SMA) to detect myoepithelia, and WGA to detect apical surfaces and lumens. Bar: 20μm. (f, j, n) β1−/−, Rac1−/− and Ilk−/− glands respectively, stained for SMA and Laminin1. Note Laminin1 assembly around the acini of all transgenic glands. Bar: 20μm. In this and subsequent figures: a) WT refers to in vivo acini from β1/ ILK/ Rac1fx/fx;Cre-ve mice or cultured acini from β1/ ILK/ Rac1fx/fx;CreER™ MECs with no 4OHT treatment; b) in IF studies, nuclei were detected with Hoechst; c) confocal images of cultured 3D acini were taken through their centres. See also Supplementary Figs. 1, 2.
Figure 2
Figure 2. Luminal filling is not due to a lack of apoptosis
(a, b) Time course of lumen development over 7 days in WT and β1-KO acini, treated with 4OHT at time of plating. Cells expressing caspase 3 (arrows) were not restricted to the centre of acini. Bar: 10μm. (c) Immunoblotting shows loss of β1-integrin and a small increase in caspase 3 in 4OHT-treated cells. (d) zVAD treatment of ICR MECs did not prevent lumen formation. Bar: 10μm. (e) Scribble staining revealed intact intercellular adhesions in WT and β1-KO acini. Arrows indicate Scribble in internal cells. Bar: 10μm. See also Supplementary Fig. 3, 8.
Figure 3
Figure 3. Apical polarity is inverted in β-integrin and ILK-KO acini
(a,b,c) Time-course of polarity and lumen development in (b) WT and (c) β1-KO acini. Staining for aPKC shows apical polarity inversion upon integrin deletion. (a) The schematic shows redistribution of β1-integrin (green) and aPKC (red) in WT controls. Note that mammary acini become depolarized following the enzymatic digestion required to isolate them from tissue. Bar: 17 μm. (d) Histogram represents (%) of acini with either luminal or inverted polarity. Loss indicates acini with no apical polarity. (e) Electron micrographs of the outer edges of 3D acini cultured on BM-matrix. Note that β1-integrin deletion resulted in microvilli and tight junctions on the periphery next to the ECM. Bar: 500nm. (f) β1-integrin deletion in acini results in redistribution of α6 integrin from the basal cell surface. Scale bar: 10μm (g) WT and β1-KO acini stained for β1- and β4-integrin. β4-integrin redistributed from the basal domain following β1-integrin deletion. Bar: 10μm. (h) β4-integrin levels were not affected after β1-integrin deletion. (i) WT and ILK-KO acini from Ilkfx/fx:CreER™ mice. The inverted polarity phenocopied that of β1-null acini. Bar: 10μm. (j) Histogram represents (%) of Ilkfx/fx:CreER™ acini with either luminal or inverted polarity. Loss indicates acini with no apical polarity. (k) WT or ILK-KO MECs infected with Ad-GFP or Ad-ILKEGFPf and plated onto 3D BM-matrix. Only the Ad-ILKEGFPf expression rescued polarity and lumens (89% of acini). Bar: 10μm. See also Supplementary Fig. 4, 8, Movies S1 and S2
Figure 4
Figure 4. β1 integrins and ILK control internal Golgi polarity
(a) WT and β1-KO cultured acini, stained for β1-integrin and GM130. (b) WT and β1−/− in vivo acini, stained for WGA488, GM130 and β-catenin. Note the repositioning or fragmentation of Golgi following β1-integrin deletion. Bar: 15μm. (c) Histograms represents average Golgi positioning (%) in β1fx/fx:CreER™ cultured acini or from 9 areas imaged within each β1fx/fx:Blg-Cre gland: ‘Ribbon’ Golgi are those accumulated halfway perinuclear towards the apical surface, but they are ‘Fragmented’ if localized more than half way around the nucleus. In some cells Golgi were undetectable by GM130 immunostaining and scored as ‘Undetectable’. (d) WT and β1-KO acini stained for β1-integrin, ZO1 and GM130. Note that regions of inverted polarity and no polarity are found in the same β1-KO. In these cases, ribbon Golgi distribution to peripheral edges in β1-KO acini correlates with intact apical polarity (box 2) whilst fragmented Golgi are evident in cells that have lost apical polarity (box 1). Bar: 10 μm (e,f) GM130 staining shows sub-apical Golgi in WT (e) cultured and (f) in vivo acini and fragmentation upon ILK depletion. Arrow indicates fragmented Golgi. Bar: 15μm. (g) Histogram represents average Golgi positioning (%) in Ilkfx/fx:CreER™ cultured acini or from 9 areas imaged within each Ilkfx/fx:Blg-Cre gland (as in Fig 4b). (h) ICR acini, treated with DMSO or Nocodazole (24h). Arrow indicates Golgi dispersal after MT disruption. Bar: 10μm.
Figure 5
Figure 5. β1-integrins and ILK control polarity and lumens through polarization of microtubules
(a) WT and β1-KO acini stained for α-tubulin, EB1 and β1-integrin. Integrin deletion prevented plus-end MT orientation and alignment along the apicobasal polarity axis. Bar: 10 μm. (b) Schematic of (a) showing MT orientation (green) and location of EB1 (red) and β1 integrin (magenta) in WT and β1-KO acini. (c) WT and ILK-KO acini stained for α-tubulin and acetylated α-tubulin. Bar 10μm. (d) Polarized ICR MEC acini were treated with DMSO or Nocodazole (1.5h), fixed and stained with antibodies to α-tubulin, acetylated tubulin and Alexa 647 phalloidin. Bar: 10μm. (e) Polarized ICR acini were treated with DMSO or Nocodazole (24h), then either harvested or the drug was washed out and cells cultured for a further 24 h. MT disruption depolarized acini, but polarity was rescued after the washout. Bar: 10μm. (f,g) WT and β1-KO (f), or ILK-KO (g) acini were stained with β1 integrin and EB1 antibodies, followed by proximity ligation assay (PLA) to detect complex formation between these two proteins. Each PLA spot represents a point of interaction between β1-integrin and EB1. Note in the absence of ILK, β1 integrin-EB1 complexes do not form. EB1 and α-tubulin were used as a positive control for interaction, showing PLA spots throughout the cells. β1-integrin alone was used as a negative control for the PLA. Bar: 10μm. (h) Histogram represents the average number (%) of PLA spots per cell within acini. (i) ShRNA lentiviral knock down of EB1 in MECs resulted in abnormal lumens. Arrow indicates a visible lumen with apical ZO1 in shScrambled acini but only a small pre-apical patch and no lumen in shEB1 acini. Bar: 7μm (j) Quantification of scrambled or EB1 knockdown acini with polarized lumens. See also Supplementary Figs. 5, 6.
Figure 6
Figure 6. Dynamic MTs are required for apical relocation of aPKC and lumen formation
(a) Time-course of polarity and lumen formation in 3D ICR acini embedded within BM-matrix and treated with paclitaxel (100 nM). Untreated acini (i, iii, v) developed apical lumens normally and MTs became orientated apico-basally. In contrast, MT stabilization (ii, iv, vi) impaired aPKC reorientation and lumen formation. Bar: 15μm. (b) Nocodazole prevents lumen formation. (ci) Schematic Z-view of polarized MECs in monolayer with apical tight junctions and basolateral integrins. (ii) Integrins are absent from top surface (extracellular domain antibody to β1; red) and apical membrane cannot internalize Tfr-488 from the media. (d) MECs overlaid with BM matrix display β1-integrins at the top (i) schematic Z-view (ii) confocal view and TfR-488 internalization from the media. Bar: 8μm. (e) Tfr488 uptake was quantified using a fluorescence plate reader. Histogram shows a single experiment representative of n=3. **p < 0.02; ***p< 0.05. (f) Confluent monolayers of ICR MECs displaying apical tight junctions (i) were treated with DMSO (i, iii) or with paclitaxel (ii, iv) for 1h prior to BM-overlay (iii, iv). BM-overlay induced ZO1 tight junction disruption in DMSO treated cells but paclitaxel treatment prevented the disruption. Bar: 8μm.
Figure 7
Figure 7. β1-integrins orient polarity via an endocytic mechanism
(a) Confocal images of monolayer ICR MECs (i) untreated or pre-treated for 1 h with (ii) MitMAB or (iii) dynasore prior to 6 h BM-overlay. Blocking dynamin prevented ZO1-internalization by the BM-overlay. Note that dynamin inhibition by itself slightly reduced apical tight junctions compared to untreated controls, possibly as a result of decreased vesicle budding from the Golgi , but no further loss occurred in response to the BM-overlay. Bar: 8μm. (b) MECs infected with adenoviruses expressing TetR alone, TetR + K44A-dynamin1 or TetR + K44A-dynamin2, then cultured in 3D on BM-matrix. DN-dynamin prevented relocation of aPKC to the internal luminal surface and polarization of acini. Note that these acini resemble day 1 of the developmental time course (cf Fig. 3a) Bar: 10μm. (c) MECs infected with adenoviruses expressing TetR alone, TetR + S34NRab5a and then cultured in 3D on BM-matrix. DN-Rab5a prevented relocation of aPKC to the internal luminal surface and polarization of acini. Bar: 10μm. (d) Left panels: confluent monolayers of WT MECs displayed apical tight junctions (ZO1) and basolateral β1-integrin. (i) Z-section (ii, iii) confocal view. Right panels: BM-overlay induced ZO1 disruption in WT but not β1-KO MECs. Confocal plan views were merged from the top and middle to show both ZO1 and nuclei. Bar: 8μm (e) Surface biotinylation of cells followed by 6 h BM-overlay then blotting of endocytosed Claudin 7. i) (1-5) Monolayer controls, (6,7) BM-overlay. (1,2) Efficiency of biotin stripping from the surface at 4°C: (1) unstripped, and (2) stripped monolayers. (3-7) To induce endocytosis, cells were switched to 37°C after biotin labelling: (3) no biotin, (4) monolayer, (5) monolayer +4OHT, (6) BM-overlay, (7) BM-overlay +4OHT. ii) ImageJ64 quantification of endocytosed Claudin7 immunoblots. Histogram represents mean values +/− s.e.m for error bars of n=3 experiments. Note that BM-overlay increased Claudin 7 endocytosis (cf 4,6), which was prevented by β1-integrin deletion (cf 6,7). See also Supplementary Figs 7, 8.
Figure 8
Figure 8. β1 integrin signalling specifies the orientation and maintenance of epithelial polarity and the formation of lumens
(a) β1-integrin was ablated in MECs after acini had polarized and developed lumens. Note the inversion of polarity detected by (i) TRITC phalloidin and (ii) aPKC. Bar: 10 μm. (b) Temporal sequence of how BM-integrin engagement remodel a neo-basolateral surface. i) Initially, cells are unpolarized with fragmented Golgi and apical markers at the membrane. ii) Engagement of β1-integrins with the BM first recruits ILK to instruct the orientation of polarity. Integrin/ILK then polarize MTs along the apico-basal axis by interacting with their plus ends followed by endocytosis of apical components from this surface. iii) Integrins/ ILK regulate internal cell polarity by positioning the Golgi apparatus sub-apically which further aids polarized trafficking to the membrane. A new apical face is established on the membrane opposing the BM, which subsequently leads to lumen formation.

References

    1. Carmosino M, Valenti G, Caplan M, Svelto M. Polarized traffic towards the cell surface: how to find the route. Biol Cell. 102:75–91. - PubMed
    1. Assemat E, Bazellieres E, Pallesi-Pocachard E, Le Bivic A, Massey-Harroche D. Polarity complex proteins. Biochim Biophys Acta. 2008;1778:614–630. - PubMed
    1. Musch A. Microtubule organization and function in epithelial cells. Traffic. 2004;5:1–9. - PubMed
    1. Rodriguez-Boulan E, Kreitzer G, Musch A. Organization of vesicular trafficking in epithelia. Nat Rev Mol Cell Biol. 2005;6:233–247. - PubMed
    1. Ojakian GK, Schwimmer R. Regulation of epithelial cell surface polarity reversal by beta 1 integrins. J Cell Sci. 1994;107(Pt 3):561–576. - PubMed

Publication types

MeSH terms