. 2013 Feb;16(2):243-50.
doi: 10.1038/nn.3287. Epub 2012 Dec 23.

Neuronal reference frames for social decisions in primate frontal cortex

Affiliations

Neuronal reference frames for social decisions in primate frontal cortex

Steve W C Chang et al. Nat Neurosci. 2013 Feb.

Abstract

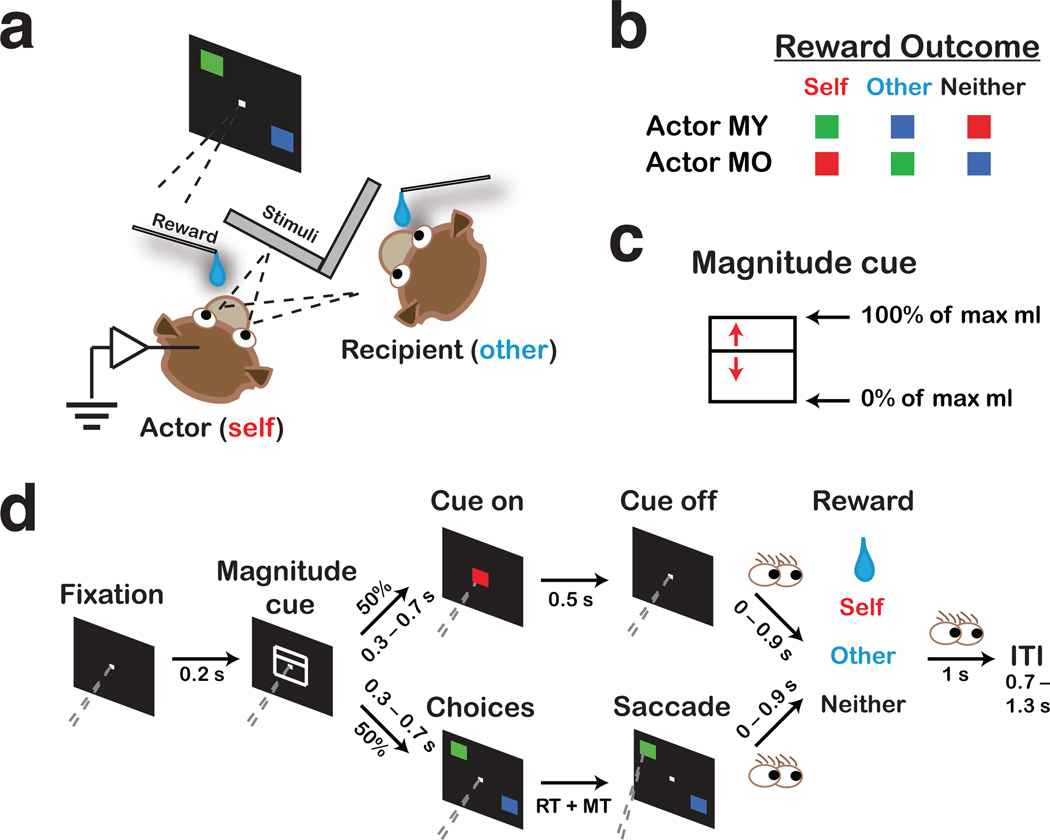
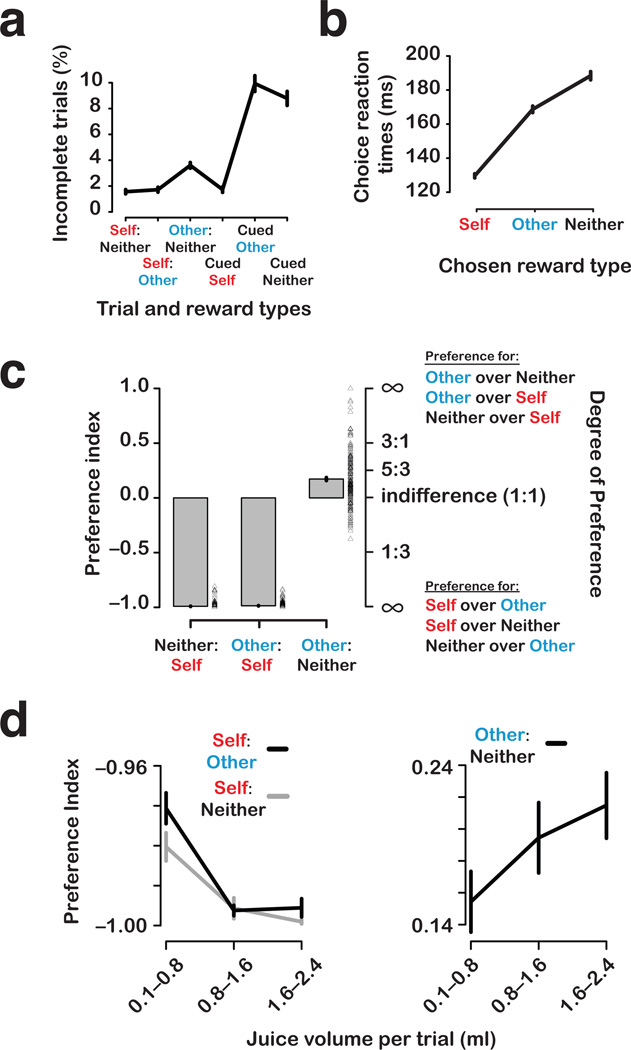
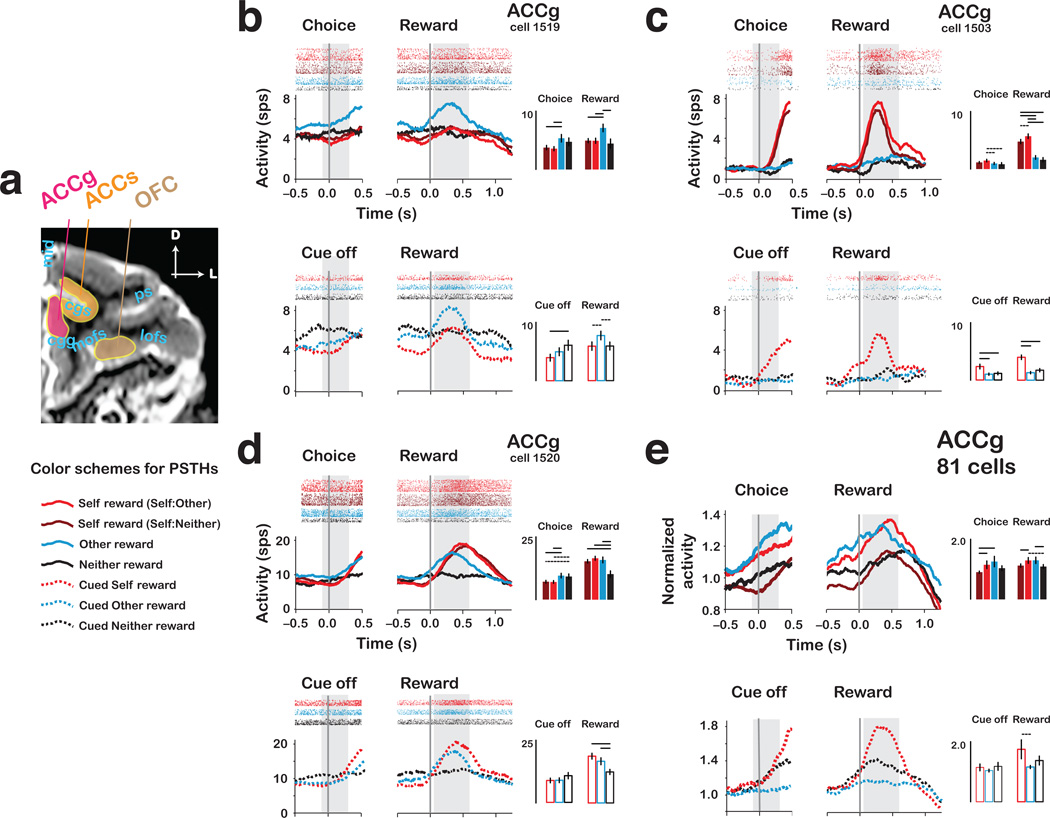
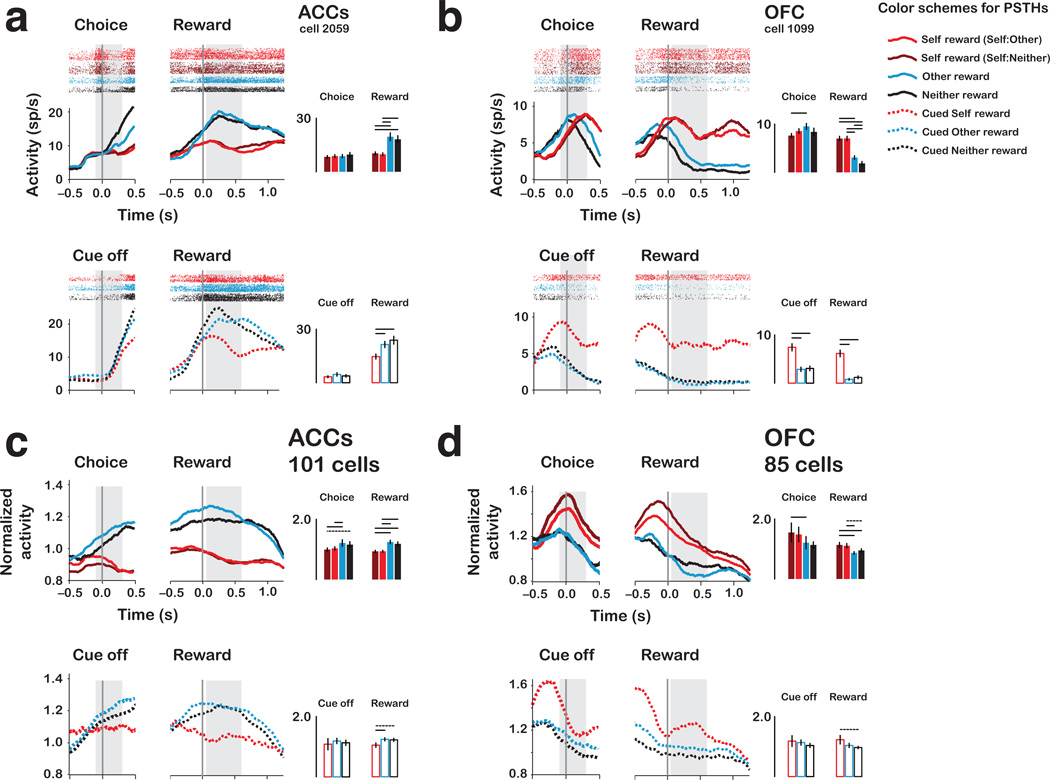
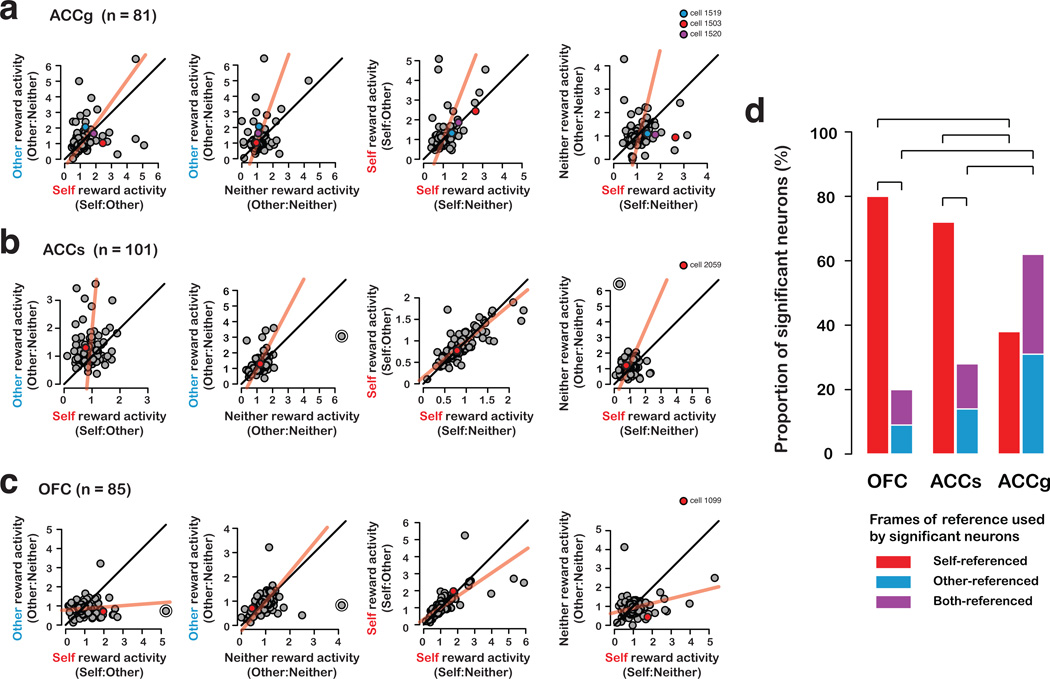
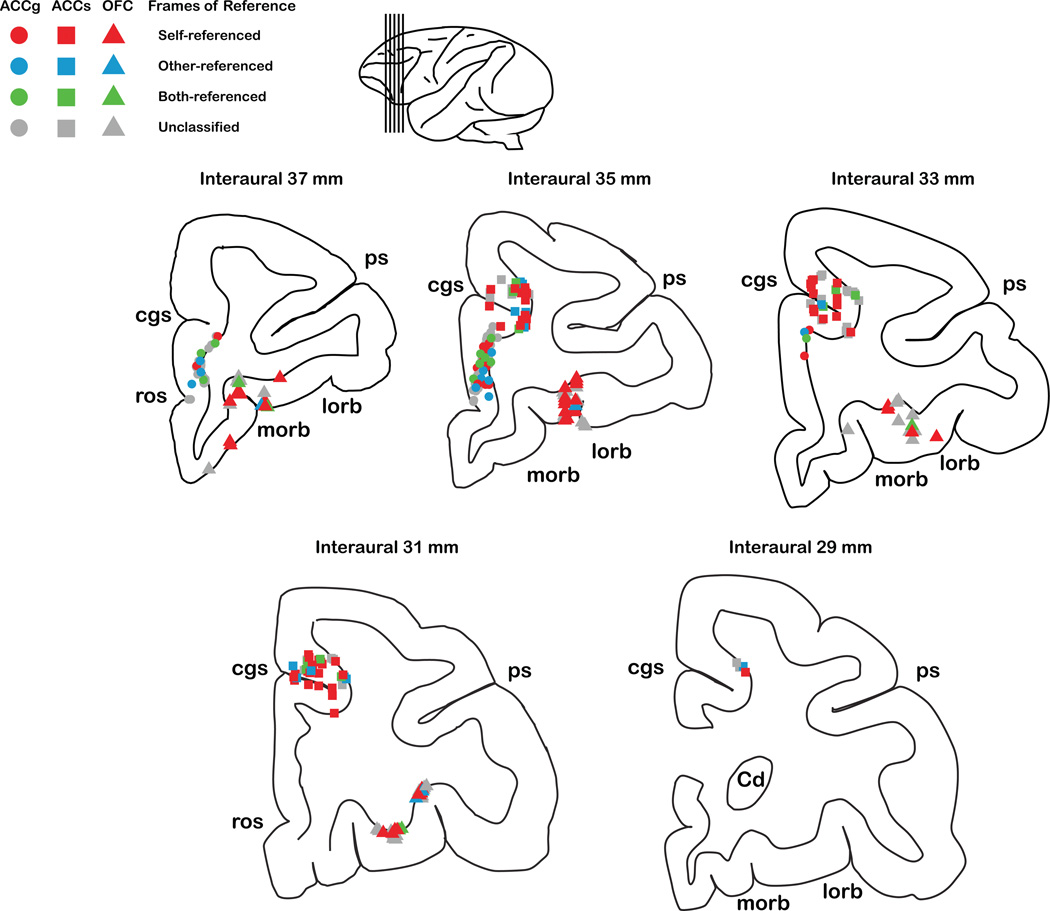
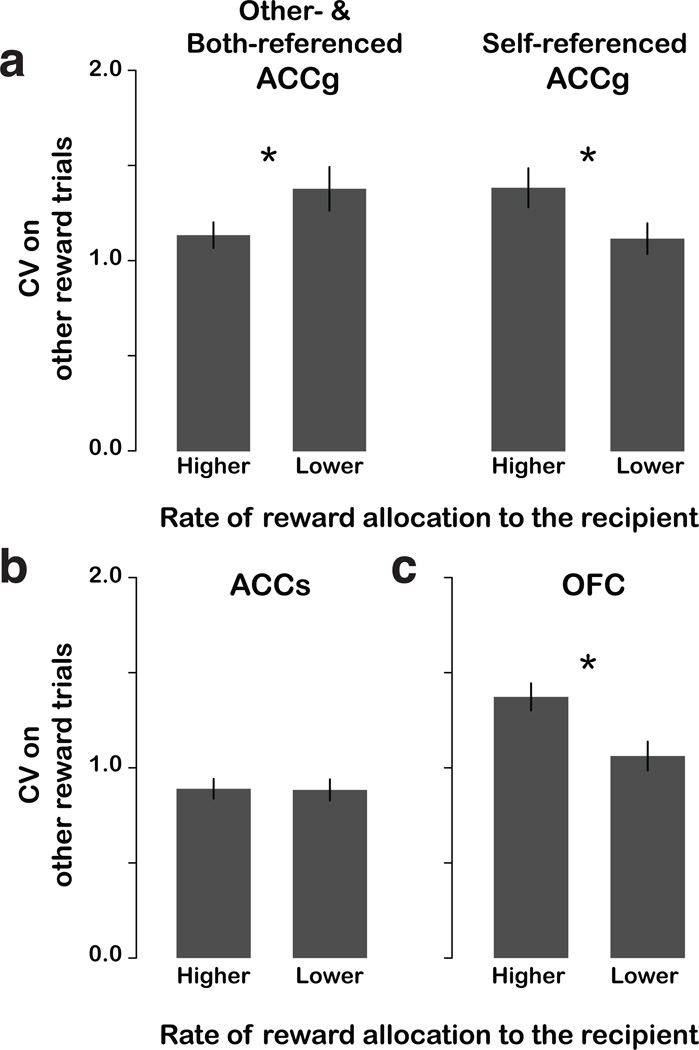
Social decisions are crucial for the success of individuals and the groups that they comprise. Group members respond vicariously to benefits obtained by others, and impairments in this capacity contribute to neuropsychiatric disorders such as autism and sociopathy. We examined the manner in which neurons in three frontal cortical areas encoded the outcomes of social decisions as monkeys performed a reward-allocation task. Neurons in the orbitofrontal cortex (OFC) predominantly encoded rewards that were delivered to oneself. Neurons in the anterior cingulate gyrus (ACCg) encoded reward allocations to the other monkey, to oneself or to both. Neurons in the anterior cingulate sulcus (ACCs) signaled reward allocations to the other monkey or to no one. In this network of received (OFC) and foregone (ACCs) reward signaling, ACCg emerged as an important nexus for the computation of shared experience and social reward. Individual and species-specific variations in social decision-making might result from the relative activation and influence of these areas.


Figures

Figure 1
Figure 1
Reward-allocation task. (a) Experimental setup for an actor and a recipient monkey. (b) Stimulus-reward outcome mappings for reward delivered to actor (self), recipient (other), or no one (neither), shown separately for each actor. (c) Magnitude cue used to indicate juice amount at stake for each trial (see d). Position of the horizontal bisecting line specified the percentage of maximum reward possible. (d) Task structure (see Online Methods). Top fork, cued trials; bottom fork, choice trials. Dashed gray lines show the angle of the actor’s gaze, converging on the fixation point. Eye cartoons indicate times when the actor could look around. RT, reaction time. MT, movement time. ITI, inter-trial interval.
Figure 2
Figure 2
Behavior in the reward-allocation task. (a) Proportions of incomplete trials (mean ± s.e.m.) (see Online Methods) during the reward-allocation task. (b) Choice reaction times (ms) from trials in which rewards were chosen for self, other, or neither (mean of session medians ± s.e.m). (c) Choice preferences (preference index, mean ± s.e.m.) as a function of reward outcome contrasts. Data points next to each bar show means for individual sessions. The degree of preference axis on the right shows the range of preference indices in ratio terms. (d) Choice preferences (mean ± s.e.m.) as a function of reward magnitude on 219 single-unit sessions collected with the magnitude cue.
Figure 3
Figure 3
Single neurons and population responses from ACCg. (a) Structural magnetic resonance image from actor MO, with example electrode paths for ACCg, ACCs and OFC. (Also see Fig. 6.) (b) Mean responses (peri-stimulus time histograms [PSTHs]) and spike rasters for an other-reward preferring ACCg neuron, on choice trials (upper, solid traces) and cued trials (lower, dashed traces). Data are aligned to choice/cue offset (left) and reward onset (right) for each reward outcome. Bar histograms on right show mean ± s.e.m. activity from the two epochs (grey regions). Color codes for PSTH traces and histograms shown below. (c) PSTHs and spike rasters for a self-reward preferring ACCg neuron. (d) PSTHs and spike rasters for a shared self and other reward preferring ACCg neuron. (e) Normalized choice/cue epoch and reward epoch responses for 81 ACCg neurons. c–e, same format as in b. In all bar histogram insets, the horizontal lines above different conditions indicate significance differences (solid, P < 0.05 by paired t-test; dashed, P < 0.05 by bootstrap test).
Figure 4
Figure 4
Single neurons and population responses from ACCs and OFC. (a) PSTHs and spike rasters for a single ACCs neuron preferring forgone rewards. Data are aligned to choice/cue offset (left) and reward onset (right) for each reward outcome. Bar histograms on right show mean ± s.e.m. activity from the two epochs (grey regions). (b) PSTHs and spike rasters for a single OFC neuron preferring self reward. (c) Normalized reward epoch responses of 101 ACCs neurons. (d) Normalized choice/cue epoch and reward epoch responses of 85 OFC neurons. All panels, same format as in Fig. 3.
Figure 5
Figure 5
Population biases for self, other, and neither rewards. Scatter plots show mean normalized reward epoch responses (proportion of modulation relative to baseline) of individual neurons (from left to right) between self (Self:Other) and other rewards, between other and neither rewards, between self rewards from Self:Neither and Self:Other contexts, and between self (Self:Neither) and neither rewards, for ACCg (a), ACCs (b), and OFC (c) populations. Regression lines (type II) are shown in red (the circled data points are excluded from the regression). Unity lines are shown in black. The example neurons from Fig. 3,4 are indicated on the scatter plots. (d) Proportion of neurons (out of significantly classified neurons) from OFC, ACCs, and ACCg using self-referenced, other-referenced, and both-referenced frames to represent reward outcomes. Inset shows color codes used in the bar graph. Bars indicate significant differences in proportions (P < 0.05, χ2 test).
Figure 6
Figure 6
Anatomical projections of recorded locations of all ACCg, ACCs, and OFC cells. Recording sites were transformed from chamber coordinates into interaural coordinates. The interaural coordinates of individual cells from both monkeys were then projected onto standard stereotaxic maps of rhesus monkeys, with a 2 mm interaural spacing in the anterior-posterior dimension. Cells are shown on coronal slices and color-coded for the types of frames of reference used, as specified in Supplementary Table 1 (see box). The lateral view of the brain (inset) shows the locations of the coronal sections. cgs, cingulate sulcus; ps, principal sulcus; morb, medial orbitofrontal sulcus; lorb, lateral orbitofrontal sulcus; ros, rostral sulcus; Cd, caudate.
Figure 7
Figure 7
Prosocial behavior and the fidelity of neuronal responses on Other:Neither trials. (a) ACCg; (b) ACCs; (c) OFC. Coefficients of variation in firing rate (CV; Online Methods) during the reward epoch on other reward trials are plotted as a function of whether actors were more or less prosocial on Other:Neither trials based on median split (higher: preference index greater than median; lower: preference index less than median). Asterisks indicate P < 0.05 by bootstrap test.

References

    1. Fehr E, Fischbacher U. The nature of human altruism. Nature. 2003;425:785–791. - PubMed
    1. Gallese V, Keysers C, Rizzolatti G. A unifying view of the basis of social cognition. Trends Cogn Sci. 2004;8:396–403. - PubMed
    1. Berger SM. Conditioning through vicarious instigation. Psychological Review. 1962;5:450–466. - PubMed
    1. Rilling J, et al. A neural basis for social cooperation. Neuron. 2002;35:395–405. - PubMed
    1. de Quervain DJ, et al. The neural basis of altruistic punishment. Science. 2004;305:1254–1258. - PubMed

Publication types