. 2013 Feb;45(2):124-30.
doi: 10.1038/ng.2504. Epub 2012 Dec 23.

Chromatin marks identify critical cell types for fine mapping complex trait variants

Affiliations

Chromatin marks identify critical cell types for fine mapping complex trait variants

Gosia Trynka et al. Nat Genet. 2013 Feb.

Abstract

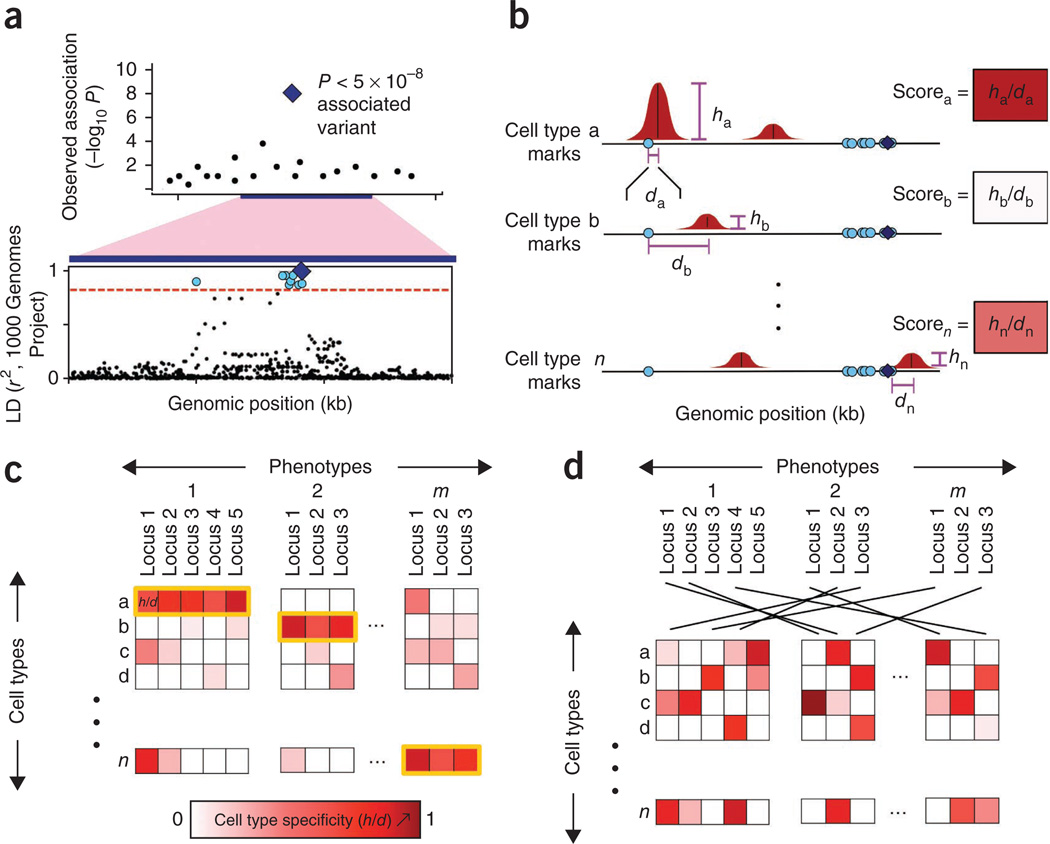
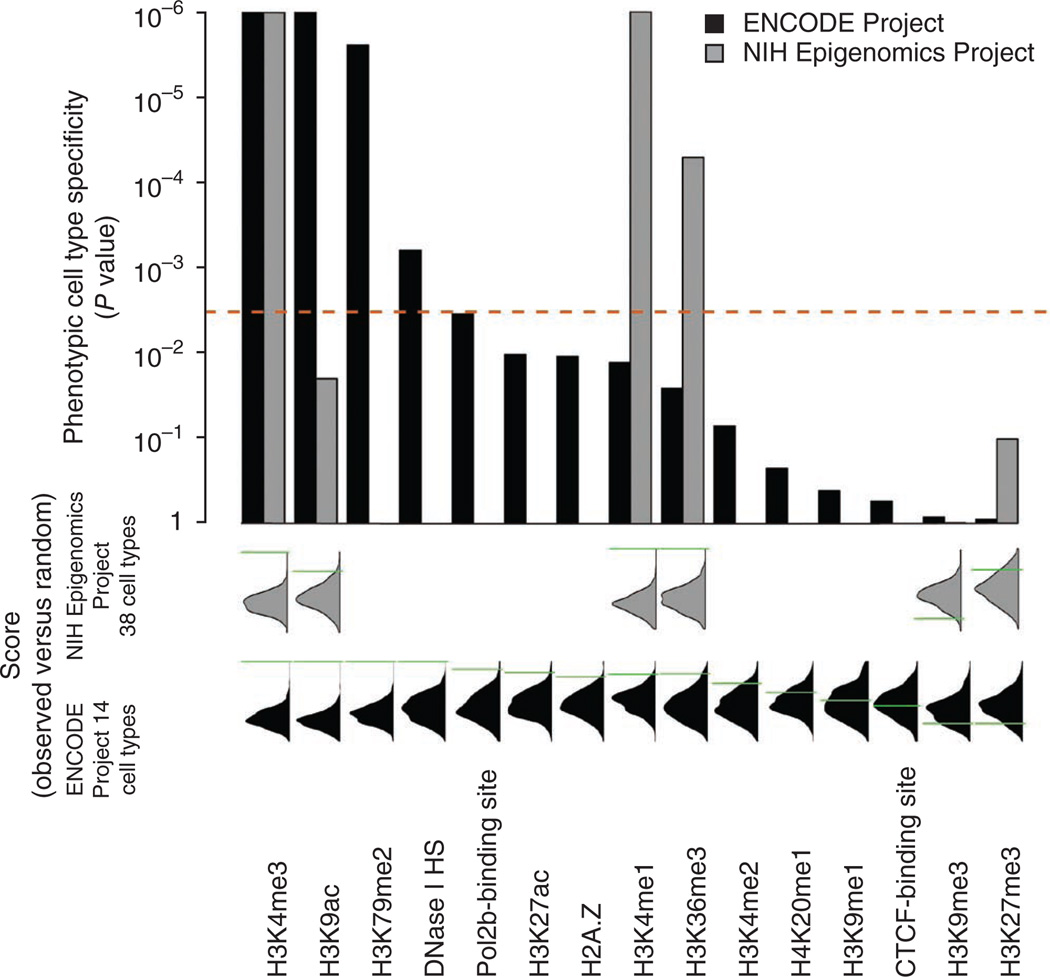
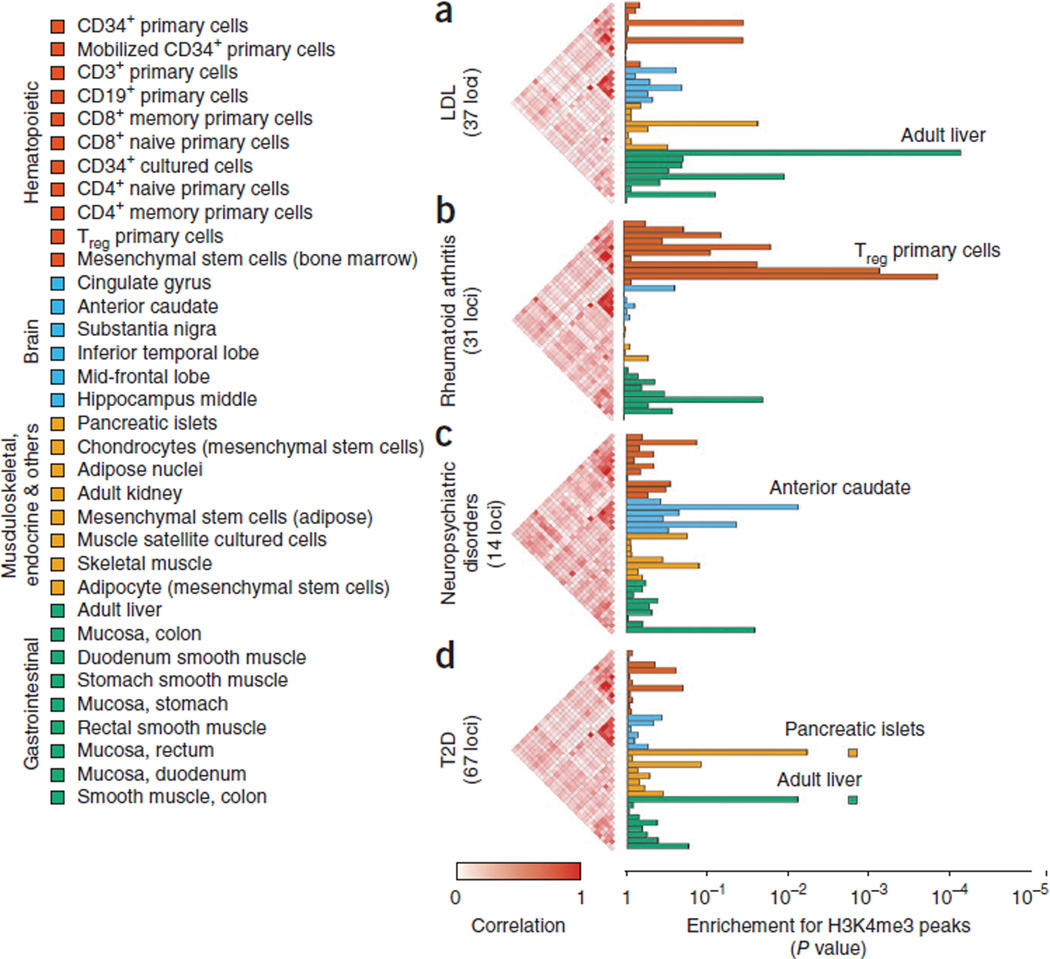
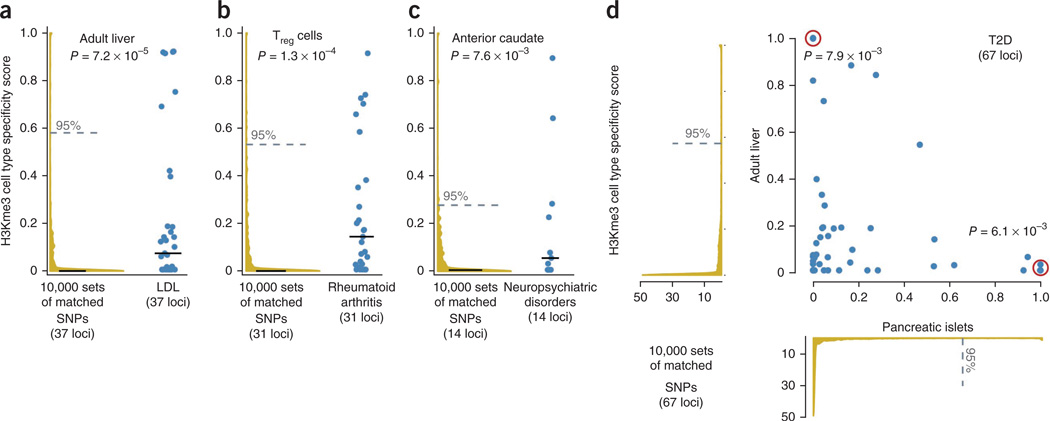
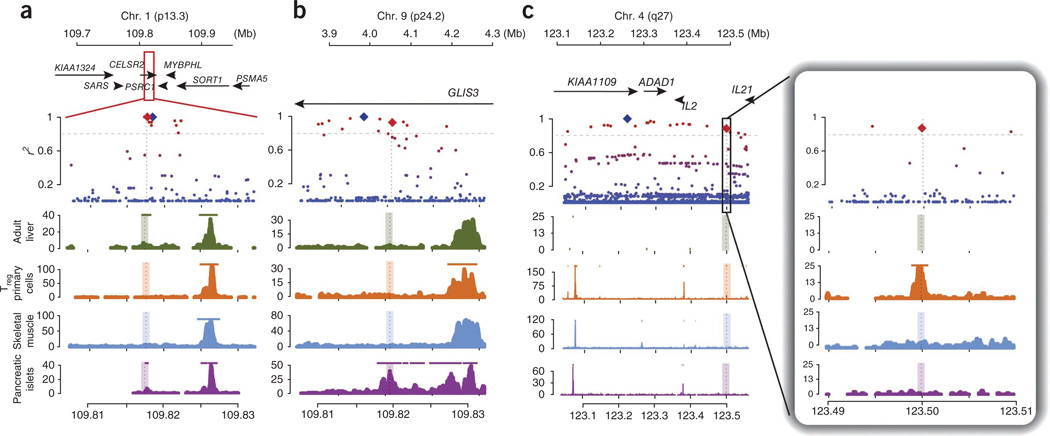
If trait-associated variants alter regulatory regions, then they should fall within chromatin marks in relevant cell types. However, it is unclear which of the many marks are most useful in defining cell types associated with disease and fine mapping variants. We hypothesized that informative marks are phenotypically cell type specific; that is, SNPs associated with the same trait likely overlap marks in the same cell type. We examined 15 chromatin marks and found that those highlighting active gene regulation were phenotypically cell type specific. Trimethylation of histone H3 at lysine 4 (H3K4me3) was the most phenotypically cell type specific (P < 1 × 10(-6)), driven by colocalization of variants and marks rather than gene proximity (P < 0.001). H3K4me3 peaks overlapped with 37 SNPs for plasma low-density lipoprotein concentration in the liver (P < 7 × 10(-5)), 31 SNPs for rheumatoid arthritis within CD4(+) regulatory T cells (P = 1 × 10(-4)), 67 SNPs for type 2 diabetes in pancreatic islet cells (P = 0.003) and the liver (P = 0.003), and 14 SNPs for neuropsychiatric disease in neuronal tissues (P = 0.007). We show how cell type-specific H3K4me3 peaks can inform the fine mapping of associated SNPs to identify causal variation.


Figures

Figure 1
Figure 1
Overview of the statistical approach. (a) For phenotypically associated variants, other variants in tight LD are found. For each SNP associated with a phenotype from genetic studies (lead SNP, blue diamond; top), we define a locus by identifying SNPs in tight LD (r2 > 0.8, dashed red line; bottom) using data from the 1000 Genomes Project (blue dots; bottom). (b) Each locus is scored on the height and distance of the nearest peak to a variant in LD. For a selected chromatin mark, we define peaks (red) in n cell types across the genome. For each SNP in the locus (blue diamond and light-blue circles), we compute a score equal to the height of the closest peak (vertical purple line) divided by the distance to the summit in each of the n cell types (horizontal purple line). In each locus within each cell type, we note the value of the SNP with the highest score: this measure reflects the overlap between a locus and a cell type–specific regulatory element. (c) Across many phenotypes, we assess whether marks overlap alleles in specific cell types. Here, the measure of cell type specificity of each risk locus is represented by the intensity of red color. A phenotypically cell type–specific mark should consistently give signal in one or a small number of cell types for a given phenotype (yellow outline). We quantify the phenotypic cell type specificity of each mark. (d) Permutations are performed to assess the significance of phenotypic cell type specificity. To compute the significance of the phenotypic cell type specificity for a chromatin mark, we permutate SNPs from different loci across phenotypes; this preserves tissue-specific signals without altering the correlation and prevalence of tissue-specific signals.
Figure 2
Figure 2
Evaluating the significance of phenotypic cell type specificity for different marks. We used two data sets of marks assayed in different cell types: the ENCODE Project and NIH Epigenomics Project. For each mark, we performed up to 1 million permutations of SNPs and phenotypes to calculate the null distribution of phenotypic cell type specificity for comparison to observed phenotypic cell type specificity. Below, we show the observed phenotypic cell type specificity (green lines) against the null distribution (black and gray density plots). Above, we plot the corresponding P values. The red dashed line indicates the significance threshold after correcting for the testing of multiple independent hypotheses.
Figure 3
Figure 3
SNPs for four complex traits overlap H3K4me3 marks in specific cell types. (a–d) We considered four phenotypes: LDL cholesterol plasma concentration (a), rheumatoid arthritis (b), neuropsychiatric disorders (schizophrenia and bipolar disease) (c) and T2D (d). For each phenotype, we calculated the cell type–specific overlap with H3K4me3 histone modification peaks in 34 tissues (listed on the left). The histograms on the right show the significance of the overlap for each tissue with variants from each of the phenotypes, estimated by sampling sets of SNPs matched so that the total number of peaks overlapping SNPs in LD was the same as in the test set. Adjacent to each histogram, we present correlation coefficients between two tissues based on scores computed from randomly sampled sets of independent loci. Colored boxes in d show independent P values for pancreatic islets and liver computed by removing the SNPs scoring highly in one tissue but not the other.
Figure 4
Figure 4
Cell type specificity for four sets of SNPs. (a–d) The distribution of cell type– specificity scores (h/d; Fig. 1b) is shown for SNPs associated with LDL cholesterol concentration, rheumatoid arthritis, neuropsychiatric disorders and T2D within liver (a), CD4+ Treg cells (b), anterior caudate nucleus (c) and jointly in pancreatic islets (x axis) and liver (y axis) (d). Blue points represent cell type specificity scores. Red circles indicate overlapping points, representing SNPs with very similar scores. We compare these scores to specificity scores in the same tissue of 10,000 sampled sets of matched SNPs from HapMap (yellow density plots). We plot the median specificity for both the distribution of observed SNPs and the sampled sets of matched SNPs (solid lines). Also, we present the 95th-percentile threshold for the sampled sets of matched SNPs (dashed line), which we use as a specificity cutoff. For each phenotype, about one-fourth of variants overlap cell type–specific H3K4me3 peaks.
Figure 5
Figure 5
Selected phenotypically associated loci with high cell type specificity. We present three examples of loci with cell type–specific overlap with H3K4me3 peaks. Top, genomic coordinates and genes near the associated SNP. Middle, lead SNP (blue diamond) and other nearby SNPs from the 1000 Genomes Project (red dots correspond to those with high r2, blue dots correspond to those with low r2). We also show the SNP that is closest to the cell type–specific peak (red diamond). Bottom, H3K4me3 sequence tag counts for selected cell types. Colored horizontal lines in the tissue panels correspond to peak calls. Dashed vertical lines mark the summits of phenotypically cell type–specific peaks. (a–c) Shown are the SORT1 locus for LDL (a), the GLIS3 locus for T2D (b) and the IL2–IL21 locus for rheumatoid arthritis (c).

Similar articles

Cited by

References

    1. Nicolae DL, et al. Trait-associated SNPs are more likely to be eQTLs: annotation to enhance discovery from GWAS. PLoS Genet. 2010;6:e1000888. - PMC - PubMed
    1. Fraser HB, Xie X. Common polymorphic transcript variation in human disease. Genome Res. 2009;19:567–575. - PubMed
    1. Lango Allen H, et al. Hundreds of variants clustered in genomic loci and biological pathways affect human height. Nature. 2010;467:832–838. - PMC - PubMed
    1. Nica AC, et al. Candidate causal regulatory effects by integration of expression QTLs with complex trait genetic associations. PLoS Genet. 2010;6:e1000895. - PMC - PubMed
    1. Fehrmann RS, et al. eQTLs reveal that independent genetic variants associated with a complex phenotype converge on intermediate genes, with a major role for the HLA. PLoS Genet. 2011;7:e1002197. - PMC - PubMed

Publication types