

Exome array analysis identifies new loci and low-frequency variants influencing insulin processing and secretion
- PMID: 23263489
- PMCID: PMC3727235
- DOI: 10.1038/ng.2507
Exome array analysis identifies new loci and low-frequency variants influencing insulin processing and secretion
Abstract
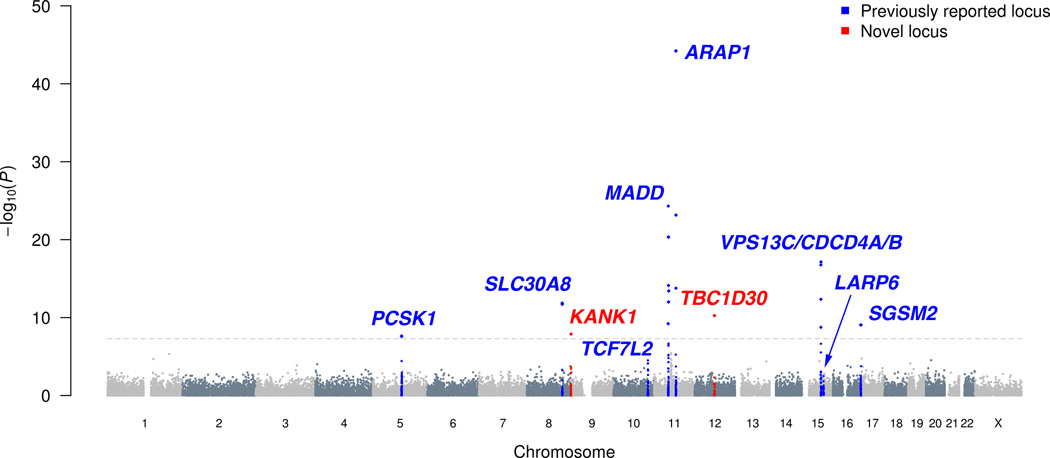
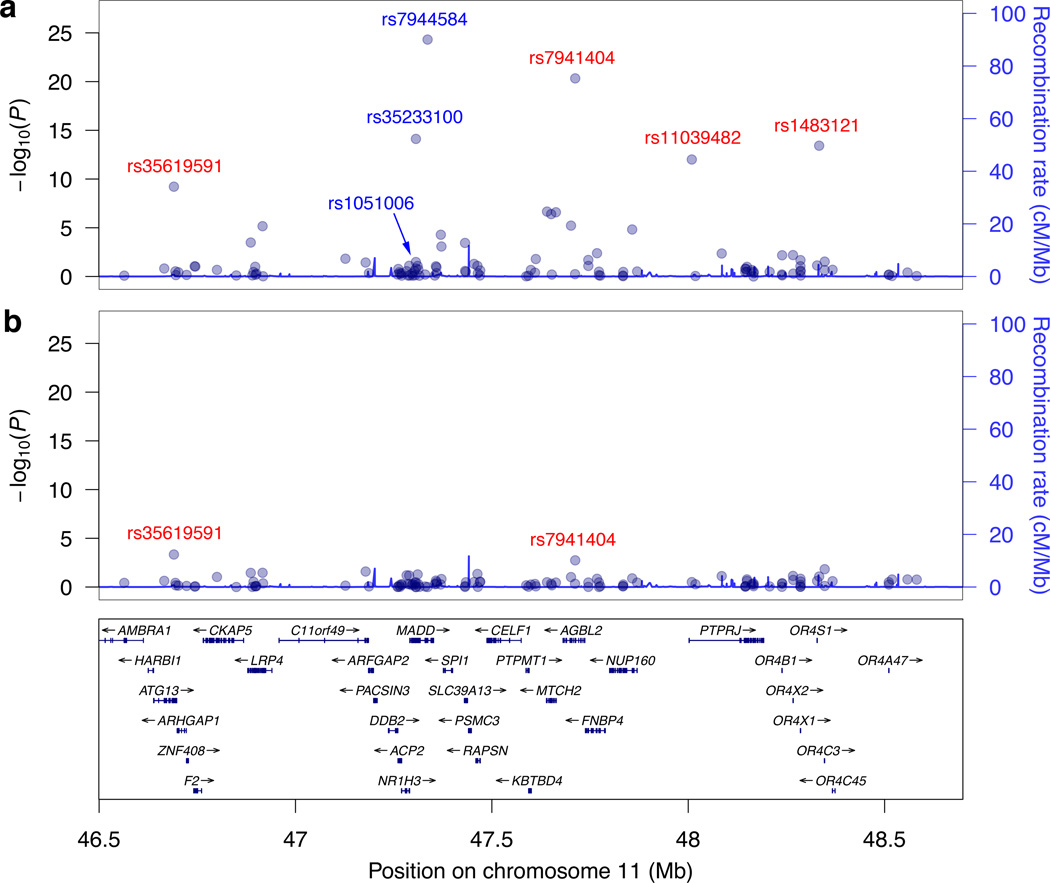
Insulin secretion has a crucial role in glucose homeostasis, and failure to secrete sufficient insulin is a hallmark of type 2 diabetes. Genome-wide association studies (GWAS) have identified loci contributing to insulin processing and secretion; however, a substantial fraction of the genetic contribution remains undefined. To examine low-frequency (minor allele frequency (MAF) 0.5-5%) and rare (MAF < 0.5%) nonsynonymous variants, we analyzed exome array data in 8,229 nondiabetic Finnish males using the Illumina HumanExome Beadchip. We identified low-frequency coding variants associated with fasting proinsulin concentrations at the SGSM2 and MADD GWAS loci and three new genes with low-frequency variants associated with fasting proinsulin or insulinogenic index: TBC1D30, KANK1 and PAM. We also show that the interpretation of single-variant and gene-based tests needs to consider the effects of noncoding SNPs both nearby and megabases away. This study demonstrates that exome array genotyping is a valuable approach to identify low-frequency variants that contribute to complex traits.
Figures
References
Publication types
MeSH terms
Substances
Grants and funding
- R01 DK093757/DK/NIDDK NIH HHS/United States
- DK093757/DK/NIDDK NIH HHS/United States
- R56 DK062370/DK/NIDDK NIH HHS/United States
- Z01 HG000024/ImNIH/Intramural NIH HHS/United States
- P30 DK043351/DK/NIDDK NIH HHS/United States
- 1Z01 HG000024/HG/NHGRI NIH HHS/United States
- R01 DK072193/DK/NIDDK NIH HHS/United States
- T32 HG000040/HG/NHGRI NIH HHS/United States
- R01 DK062370/DK/NIDDK NIH HHS/United States
- DK072193/DK/NIDDK NIH HHS/United States
- U01 DK062370/DK/NIDDK NIH HHS/United States
- DK062370/DK/NIDDK NIH HHS/United States
- P30 DK020572/DK/NIDDK NIH HHS/United States
LinkOut - more resources
Full Text Sources
Other Literature Sources
Medical
Miscellaneous
