. 2013 Feb;45(2):186-90.
doi: 10.1038/ng.2508. Epub 2012 Dec 23.

Exome sequencing identifies mutation in CNOT3 and ribosomal genes RPL5 and RPL10 in T-cell acute lymphoblastic leukemia

Affiliations

Exome sequencing identifies mutation in CNOT3 and ribosomal genes RPL5 and RPL10 in T-cell acute lymphoblastic leukemia

Kim De Keersmaecker et al. Nat Genet. 2013 Feb.

Abstract

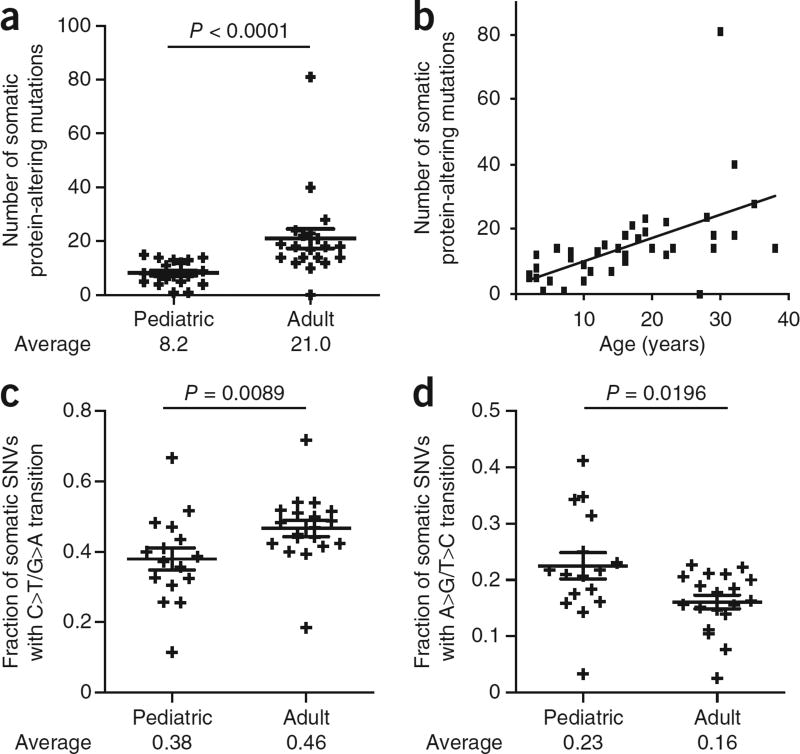
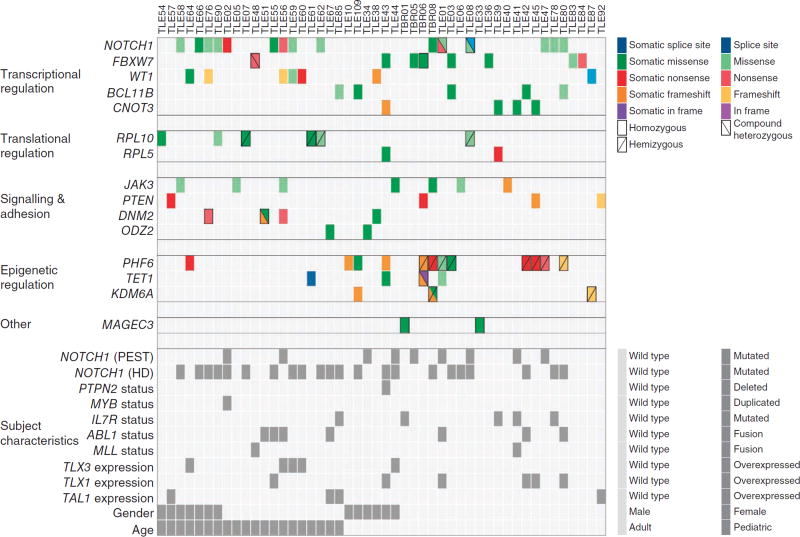
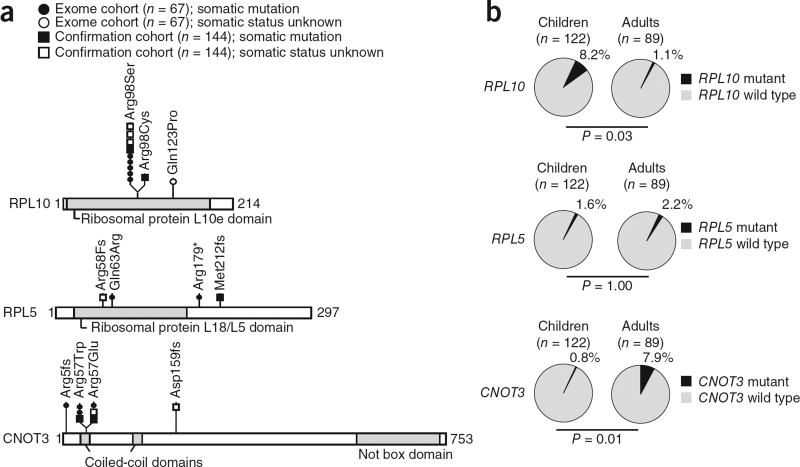
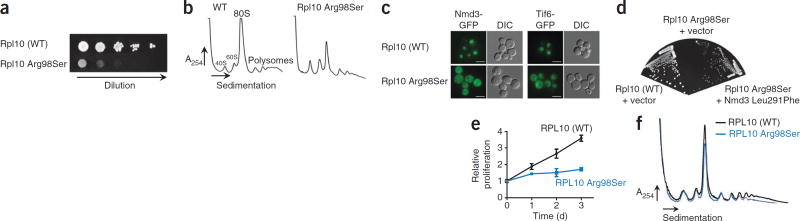
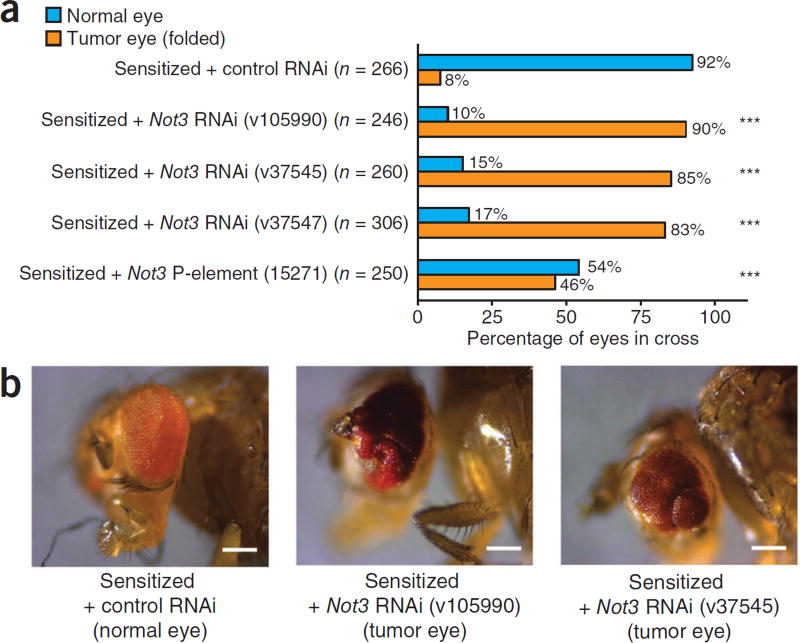
T-cell acute lymphoblastic leukemia (T-ALL) is caused by the cooperation of multiple oncogenic lesions. We used exome sequencing on 67 T-ALLs to gain insight into the mutational spectrum in these leukemias. We detected protein-altering mutations in 508 genes, with an average of 8.2 mutations in pediatric and 21.0 mutations in adult T-ALL. Using stringent filtering, we predict seven new oncogenic driver genes in T-ALL. We identify CNOT3 as a tumor suppressor mutated in 7 of 89 (7.9%) adult T-ALLs, and its knockdown causes tumors in a sensitized Drosophila melanogaster model. In addition, we identify mutations affecting the ribosomal proteins RPL5 and RPL10 in 12 of 122 (9.8%) pediatric T-ALLs, with recurrent alterations of Arg98 in RPL10. Yeast and lymphoid cells expressing the RPL10 Arg98Ser mutant showed a ribosome biogenesis defect. Our data provide insights into the mutational landscape of pediatric versus adult T-ALL and identify the ribosome as a potential oncogenic factor.


Figures

Figure 1
Figure 1
Correlation between the age of the affected individual and mutation number and type. (a) Plot showing the number of protein-altering somatic mutations in pediatric (≤15 years) and adult (≥16 years) individuals with T-ALL. Averages and s.e.m. are shown. The P value tested whether there was a significantly different mutation number in adults versus children and was calculated using the two-tailed Wilcoxon signed-rank test. Pediatric cases, n = 19; adult cases, n = 20. (b) Dot plot representing the number of protein-altering somatic mutations versus age of the affected individual. (c,d) Plots showing the fraction of somatic SNVs that were C>T/G>A transitions (c) or A>G/T >C transitions (d) in pediatric and adult individuals with T-ALL. Averages and s.e.m. are shown. Samples with fewer than ten somatic SNVs were excluded from this analysis. The reported P values test whether there was a significant difference between adults and children and was calculated using the two-tailed Wilcoxon signed-rank test. Pediatric cases, n = 16; adult cases, n = 19.
Figure 2
Figure 2
Overview of mutations in 15 identified candidate T-ALL driver genes in 67 samples from affected individuals. Top, mutations in 15 candidate T-ALL driver genes are shown across the set of cases. For clarity, only affected individuals harboring mutations in at least 1 of the 15 genes are included. Each type of mutation is indicated by color, and symbols indicate whether the mutation was homozygous, hemizygous or compound heterozygous. Mutations with no indication are heterozygous. All mutations shown here were validated by Sanger sequencing. Bottom, the characteristics of the relevant individuals (identified by Sanger sequencing, karyotyping or gene expression analysis) are shown. Mutations in NOTCH1 were hard to identify by exome sequencing owing to low capture efficiency and resulting low sequence coverage of NOTCH1. Detailed descriptions of the mutations shown in this figure are provided in Supplementary Tables 5 and 7–9.
Figure 3
Figure 3
Overview of mutations in RPL10, RPL5 and CNOT3. (a) Schematics of RPL10, RPL5 and CNOT3 protein structures with the positions of the alterations detected in 211 T-ALL samples indicated. The somatic status of the mutations is indicated. The characteristics of the individuals with RPL10, RPL5 or CNOT3 mutations are reported in Supplementary Tables 8 and 9. (b) Pie charts reporting mutation frequencies detected in adult versus pediatric individuals with T-ALL. All reported P values tested whether there was a significant difference in mutation frequency in adults versus children and were calculated using the unpaired t test.
Figure 4
Figure 4
Cellular effects of the RPL10 p.Arg98Ser alteration. (a,b) The growth of yeast cells expressing wild-type (WT) Rpl10 or Rpl10 Arg98Ser was compared by plating tenfold serial dilutions (a), and polysome profiles were obtained (b). A254, absorbance at 254 nm. (c) The fluorescence of Nmd3-GFP and Tif6-GFP was examined in cells expressing wild-type Rpl10 or Rpl10 Arg98Ser. Scale bars, 5 µm. DIC, differential interference contrast. In the case of Nmd3, cells also contained leptomycin B (LMB)-sensitive Crm1, and Nmd3-GFP localization was examined after treatment with LMB to trap Nmd3 in the nucleus. (d) Yeast cells expressing wild-type Rpl10 or Rpl10 Arg98Ser were transformed with empty vector or vector expressing Nmd3 Leu291Phe. Tenfold serial dilutions were grown. (e) Proliferation curves of mouse B cells (Ba/F3) expressing wild-type RPL10 or RPL10 Arg98Ser. Error bars, s.d. of measurements in triplicate. (f) Polysome profiling in Ba/F3 cells expressing human wild-type RPL10 or RPL10 Arg98Ser.
Figure 5
Figure 5
Reduced Not3 expression promotes tumor development in a Drosophila sensitized background. (a,b) Sensitized flies overexpressing the Notch ligand Delta in the eye were crossed to one of three different Drosophila Not3 RNAi fly lines (v105990, v37545, v37547), to the 15271 line with a P-element insertion in Not3 or to control RNAi flies (with an RNAi construct against the white (w) gene). Shown are quantitative (a) and qualitative (b) representations of the eye tumor burden in different genotypes. ***, tumor incidence in this cross was significantly different from that in the control cross (P < 0.001) as analyzed by two-tailed Fisher’s exact test. Scale bars in b, 200 µm.

Similar articles

Cited by

References

    1. Grabher C, von Boehmer H, Look AT. Notch 1 activation in the molecular pathogenesis of T-cell acute lymphoblastic leukaemia. Nat. Rev. Cancer. 2006;6:347–359. - PubMed
    1. Van Vlierberghe P, Ferrando A. The molecular basis of T cell acute lymphoblastic leukemia. J. Clin. Invest. 2012;122:3398–3406. - PMC - PubMed
    1. Ferres-Marco D, et al. Epigenetic silencers and Notch collaborate to promote malignant tumours by Rb silencing. Nature. 2006;439:430–436. - PubMed
    1. De Keersmaecker K, Marynen P, Cools J. Genetic insights in the pathogenesis of T-cell acute lymphoblastic leukemia. Haematologica. 2005;90:1116–1127. - PubMed
    1. Pui CH, Relling MV, Downing JR. Acute lymphoblastic leukemia. N. Engl. J. Med. 2004;350:1535–1548. - PubMed

Publication types