. 2013 Feb;14(2):162-71.
doi: 10.1038/ni.2499. Epub 2012 Dec 23.

Absence of signaling into CD4⁺ cells via C3aR and C5aR enables autoinductive TGF-β1 signaling and induction of Foxp3⁺ regulatory T cells

Affiliations

Absence of signaling into CD4⁺ cells via C3aR and C5aR enables autoinductive TGF-β1 signaling and induction of Foxp3⁺ regulatory T cells

Michael G Strainic et al. Nat Immunol. 2013 Feb.

Abstract

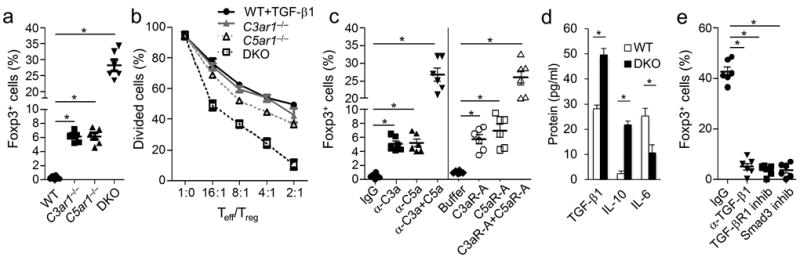
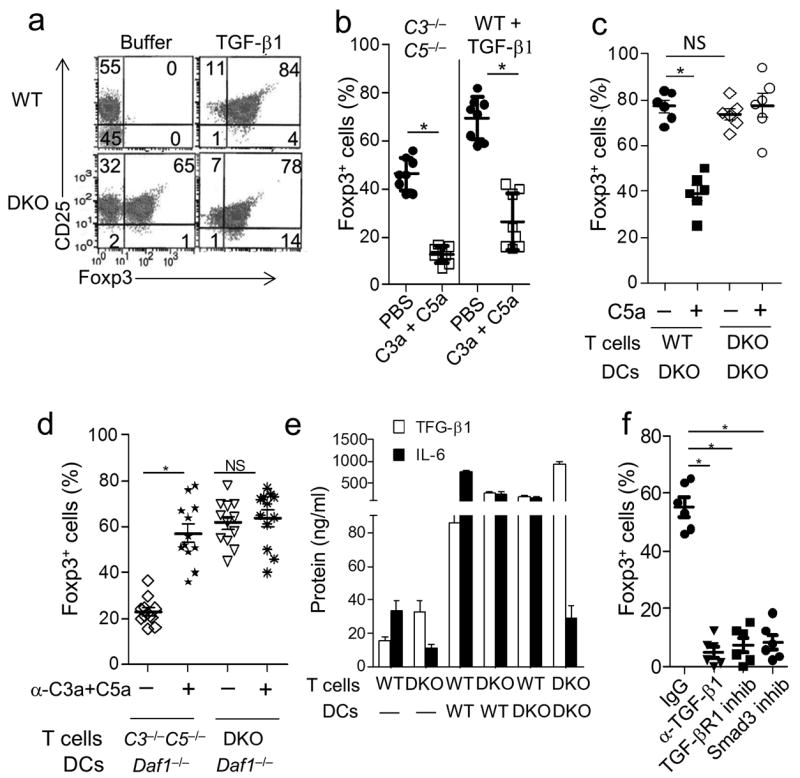
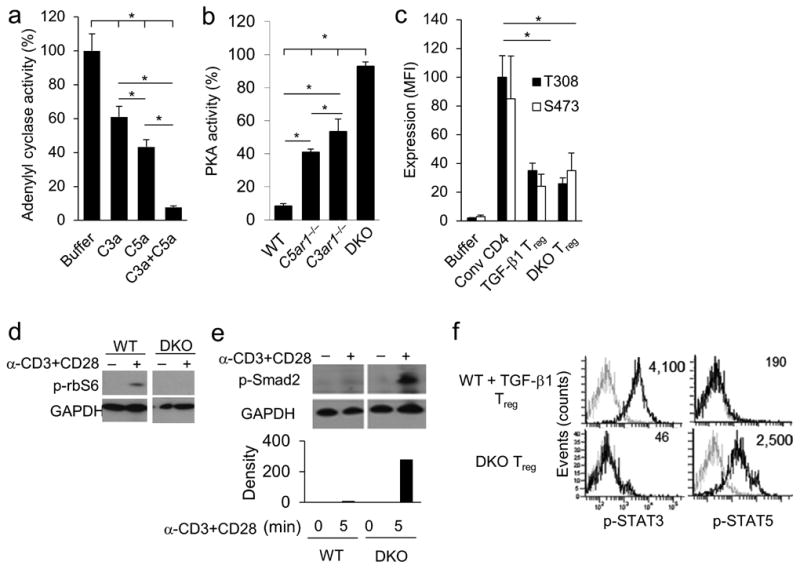
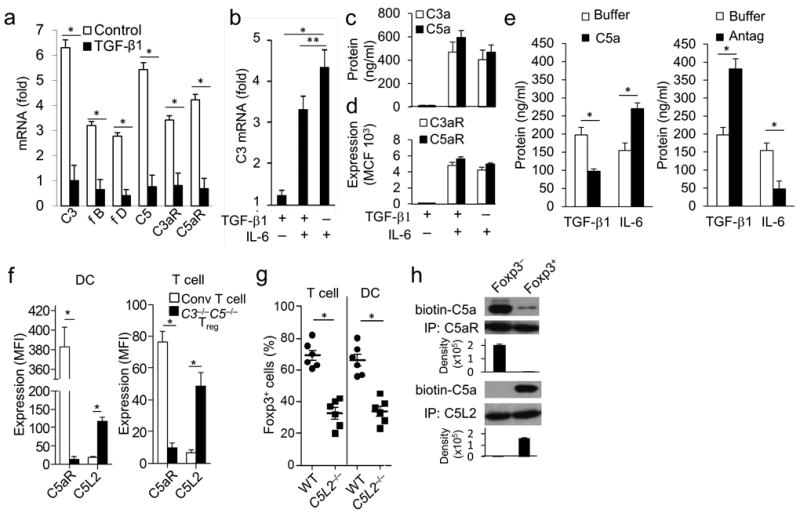
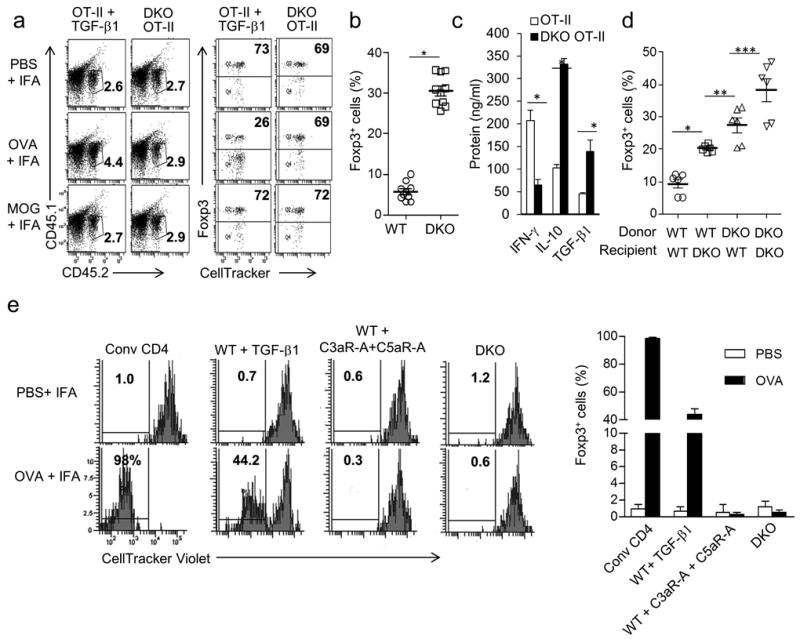
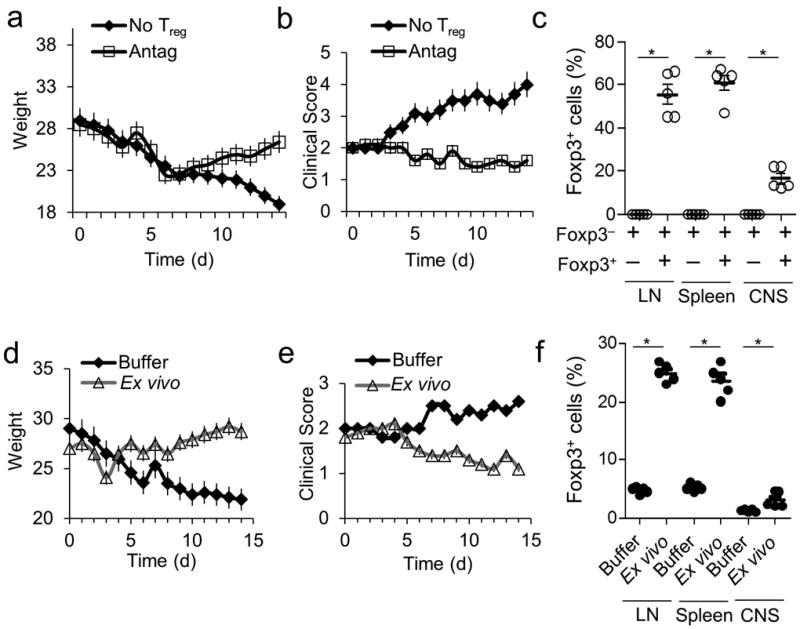
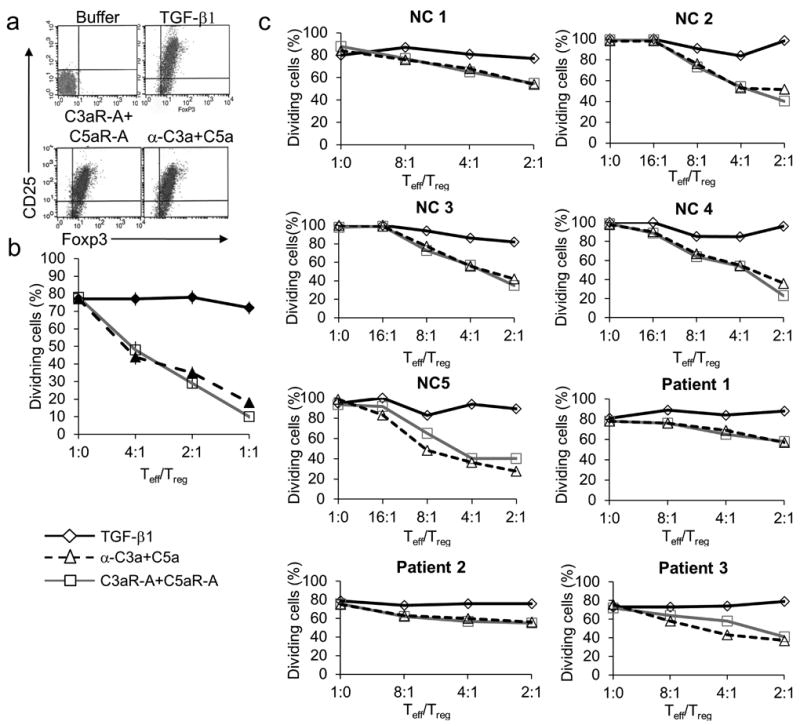
Signaling through the G protein-coupled receptors for the complement fragments C3a and C5a (C3aR and C5aR, respectively) by dendritic cells and CD4(+) cells provides costimulatory and survival signals to effector T cells. Here we found that when signals from C3aR and C5aR were not transduced into CD4(+) cells, signaling via the kinases PI(3)Kγ, Akt and mTOR ceased, activation of the kinase PKA increased, autoinductive signaling by transforming growth factor-β1 (TGF-β1) initiated and CD4(+) T cells became Foxp3(+) induced regulatory T cells (iT(reg) cells). Endogenous TGF-β1 suppressed signaling through C3aR and C5aR by preventing the production of C3a and C5a and upregulating C5L2, an alternative receptor for C5a. The absence of signaling via C3aR and C5aR resulted in lower expression of costimulatory molecules and interleukin 6 (IL-6) and more production of IL-10. The resulting iT(reg) cells exerted robust suppression, had enhanced stability and suppressed ongoing autoimmune disease. Antagonism of C3aR and C5aR can also induce functional human iT(reg) cells.


Figures

Figure 1
Figure 1. iTregs develop from stimulated CD4+ cells devoid of C3aR and C5aR signaling in the absence of DCs
All inductions were performed for 3 days with 1 ×10⁶ CD62LhiFoxp3CD25 CD4+ T cells, rhIL-2 (5 ng/ml), and anti-CD3 + CD28 beads (per manufacturer’s instructions), experiments were repeated two times. (a) WT, C3ar1−/−, C5ar1−/−, or C3ar1−/− C5ar1−/− Foxp3 cells were activated and assayed for percent Foxp3+CD25+ by flow cytometry (*P<0.001, n=5). (b) Following iTreg induction (as in a), flow sorted WT, C3ar1−/−, C5ar1−/−, or C3ar1−/− C5ar1−/− Foxp3+CD25+ cells were incubated with 106 CellTracker Red™ labeled CD25Foxp3 CD4+ WT cells in differing Teff/iTreg ratios + anti-CD3 (5 μg/ml) and 2.5×10⁵ CD11c+ DCs. Relative suppressive capacity was determined by percent Red-labeled dividers (n=5). (c) WT Foxp3 CD4+ T cells were induced as in (a) in the absence or presence of anti-C3a (10 μg/ml), anti-C5a (10 μg/ml), or both or in the absence and presence of the antagonists C3aR-A (10 nM), C5aR-A (10 nM), or both. CD4+ T cells then were assayed for Foxp3 expression by flow cytometry (*P<0.001, n=6). (d) Following iTreg induction (as in a), sorted WT and C3ar1−/−C5ar1−/− Foxp3+CD25+ cells were washed and recultured for 24 hr in the absence of further stimulation. Culture supernatants were assayed for TGF-β, IL-6, and IL-10 by ELISA (*P<0.001, n=6). (e) C3ar1−/−C5ar1−/− iTregs were induced (as in a) in the absence and presence of anti-TGF-β mAb (5 μg/ml), TGF-βR1 inhibitor (10 nM), or Smad3 inhibitor (5 μM). Foxp3+ CD25+ Treg percentages were quantified by flow cytometry.
Figure 2
Figure 2. Absent C3aR and C5aR signaling in CD4+ cells dominates in iTreg induction when WT DCs are present
iTreg induction and activation experiments were performed as in Fig 1 with 2.5×10⁵ CD11c+ DCs and anti-CD3 mAb (5 μg/ml) instead of anti-CD3+CD28 beads, experiments were repeated two times. (a) Sorted WT and C3ar1−/−C5ar1−/− Foxp3CD4+ T cells were incubated with WT DCs ± TGF-β1 (5 ng/ml) and assayed for CD25 and Foxp3 expression by flow cytometry (*P<0.001, n=10). (b) (Left) WT Foxp3 CD4+ T cells were incubated with C3−/−C5−/− DCs without TGF-β1 ± C3a/C5a (100 ng/ml) and Foxp3+CD25+ cells quantified by flow cytometry. (Right) WT Foxp3 CD4+ T cells were incubated in the presence of TGF-β1 (5 ng/ml) ± C3a/C5a (100 ng/ml) and percent Foxp3+CD25+ cells quantified (*P<0.001, n=7). (c) Sorted WT or C3ar1−/−C5ar1−/− Foxp3 CD4+ T cells were incubated with C3ar1−/−C5ar1−/− DCs in the absence or presence of C5a (100 ng/ml) after which percent Foxp3+CD25+ cells was quantified. The % Foxp3+ cells with DKO or WT T cells did not significantly differ (P=0.54). (d) Sorted C3−/−C5−/− or C3ar1−/−C5ar1−/− Foxp3CD4+ T cells were incubated with Daf1−/− DCs ± anti-C3a and anti-C5a mAbs after which percent Foxp3+CD25+ cells was quantified (*P<0.001; n=6). (e) Sorted WT Foxp3 or C3ar1−/−C5ar1−/− Foxp3CD4+ T cells were incubated for 24 hr either in the absence of DCs or in the presence of WT DCs or C3ar1−/−C5ar1−/− DCs. Supernatants then were assayed for TGF-β1 and IL-6 by ELISA (*P<0.001, n=6). (f) C3ar1−/−C5ar1−/− Foxp3 cells were incubated for 3 days with anti-CD3 (5 μg/ml), IL-2 (5 ng/ml), and WT DCs ± anti-TGF-β mAb (5 μg/ml), TGF-βR1 inhibitor (10 nM), or Smad3 inhibitor (5 μM). Following the 3 day induction, Foxp3+CD25+ Treg percentages were determined by flow cytometry.
Figure 3
Figure 3. Absent C3aR and C5aR signaling lifts restraint-on PKA activation and represses PI-3Kγ-AKT- mTOR signaling
Experiments were repeated two times. (a) WT CD4+ T cells were incubated for 30 min with anti-CD3+CD28 beads after which they were incubated for 10 min with Forskolin (30 μM) ± C3a (100 nM), C5a (100 nM), or both. Levels of cAMP activity were determined by cAMP-Glo assay (*P<0.001). (b) WT, C3ar1−/−, C5ar1−/−, and C3ar1−/−C5ar1−/− CD4+ T cells were stimulated with anti-CD3 mAb for 30 min after which PKA activity was quantified by PepTag assay. (c) iTregs generated from sorted WT Foxp3 CD4+ T cells plus TGF-β1, iTregs derived from C3ar1−/−C5ar1−/− Foxp3 CD4+ T cells, and conventional Foxp3 CD4+ T cells were stimulated with anti-CD3+CD28 beads for 15 min and assayed for S473 and T308 p-AKT by Luminex assay (n=5). (d and e) WT or C3ar1−/−C5ar1−/− CD4+ T cells were incubated for 15 min ± anti-CD3+CD28 beads. Cells were extracted in phospho-lysis buffer and extracts assayed for (d) phospho-rbS6 and (e) phospho-Smad2 by immunoblotting. (f) iTregs induced from WT Foxp3 CD4+ T cells plus TGF-β1 or from C3ar1−/−C5ar1−/− Foxp3 CD4+ T cells were assayed for phospho-STAT3 and phospho-STAT5 by flow cytometry (representative plots of n=6).
Figure 4
Figure 4. TGF-β1 and C5L2 suppress complement production and enhance iTreg induction
Experiments were repeated two times. (a) Sorted WT Foxp3 cells were incubated for 1 hr with anti-CD3+CD28 beads (as in Fig 1) in the absence or presence of TGF-β1 (5 ng/ml) and then assayed for complement mRNA transcripts by qPCR (*P<0.001, n=5). (b) Sorted WT Foxp3 CD4+ T cells were incubated for 1 hr with anti-CD3+CD28 beads plus TGF-β1 (5 ng/ml) alone, TGF-β1 (5 ng/ml) plus IL-6 (5 ng/ml), or IL-6 (5 ng/ml) alone, after which the cells were assayed for C3 mRNA expression by qPCR (*P<0.001, **P<0.02, n=5). (c and d) Sorted WT Foxp3 CD4+ T cells were incubated for 48 hr with anti-CD3+CD28 beads plus TGF-β1 alone, TGF-β1+IL-6, or IL-6 alone as in (b). Culture supernatants were assayed for (c) C3a and C5a generation by ELISAs, and (d) C3aR and C5aR surface expression by flow cytometry (P<0.01 for TGF-β1 alone vs TGF-β1+IL-6 or IL-6 alone, Mean Fluorescence Intensity (MFI) values; n=5). (e) Sorted WT Foxp3 cells were activated for 48 hr with anti-CD3+CD28 beads ± C5a (100 ng/ml) or C3aR-A/C5aR-A (10 nM), after which culture supernatants were assayed for TGF-β1 or IL-6 by ELISA (P<0.05; n=6). (f) Sorted WT Foxp3 CD4+ T cells were incubated with WT DCs or with C3−/−C5−/− DCs in the absence of TGF-β1 (C3−/−C5−/− iTregs). DCs (left side) were assayed for C5aR and C5L2 expression by gating on CD11c+ cells. Responder T cells (right side) were assayed for C5aR and C5L2 expression by gating on Foxp3 cells in the case of WT CD4+ T cells prepared with WT DCs and on Foxp3+ cells in the case of WT CD4+ prepared with C3−/−C5−/− DCs. (*P < 0.01; n=5). (g) Sorted WT or C5L2−/− (encoded by Gpr77) Foxp3 CD4+ T cells were incubated with WT DCs (Left) and sorted WT Foxp3 CD4+ T cells were incubated with WT or C5L2−/− DCs (right) both in the presence of anti-CD3 and TGF-β1 (5 ng/ml). Percent Foxp3+CD25+ cells were assayed by flow cytometry. (*P<0.001, n=6). (h) WT Foxp3 CD4+ T cells were incubated for 3 days with WT DCs plus TGF-β1 (5 ng/ml) after which Foxp3+ and Foxp3 cells were sorted. Foxp3CD4+ T cells or Foxp3+ CD4+ iTregs were incubated for 5 min with anti-CD3+CD28 beads + biotin-labeled C5a, the cells chilled to 4°C, and plasma membrane fractions were isolated by ultracentrifugation. Following C5aR and C5L2 IP, bound proteins were eluted with alkaline solution, and equal amounts of protein (determined by A280) were loaded onto SDS PAGE gels. Following electrophoresis, gels were blotted for biotinylated-C5a by adding streptavidin-HRP followed by ECL reagent.
Figure 5
Figure 5. iTregs that arise when C3aR and C5aR signaling is disabled are stable and exert robust suppressor activity in vivo
Experiments were repeated two times. (a) iTregs were generated from sorted WT (CD45.2) Foxp3 GFP OT-II cells cultured with WT DCs and TGF-β1 or from sorted WT (CD45.2) Foxp3C3ar1−/−C5ar1−/− OT-II cells cultured with WT DCs without TGF-β1 as in Fig 2. Sorted (CD45.2) Foxp3+GFP+ cells prepared in each way were labeled with CellTracker Red (for gating to avoid color overlaps), and injected into CD45.1 recipients. Two days later, mice were immunized in hindlimbs with ova323-339 (100 μg) or MOG35-55 (100 μg) in IFA. Five days after immunization, draining inguinal lymph nodes (dLNs) were isolated, and CD45.2 cells were assayed for percent Foxp3+ cells (n=4 each group; representative plots shown). (b) WT and C3ar1−/−C5ar1−/− Foxp3-GFP OT-II mice were immunized with ova323-339 in CFA. Five days following immunization, percent Foxp3+CD25+ cells in the dLN was assessed (*P<0.001, n=10). (c) 1×10⁵ CD4+ T cells (unfractionated) from the dLN (from mice in panel b) were incubated with 1×10⁴ CD11c+ splenic DCs and ova323-339 for 24 hr. Culture supernatants were assayed for IFN-γ, IL-10, and TGF-β1 by ELISA (*P<0.001, n=10). (d) 2×10⁶ WT or C3ar1−/−C5ar1−/− Foxp3CD25 OT-II cells were adoptively transferred into WT or C3ar1−/−C5ar1−/− mice (non-OT-II). Five days following ovalbumin immunization, Foxp3+CD25+ cells in dLN were assessed by gating on OT-II TCR (*P<0.001, **P<0.02, ***P<0.05, n=5). (e) CellTracker Violet (Invitrogen) labeled (4×10⁶) OT-II cells (Thy-1.2 CD45.1) were transferred into WT Thy-1.1 mice as a source of T effectors. Two days later, 1×10⁶ sorted Foxp3+ CD25+ Tregs (each Thy1.2 CD45.2) prepared from Foxp3 CD4+ T cells and WT DCs with TGF-β1, C3aR/C5aR antagonists, or from C3ar1−/−C5ar1−/− Foxp3 CD4+ T cells and WT DCs were adoptively transferred into the Thy1.1 recipients. Five days following ovalbumin immunization, proliferation of violet-labeled Thy1.2 CD45.1 OT-II cells in the dLN was assessed (values given as percent dividers) (n=8 each group).
Figure 6
Figure 6. iTregs induced when C3aR and C5aR signaling is disabled in CD4+ cells inhibit autoimmune disease
Experiments were repeated two times. (a-c) EAE was induced in Foxp3-GFP mice. Ten days after disease onset, CD4+ T cells were isolated from spleens and LNs and separated into GFP+ and GFP populations by cell sorting. GFP cells (4×10⁶) were adoptively transferred into Rag2−/− mice. The mice were subsequently injected with 1×10⁶ sorted Foxp3-GFP+ cells generated ex vivo with C3aR-A/C5aR-A (10 nM) (control is no Tregs) after which (a) weight change, (b) clinical scores, and (c) percent Foxp3+CD25+ cells in the LNs, spleen, and CNS were assayed. (d-f) EAE was induced in Foxp3-GFP mice. Ten days after induction, mice were treated with PBS or with 1×10⁶ sorted Foxp3+ Tregs (generated ex vivo from Foxp3-GFP mice with C3aR-A/C5aR-A). (d) Clinical scores, (e) weights were assessed daily and (f) percent Foxp3+CD25+ cells in dLNs, spleen, and CNS were assessed at day 7 post treatment.
Figure 7
Figure 7. Human iTregs with robust suppressor activity can be induced by C3aR and C5aR antagonism
Experiments were repeated two times. (a) Flow sorted human CD45RA+CD25CD4+ T cells (1×10⁶) were incubated for 3 days with soluble anti-CD3 mAb (3 μg/ml), rhIL-2 (5 ng/ml), and 2.5×10⁵ autologous CD11c+ DCs in the absence or presence of 1) TGF-β1 (5 ng/ml), 2) each of C3aR-A/C5aR-A (10 nM), or 3) each of anti-C3a/C5a mAbs (10 μg/ml). Percent Foxp3+CD25+ CD4+ T cells then were determined by flow cytometry. (b) Flow sorted CD25+ cells from (a) were incubated for 3 days with in differing Teff/iTreg ratios with 1×10⁶ CFSE labeled autologous naive CD25 cells, anti-CD3 mAb (3 μg/ml), and 1×10⁴ autologous CD11c+ DCs. Percent dividers was determined by CFSE dilution. (c) CD45RA+CD25CD4+ T cells (1×10⁶) were isolated from 5 healthy controls (NC) and 3 MS patients by flow sorting. The cells were incubated for 3 days with soluble anti-CD3 mAb (3 μg/ml), rhIL-2 (5 ng/ml), and 2.5×10⁵ autologous DCs in the absence or presence of 1) rhTGF-β1 (5 ng/ml), 2) C3aR-A/C5aR-A (10 nM), or 3) anti-C3a/C5a mAbs (5 μg/ml). Cells were washed and sorted on CD25. After sorting, CD25+ (Treg) were incubated for 3 days with anti-CD3 mAb, 2.5×10⁵ autologous DCs, and 106 CD25 (Effector) cells prelabeled with CFSE. Percent dividers was determined by CFSE dilution.

Comment in

References

    1. Wing K, Sakaguchi S. Regulatory T cells exert checks and balances on self tolerance and autoimmunity. Nat Immunol. 2010;11:7–13. - PubMed
    1. Josefowicz SZ, et al. Extrathymically generated regulatory T cells control mucosal TH2 inflammation. Nature. 2012;482:395–399. - PMC - PubMed
    1. Shevach EM. Mechanisms of foxp3+ T regulatory cell-mediated suppression. Immunity. 2009;30:636–645. - PubMed
    1. Josefowicz SZ, Rudensky A. Control of regulatory T cell lineage commitment and maintenance. Immunity. 2009;30:616–625. - PMC - PubMed
    1. Strainic MG, et al. Locally produced complement fragments C5a and C3a provide both costimulatory and survival signals to naive CD4+ T cells. Immunity. 2008;28:425–435. - PMC - PubMed

Publication types

MeSH terms