

doi: 10.1038/nmeth.2305.
Epub 2012 Dec 23.
Single-molecule analysis of gene expression using two-color RNA labeling in live yeast
Affiliations
- PMID: 23263691
- PMCID: PMC3899799
- DOI: 10.1038/nmeth.2305
Item in Clipboard
Single-molecule analysis of gene expression using two-color RNA labeling in live yeast
Nat Methods.
2013 Feb.
Abstract
Live-cell imaging of mRNA yields important insights into gene expression, but it has generally been limited to the labeling of one RNA species and has never been used to count single mRNAs over time in yeast. We demonstrate a two-color imaging system with single-molecule resolution using MS2 and PP7 RNA labeling. We use this methodology to measure intrinsic noise in mRNA levels and RNA polymerase II kinetics at a single gene.
Figures
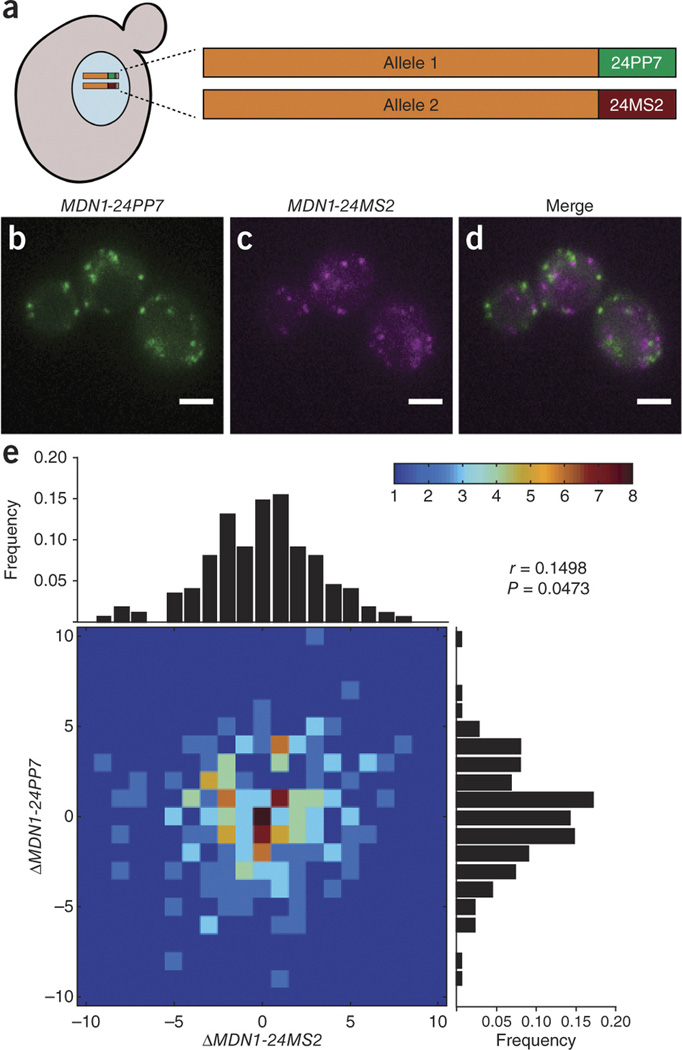
(a) A diploid strain carries one PP7-tagged MDN1 allele and one MS2-tagged MDN1 allele. Coexpression of PCP-2yEGFP and MCP-mCherry results in allele-specific labeling of mRNA. (b,c) Transcription of the indicated allele produces green or magenta fluorescent spots. (d) Overlay of mRNA fluorescence for both alleles. (e) MDN1 mRNAs are counted in single cells every 20 min. Fluctuations were determined as the change in steady-state levels for a given allele between time points, and a heat map was generated to represent these fluctuations. Peripheral histograms represent the distribution of fluctuations for each allele. Pearson's correlation coefficient (r) is generated from the data set (P = 0.0473, n = 210 time points in 33 cells). Scale bars, 3 µm.
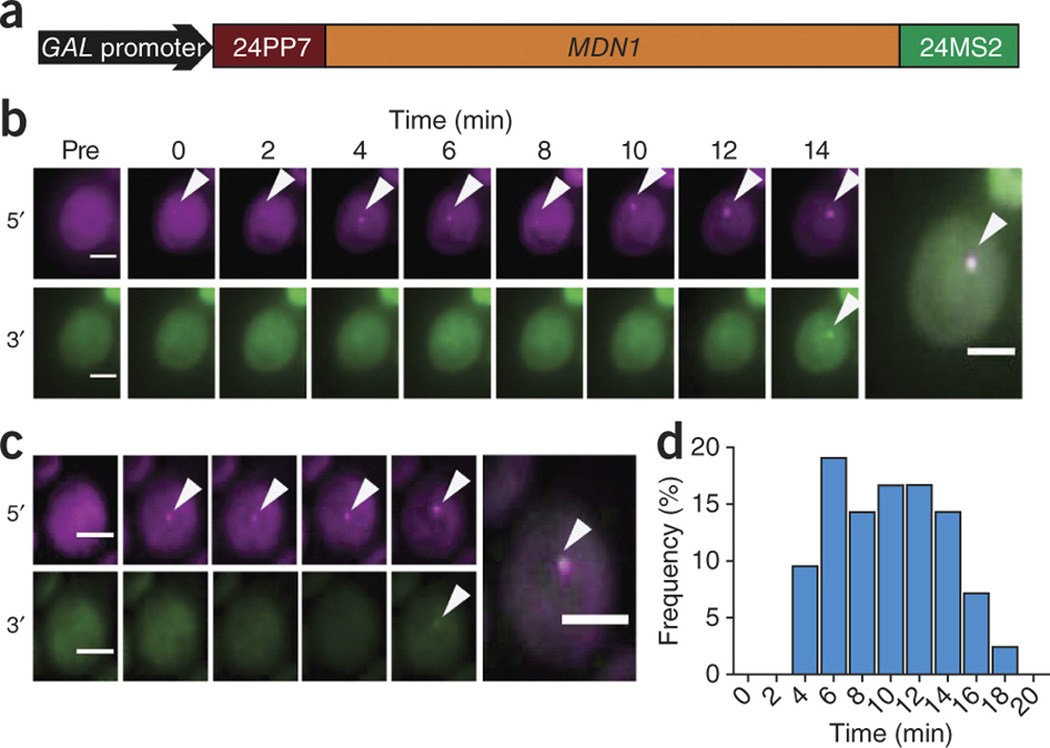
(a) Schematic depicting the intramolecular tagging of MDN1 placed under the control of a GAL-inducible promoter. (b,c) Appearance of 5′ (magenta) and 3′ (green) transcription site signals at indicated times after induction. Arrowheads denote transcription sites, and final frames show an overlay of both signals. (d) Histogram of the time delay between 5′ and 3′ signals, representing variability in pol II elongation rates (n = 42 cells). Scale bars, 3 µm.
References
Publication types
MeSH terms
Substances
Grants and funding
LinkOut - more resources
Full Text Sources
Other Literature Sources
Molecular Biology Databases
Research Materials
