

Molecular fingerprinting of cyanobacteria from river biofilms as a water quality monitoring tool
- PMID: 23263954
- PMCID: PMC3591963
- DOI: 10.1128/AEM.03351-12
Molecular fingerprinting of cyanobacteria from river biofilms as a water quality monitoring tool
Abstract
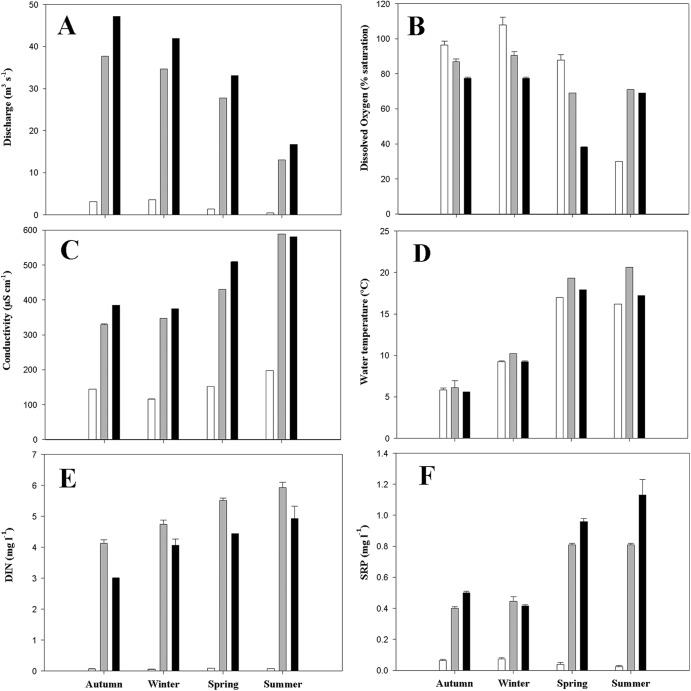
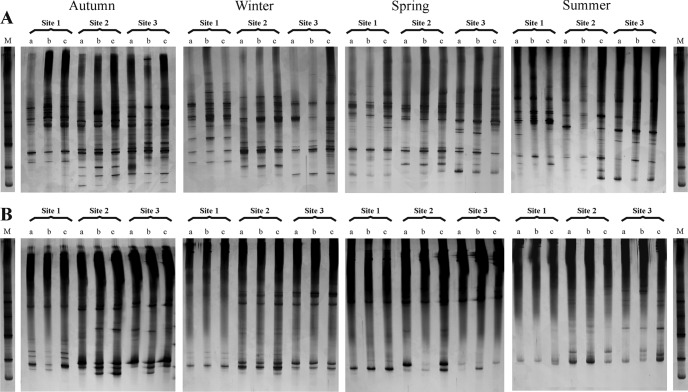
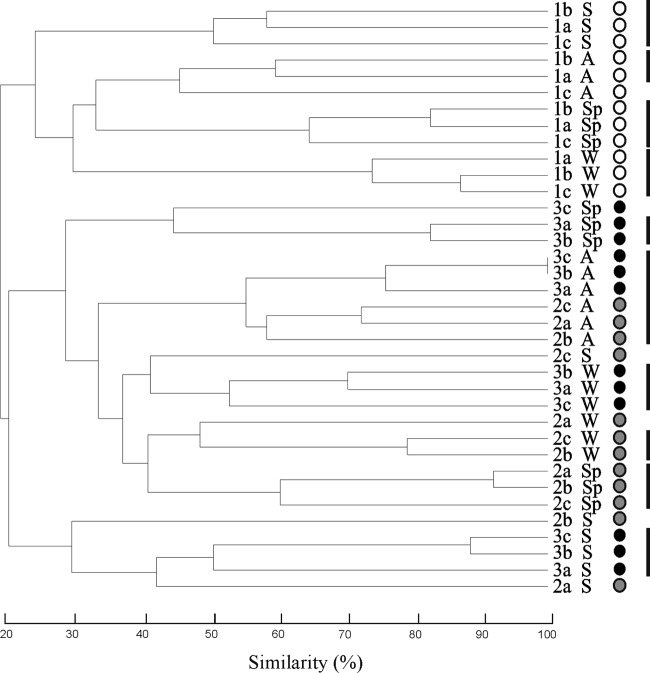
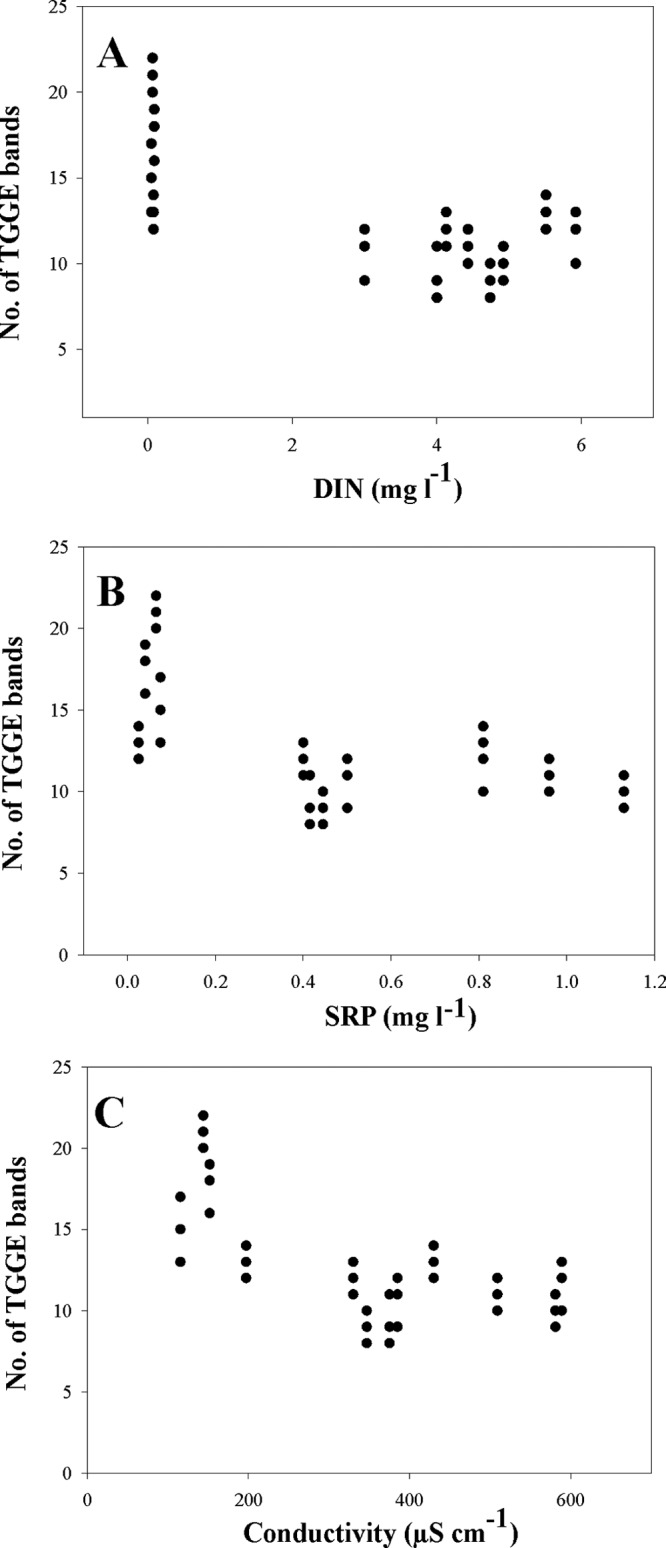
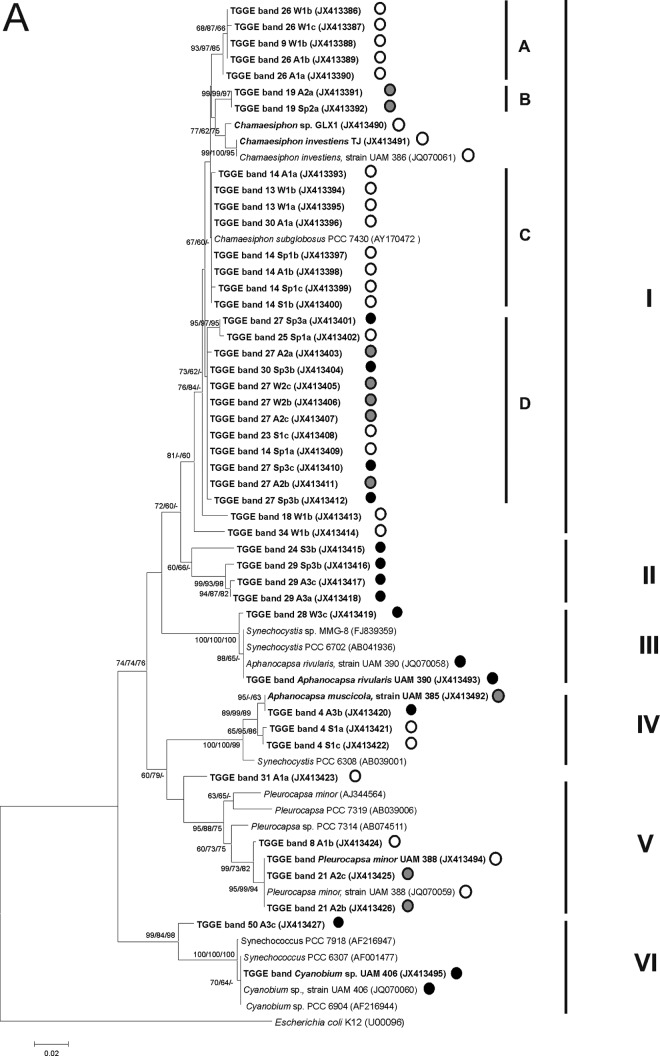
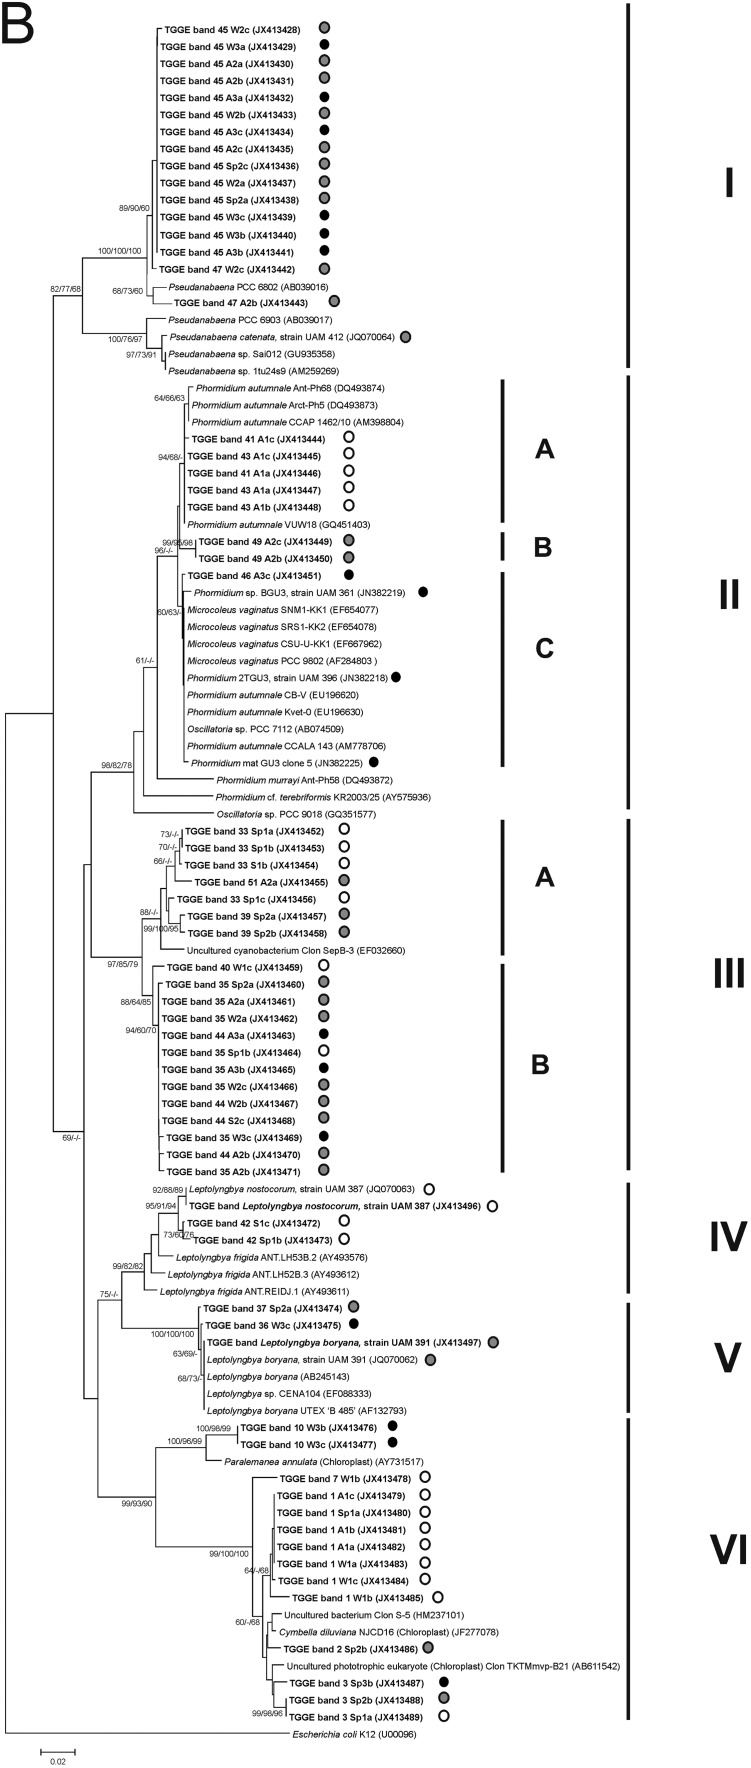
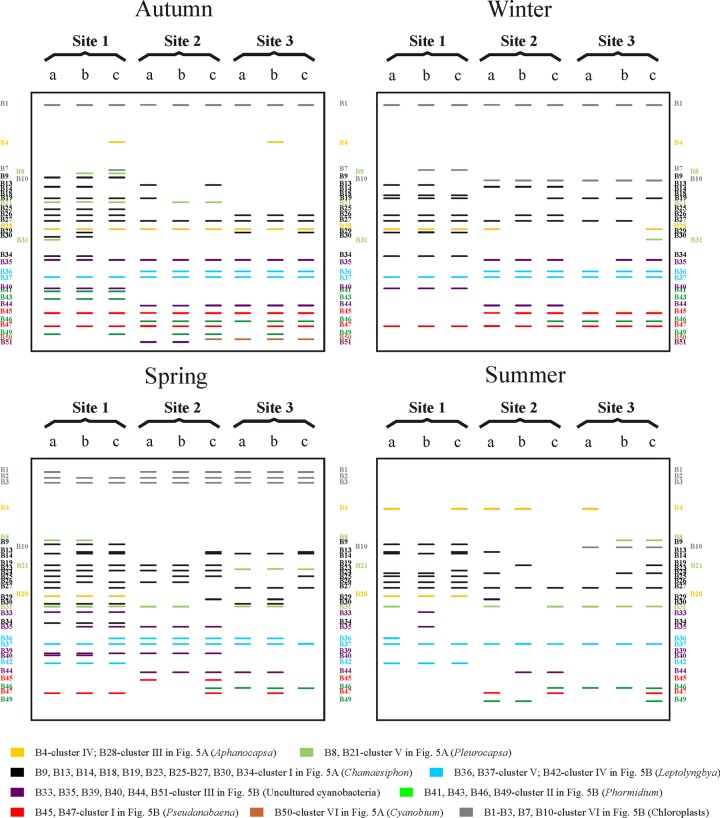
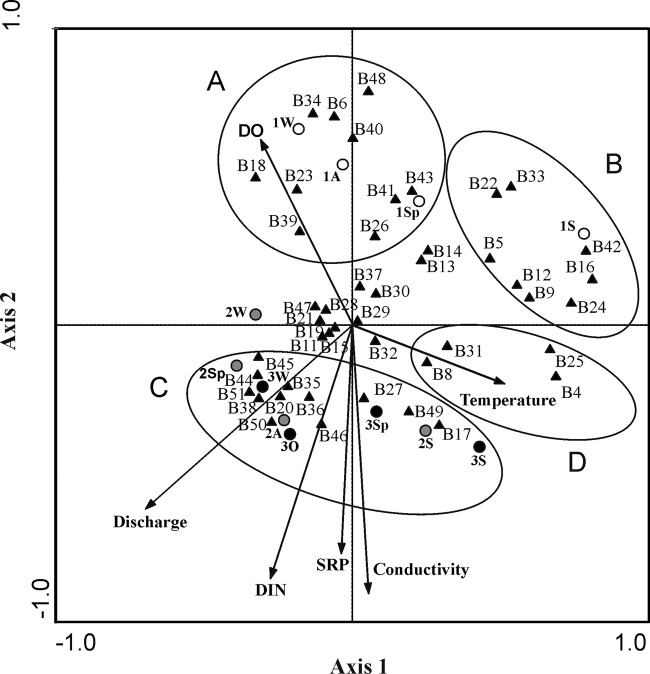
Benthic cyanobacterial communities from Guadarrama River (Spain) biofilms were examined using temperature gradient gel electrophoresis (TGGE), comparing the results with microscopic analyses of field-fixed samples and the genetic characterization of cultured isolates from the river. Changes in the structure and composition of cyanobacterial communities and their possible association with eutrophication in the river downstream were studied by examining complex TGGE patterns, band extraction, and subsequent sequencing of 16S rRNA gene fragments. Band profiles differed among sampling sites depending on differences in water quality. The results showed that TGGE band richness decreased in a downstream direction, and there was a clear clustering of phylotypes on the basis of their origins from different locations according to their ecological requirements. Multivariate analyses (cluster analysis and canonical correspondence analysis) corroborated these differences. Results were consistent with those obtained from microscopic observations of field-fixed samples. According to the phylogenetic analysis, morphotypes observed in natural samples were the most common phylotypes in the TGGE sequences. These phylotypes were closely related to Chamaesiphon, Aphanocapsa, Pleurocapsa, Cyanobium, Pseudanabaena, Phormidium, and Leptolyngbya. Differences in the populations in response to environmental variables, principally nutrient concentrations (dissolved inorganic nitrogen and soluble reactive phosphorus), were found. Some phylotypes were associated with low nutrient concentrations and high levels of dissolved oxygen, while other phylotypes were associated with eutrophic-hypertrophic conditions. These results support the view that once a community has been characterized and its genetic fingerprint obtained, this technique could be used for the purpose of monitoring rivers.
Figures
References
-
- Malmqvist B, Rundle S. 2002. Threats to the running water ecosystems of the world. Environ. Conserv. 29:134–153
-
- USEPA (United States Environmental Protection Agency) 2000. Nutrient criteria. Technical guidance manual. Rivers and streams. EPA-822-B-00-002 United States Environmental Protection Agency, Washington, DC
-
- European Communities (EC) 22 December 2000. Directive 2000/60/EC of the European Parliament and of the Council of the 23 October 2000 establishing a framework for community action in the field of water policy. Off. J. Eur. Communities. http://eur-lex.europa.eu/LexUriServ/LexUriServ.do?uri=OJ:L:2000:327:0001...
-
- Whitton BA. 2012. Changing approaches to monitoring during the period of the ‘Use of Algae for Monitoring Rivers’ symposia. Hydrobiologia 695:7–16
-
- Douterelo I, Perona E, Mateo P. 2004. Use of cyanobacteria to assess water quality in running waters. Environ. Pollut. 127:377–384 - PubMed
Publication types
MeSH terms
Substances
Associated data
- Actions
- Actions
- Actions
- Actions
- Actions
- Actions
- Actions
- Actions
- Actions
- Actions
- Actions
- Actions
- Actions
- Actions
- Actions
- Actions
- Actions
- Actions
- Actions
- Actions
- Actions
- Actions
- Actions
- Actions
- Actions
- Actions
- Actions
- Actions
- Actions
- Actions
- Actions
- Actions
- Actions
- Actions
- Actions
- Actions
- Actions
- Actions
- Actions
- Actions
- Actions
- Actions
- Actions
- Actions
- Actions
- Actions
- Actions
- Actions
- Actions
- Actions
- Actions
- Actions
- Actions
- Actions
- Actions
- Actions
- Actions
- Actions
- Actions
- Actions
- Actions
- Actions
- Actions
- Actions
- Actions
- Actions
- Actions
- Actions
- Actions
- Actions
- Actions
- Actions
- Actions
- Actions
- Actions
- Actions
- Actions
- Actions
- Actions
- Actions
- Actions
- Actions
- Actions
- Actions
- Actions
- Actions
- Actions
- Actions
- Actions
- Actions
- Actions
- Actions
- Actions
- Actions
- Actions
- Actions
- Actions
- Actions
- Actions
- Actions
- Actions
- Actions
- Actions
- Actions
- Actions
- Actions
- Actions
- Actions
- Actions
- Actions
- Actions
- Actions
LinkOut - more resources
Full Text Sources
Molecular Biology Databases
