. 2013 Mar;33(5):947-57.
doi: 10.1128/MCB.01436-12. Epub 2012 Dec 21.

Both CpG methylation and activation-induced deaminase are required for the fragility of the human bcl-2 major breakpoint region: implications for the timing of the breaks in the t(14;18) translocation

Affiliations

Both CpG methylation and activation-induced deaminase are required for the fragility of the human bcl-2 major breakpoint region: implications for the timing of the breaks in the t(14;18) translocation

Xiaoping Cui et al. Mol Cell Biol. 2013 Mar.

Abstract

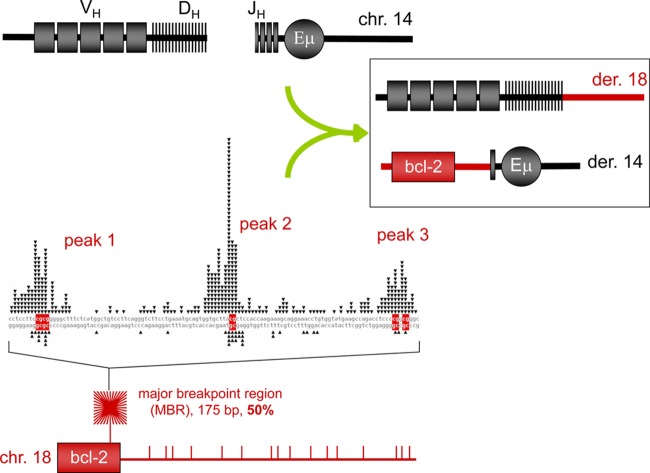
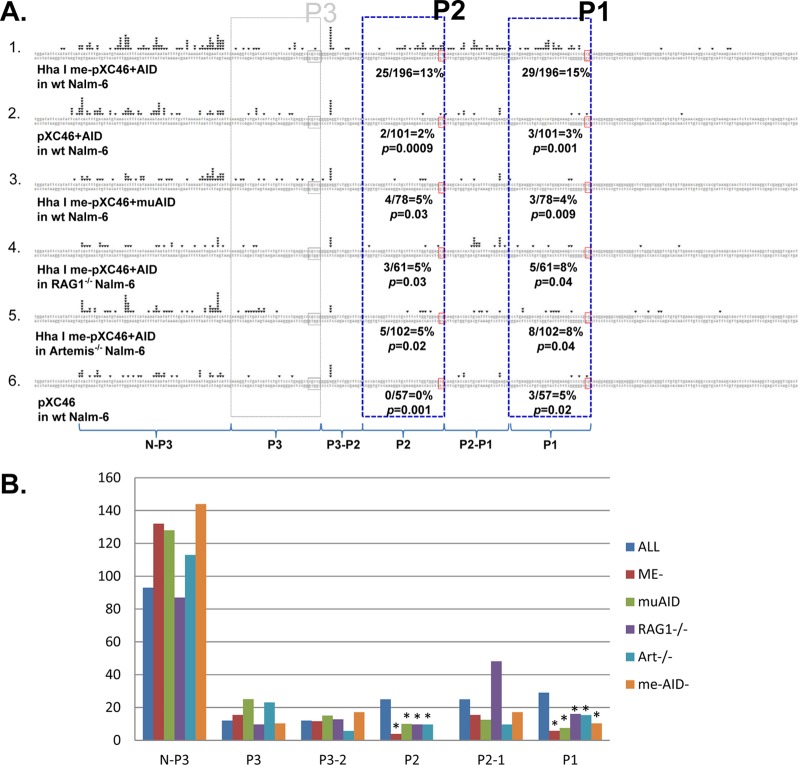
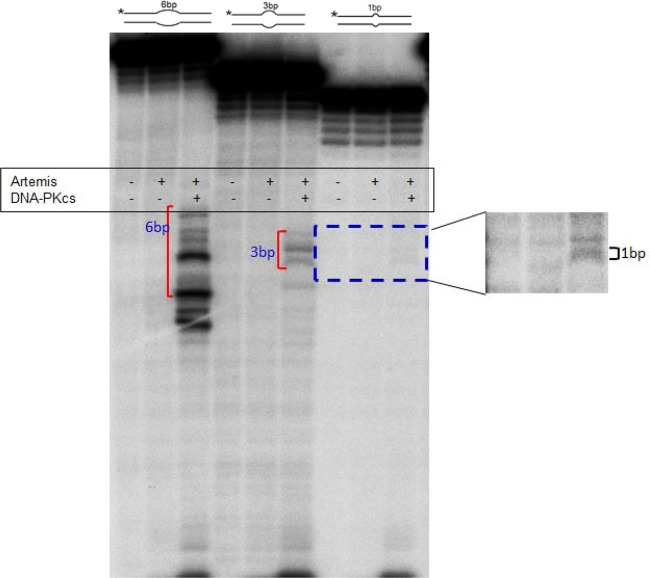
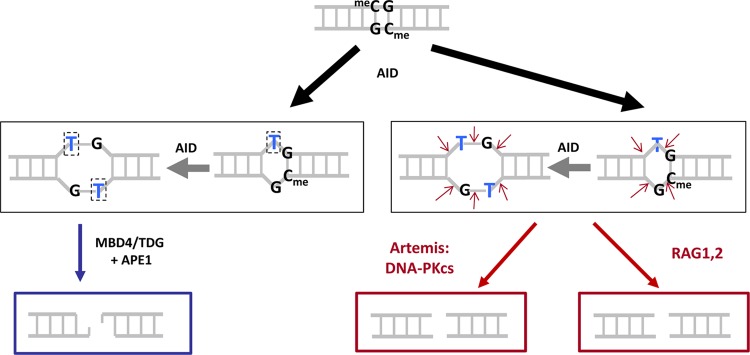
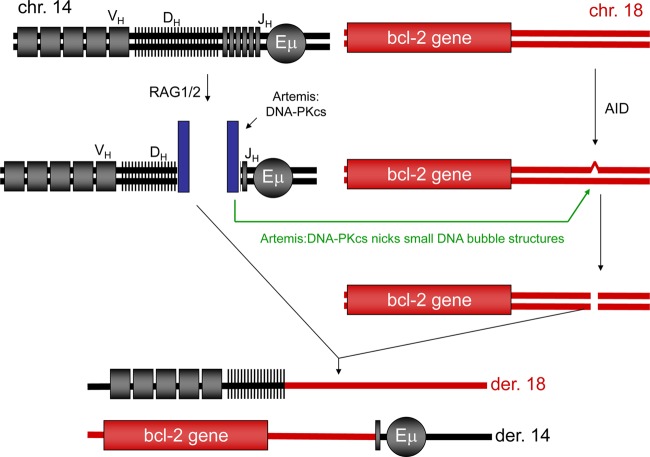
The t(14;18) chromosomal translocation typically involves breakage at the bcl-2 major breakpoint region (MBR) to cause human follicular lymphoma. A theory to explain the striking propensity of the MBR breaks at three CpG clusters within the 175-bp MBR region invoked activation-induced deaminase (AID). In a test of that theory, we used here minichromosomal substrates in human pre-B cell lines. Consistent with the essential elements of the theory, we found that the MBR breakage process is indeed highly dependent on DNA methylation at the CpG sites and highly dependent on the AID enzyme to create lesions at peak locations within the MBR. Interestingly, breakage of the phosphodiester bonds at the AID-initiated MBR lesions is RAG dependent, but, unexpectedly, most are also dependent on Artemis. We found that Artemis is capable of nicking small heteroduplex structures and is even able to nick single-base mismatches. This raises the possibility that activated Artemis, derived from the unjoined D to J(H) DNA ends at the IgH locus on chromosome 14, nicks AID-generated TG mismatches at methyl CpG sites, and this would explain why the breaks at the chromosome 18 MBR occur within the same time window as those on chromosome 14.


Figures

Fig 1
Fig 1
Diagram of bcl-2 translocation. The bcl-2 translocations occur between the IgH locus on chromosome 14, mostly during DH-to-JH recombination, and the bcl-2 locus on chromosome 18, mostly downstream of the coding portion of the bcl-2 gene. About 50% of patient translocation breaks occur within the 175-bp major breakpoint region (MBR), which is shown as the red starburst square at the bottom left and expanded to a sequence level above it. The MBR breakpoint distribution from follicular lymphoma patients show highly significant focusing on three CpG peaks (see DNA sequence in the middle left of figure). The side of the break closest to the bcl-2 gene (telomeric side) joins to the JH segment of IgH locus on chromosome 14 and becomes the derivative 14 (der 14). The centromeric side of the bcl-2 locus usually joins to the DH segment and becomes derivative 18 (der 18). In the DNA sequence of the MBR (middle left), the triangles on top of the sequence represent the breakpoints sequenced from the derivative chromosome 14, and the triangles on the bottom of the sequence represent breakpoints sequenced from the derivative chromosome 18. The bottom panel shows the approximate distribution propensity of translocation breakpoints occurring around the MBR region of the bcl-2 gene on chromosome 18 in human patients. The density of lines in the starburst square represents the number of breakpoints at the MBR region relative to breakpoint outside of the MBR region (shown as the vertical bars to the right of the starburst).
Fig 2
Fig 2
Summary of breakpoint locations for substrate pXC46. (A) Schematic graph of the pXC46 plasmid. The small squares represent three peaks in the MBR region. Red squares represent the methylated peaks. The triangles represent 12RSS and 23RSS. The arrows represent the relative positions of primers for nested PCR assays. Given that there is NHEJ nucleolytic resection after DSBs occur, a 30-bp zone of interest was delineated at each peak region, designated by two vertical dashed lines. A 30-bp zone of interest is also demarcated for V(D)J recombination breaks at the 12/23RSS coding region. (B) The middle columns of the table show percentages of breakpoints occurring at peak 1, 2, or 3. The right part of the table shows percentages of deletions that have a left side boundary among the MBR peaks and a right side boundary near the 23 coding end (within 30 bp of the 23RSS heptamer). Each data number in this figure is the sum of 4 to 12 independent experiments. The P values connected by solid red lines were calculated using a Student t test comparison between the line 1 values for peak 1 and all of the conditions for peak 1 in lines 2 to 6. The same applies to peak 2 comparisons of line 1 with lines 2 to 6. *, P values connected with the dashed red line represent chi-square test comparisons of methylated peak 1 or peak 2 with the nonmethylated peak 3 when all of the factors are present (line 1). Note that when peaks 1 and 2 are not the focus of breakage, due to omission of one factor (e.g., no CpG methylation, use of mutant AID, or knockout of Artemis), then it is not surprising that the percentage of breaks at all other locations rise, as we see for peak 3 in lines 2, 3, and 5.
Fig 3
Fig 3
Breakpoint distributions around the bcl-2 MBR. (A) Breakpoint distributions for the substrate pXC46. Each inverted triangle represents one breakpoint. The region of sequence in this plot includes (from left to right) 285 bp from human MBR gene (chromosome 18 reverse strand: bp 60793336 to 60793620). Peak 1 (bp 60793548 to 60793551) and peak 2 (bp 60793493 to 60793495) are labeled in a small rectangle with solid lines and are methylated by HhaI methyltransferase except in the group for which methylation is absent. Each line represents one experimental condition, as labeled under each line of sequence. The positions of peaks 1, 2, and 3 are marked above the figure, and the 30-bp zone of interest of each peak is also shown in a large rectangle with dashed lines. The breakpoints plotted are collected from all of the experiments for each group. (B) Comparisons based on normalization. As an alternative to the Student t test, we also compared the conditions of lines 1 to 6 of panel 1 by normalizing the total number of events in lines 2 to 6 to the number in line 1. We divided the left-side break event locations into the peak 1, 2, and 3 zones, as well as the additional zones of events between peaks 1 and 2 (P2-1), between peaks 2 and 3 (P3-2), and upstream of peak 3 (N-P3). For each zone, the normalized number of events for lines 1 to 6 are shown from left to right. Many events are detected to the left of peak 3 because the AT-rich region favors paused and short PCR products, but the differences between conditions are not substantial. Only peaks 1 and 2, when all factors are present (line 1), are significantly higher than all of the other conditions (lines 2 to 6), and this was tested using the chi-square test on the normalized number of events within each peak box versus the normalized total. The significance (P < 0.05) is designated by an asterisk. Chi-square analysis was not run on the other zones. For the P2-1 zone, the large value of the line 4 condition (no RAG1) is likely because AID is present, and most of the breaks in this zone are near a WGCW site, which is a preferred AID motif (35).
Fig 4
Fig 4
Artemis:DNA-PKcs complex nicking at bubble structures. Oligonucleotide DNA substrates (with 6-bp, 3-bp, or 1-bp bubble structure in the middle and each arm 15 bp long) were incubated in the absence or presence of Artemis and DNA-PKcs. The diagrams above the gel show the DNA structure and size of the bubble of each substrate. The asterisk indicates the position of the 5′ end labeling. The products of the 6- and 3-bp bubble substrates are indicated by a bracket. The product of the 1-bp bubble substrate was darkened to give better illustration and is more apparent in the right panel.
Fig 5
Fig 5
Three mechanisms for generating CpG-type DSBs. Deamination by AID at a methylcytosine within a CpG creates a TG mismatch (black arrow). A second deamination (gray arrow) by AID could occur on the antiparallel strand—an event that would be favored by breathing due to the initial TG mismatch—and this would generate a TG/TG double mismatch or 2-bp bubble structure (middle row). Once the single- or double-mismatch structures are generated, these could be converted to DSBs by any of three mechanisms. (Left) The MBD4 or TDG glycosylases can remove the thymines to generate abasic sites at the boxed Ts, and APE1 could cut 5′ of each of these abasic sites. (Middle) Artemis:DNA-PKcs, upon activation, could nick both strands to create a DSB. (Right) The RAG complex could nick both strands to create a DSB.
Fig 6
Fig 6
Model for the simultaneity of DSBs at chromosome 14 IgH and the bcl-2 MBR at chromosome 18. After RAG-generated DSBs at the IgH locus, unjoined DH and JH DNA ends activate the Artemis:DNA-PKcs complex. The activated Artemis:DNA-PKcs complexes can nick at TG mismatches. Initiation of repair at TG mismatches (by TDG or MBD4) is known to be 1,000- to 2,500-fold slower than at UG mismatches (by uracil glycosylase). The model here would explain how these long-lived TG mismatch lesions would be vulnerable to conversion to DSBs at the same time that free DH and JH ends exist at the IgH locus on chromosome 14. This also would explain why AID-initiated lesions would not accumulate as NHEJ deletional lesions within the MBR over time. This is because TG mismatches would eventually be corrected back to CG. The only instance when a TG mismatch would be converted to a DSB is under the rare circumstance when activated Artemis:DNA-PKcs at a DH or a JH end comes close to the TG lesion at chromosome 18.

References

    1. Tsai AG, Lu H, Raghavan SC, Muschen M, Hsieh CL, Lieber MR. 2008. Human chromosomal translocations at CpG sites and a theoretical basis for their lineage and stage specificity. Cell 135: 1130–1142 - PMC - PubMed
    1. Boboila C, Alt FW, Schwer B. 2012. Classical and alternative end-joining pathways for repair of lymphocyte-specific and general DNA double-strand breaks. Adv. Immunol. 116: 1–49 - PubMed
    1. Gostissa M, Alt FW, Chiarle R. 2011. Mechanisms that promote and suppress chromosomal translocations in lymphocytes. Annu. Rev. Immunol. 29: 319–350 - PubMed
    1. Hakim O, Resch W, Yamane A, Klein I, Kieffer-Kwon KR, Jankovic M, Oliveira T, Bothmer A, Voss TC, Ansarah-Sobrinho C, Mathe E, Liang G, Cobell J, Nakahashi H, Robbiani DF, Nussenzweig A, Hager GL, Nussenzweig MC, Casellas R. 2012. DNA damage defines sites of recurrent chromosomal translocations in B lymphocytes. Nature 484: 69–74 - PMC - PubMed
    1. Zhang Y, McCord RP, Ho YJ, Lajoie BR, Hildebrand DG, Simon AC, Becker MS, Alt FW, Dekker J. 2012. Spatial organization of the mouse genome and its role in recurrent chromosomal translocations. Cell 148: 908–921 - PMC - PubMed

Publication types

MeSH terms