. 2013 Mar;33(5):974-83.
doi: 10.1128/MCB.01014-12. Epub 2012 Dec 21.

Transient JMJD2B-mediated reduction of H3K9me3 levels improves reprogramming of embryonic stem cells into cloned embryos

Affiliations

Transient JMJD2B-mediated reduction of H3K9me3 levels improves reprogramming of embryonic stem cells into cloned embryos

Jisha Antony et al. Mol Cell Biol. 2013 Mar.

Abstract

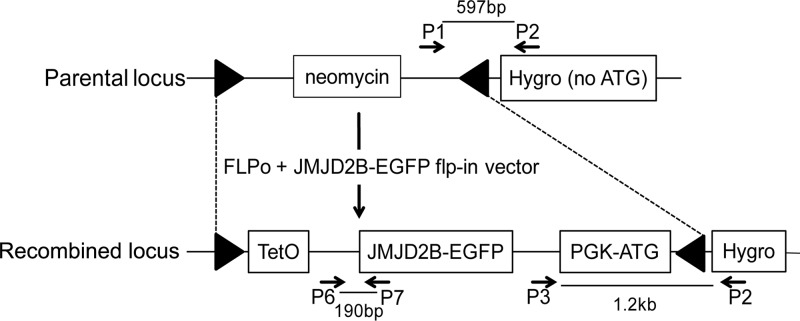
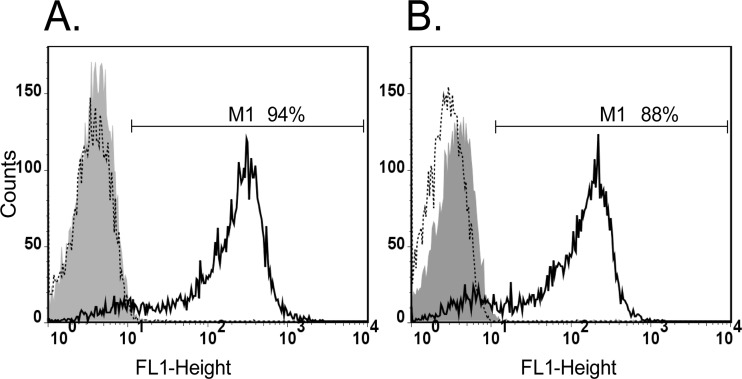
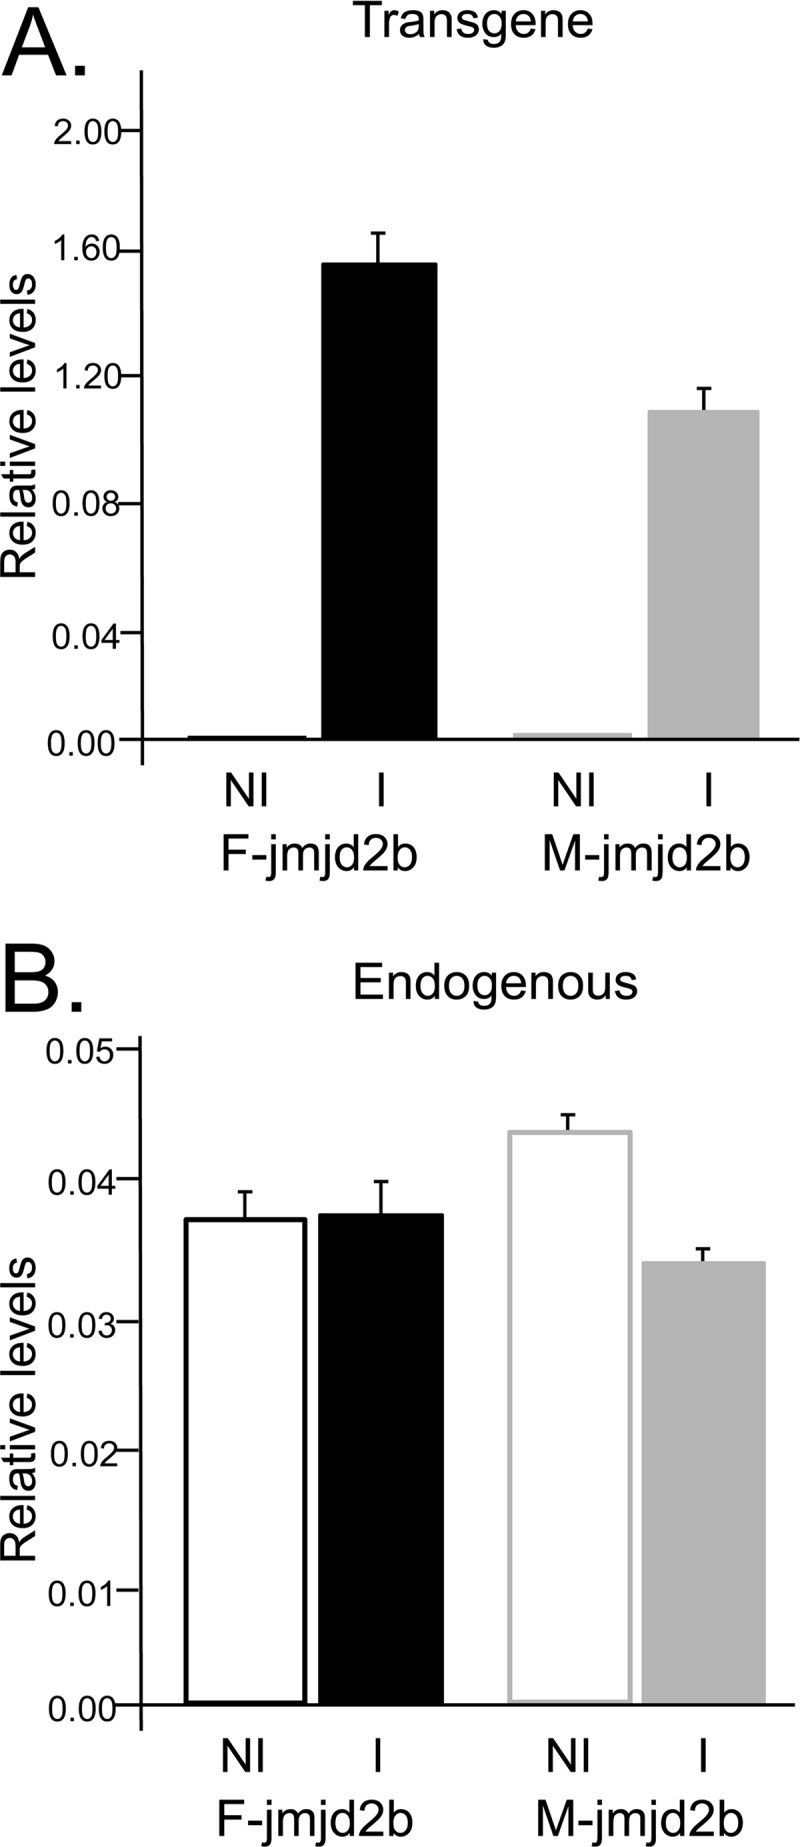
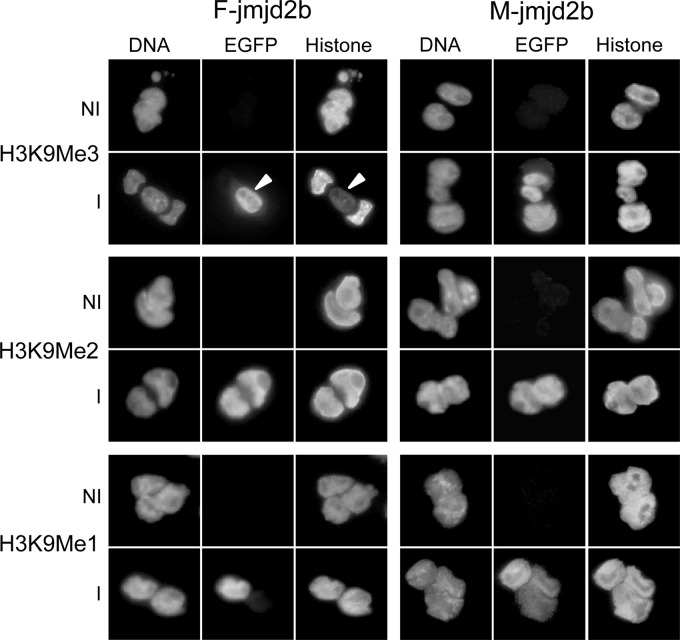
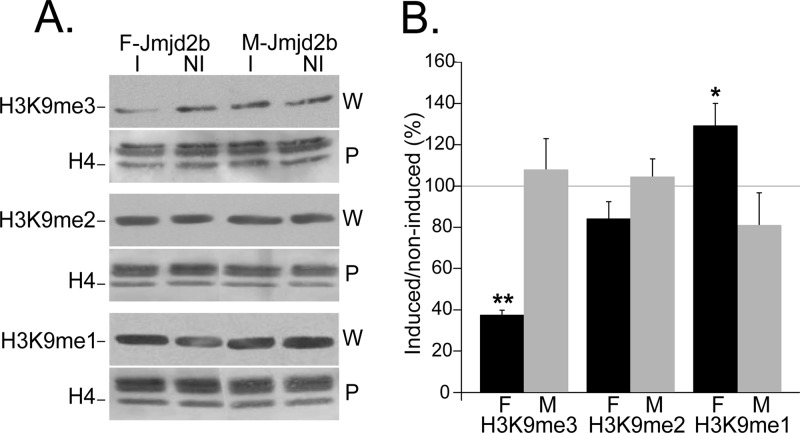
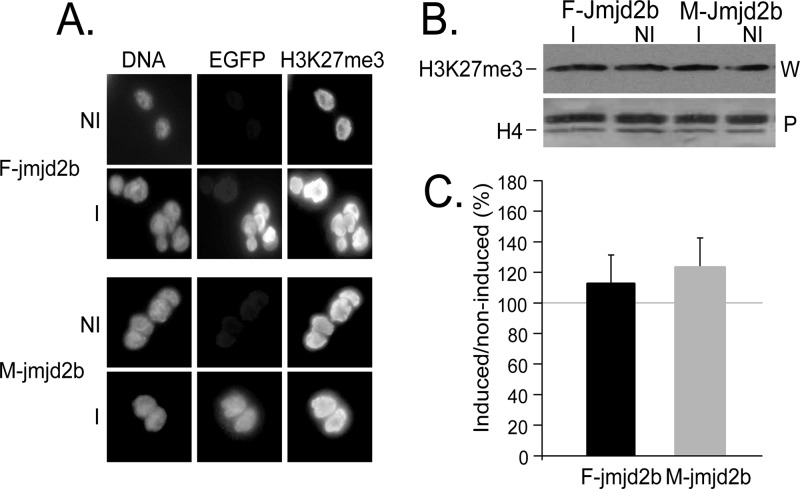
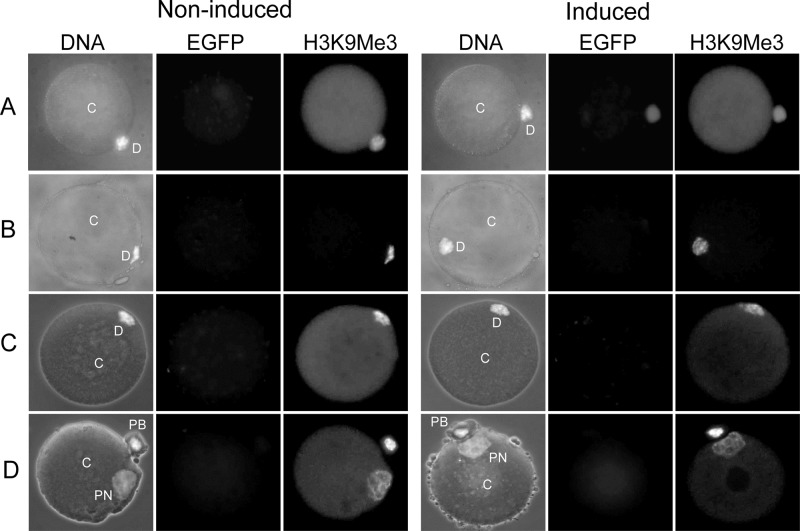
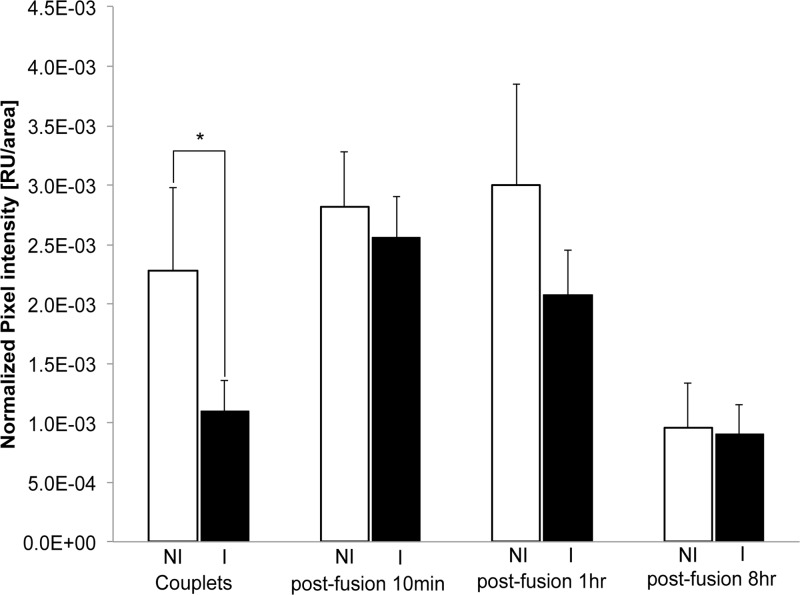
Correct reprogramming of epigenetic marks in the donor nuclei is crucial for successful cloning by nuclear transfer. Specific epigenetic modifications, such as repressive histone lysine methylation marks, are known to be very stable and difficult to reprogram. The discovery of histone lysine demethylases has opened up opportunities to study the effects of removing repressive histone lysine methylation marks in donor cells prior to nuclear transfer. In this study, we generated mouse embryonic stem (ES) cells for the inducible expression of JMJD2B (also known as KDM4B), a demethylase that primarily removes the histone-3 lysine-9 trimethylation (H3K9me3) mark. Induction of jmjd2b in the ES cells decreased total levels of H3K9me3 by 63%. When these cells were used for nuclear transfer, H3K9me3 levels were normalized within minutes following fusion with an enucleated oocyte. This transient reduction of H3K9me3 levels improved in vitro development into cloned embryos by 30%.


Figures

Fig 1
Fig 1
Schematic representation of the parental and modified Col1A1 locus jmjd2b-egfp Flp-In. The parental locus consists of a neomycin resistance gene flanked by FRT sites (triangles) and a promoterless hygromycin resistance gene that lacks an ATG start codon [Hygro (no ATG)]. Correct FLPo-mediated insertion of the jmjd2b vector replaces the neomycin cassette with the TetO-controlled jmjd2b-egfp gene and converts the nonfunctional Hygro (no ATG) into a functional selection cassette (Hygro) by providing a phosphoglycerate kinase promoter and ATG (PGK-ATG). Binding sites of primers (arrows) used for the characterization of ES clones with correct Flp-In (primers P1 to P3) and transgene-specific qRT-PCR (primers P6 and P7) and the resulting amplicon sizes are indicated.
Fig 2
Fig 2
Flow cytometry analyses of jmjd2b-egfp induction. Green fluorescence generated by F-jmjd2b (A) and M-jmjd2b (B) ES cells was determined using the FL1 emission channel. The range of intensities for green fluorescent cells (M1) is indicated. The relative cell numbers are plotted as a function of variable intensities of green fluorescence from individual cells. Gray filled graph, noninduced cells; solid-line graph, induced cells; dotted-line graph, induced cells 24 h after removal of doxycycline.
Fig 3
Fig 3
jmjd2b expression levels. Shown are the relative expression levels of transgene-derived jmjd2b (A) and endogenous jmjd2b (B) compared to the geometric mean of four housekeeping genes. Results for induced (I) and noninduced (NI) F-jmjd2b and M-jmjd2b ES cells are averages of 3 to 6 replicates, with error bars depicting the SEMs.
Fig 4
Fig 4
Immunofluorescence analysis of histone modifications in induced (I) and noninduced (NI) F- and M-jmjd2b ES cells. Cells were costained for DNA and with antibodies specific for EGFP and the indicated histone modification. The arrowheads indicate an induced cell next to two noninduced cells, highlighting the specific reduction of H3K9me3 in induced cells.
Fig 5
Fig 5
JMJD2B-dependent changes in levels of H3K9 methylation states. Histone extracts from induced (I) and noninduced (NI) F- and M-jmjd2b cells were quantified for the indicated histone modifications by Western analysis. (A) Representative immunoblots for the indicated H3K9 methylation mark. For each modification, the top panel (W) is the immunoblot and the bottom panel (P) is the respective Ponceau S-stained blot. The H4 band that was used for normalization is indicated in the Ponceau S-stained blot. (B) Results represent H3K9 methylation levels in induced cells as a percentage of the levels in noninduced cells. F, F-jmjd2b cells; M, M-jmjd2b cells; error bars, SEMs determined from 3 repeats; asterisks, significant changes (**, P < 0.01; *, P = 0.074, determined by two-tailed paired t test on log expressions).
Fig 6
Fig 6
Analysis of H3K27me3 in jmjd2b ES cells. H3K27me3 levels in induced (I) and noninduced (NI) F- and M-jmjd2b ES cells were analyzed by immunofluorescence (A) and Western blot quantification (B). For the detection by immunofluorescence, cells were costained for DNA and antibodies specific for EGFP and H3K27me3. For the Western blot quantification, shown are the representative immunoblot (W) and the Ponceau S-stained blot (P). The H4 band that was used for normalization is indicated in the Ponceau S-stained blot. The quantification of induced H3K27me3 levels by Western analysis is presented as a percentage of the levels for noninduced cells. Error bars, SEMs determined from 2 repeats.
Fig 7
Fig 7
H3K9me3 in NT reconstructs generated from induced and noninduced F-jmjd2b ES cells. NT reconstructs were fixed and costained for DNA (H33342) and antibodies specific for EGFP and H3K9me3 prior to fusion of the donor cells with enucleated oocytes (A), 10 min after fusion with the oocyte (B), 1 h after fusion (C), and 8 h after fusion (D). Incorporation of the donor cells into the enucleated oocyte cytoplasm was monitored under a microscope. DNA images are merged images of phase-contrast and H33342-stained images. C, cytoplast; D, donor nucleus; PN, pronucleus; PB, polar body.
Fig 8
Fig 8
Quantification of H3K9me3 in NT reconstructs generated from induced and noninduced F-jmjd2b ES cells. Shown is the normalized pixel intensity for noninduced (NI) and induced (I) F-jmjd2b ES donor cells attached to enucleated oocytes (or cytoplast marked C in Fig. 7) prior to fusion (couplets; noninduced, n = 12; induced, n = 11) and NT reconstructs 10 min (noninduced, n = 14; induced, n = 13), 1 h (noninduced, n = 8; induced, n = 9), and 8 h (noninduced, n = 8; induced, n = 9) after fusion of the donor nuclei (marked D in Fig. 7) and cytoplast. Note that due to differences in the exposure times for different developmental reconstruct stages, only values of induced versus noninduced of the same reconstruct stage are directly comparable. Error bars depict SEMs. RU, relative units; *, significant (P < 0.05) difference determined by two-tailed paired t test.

References

    1. Armstrong L, Lako M, Dean W, Stojkovic M. 2006. Epigenetic modification is central to genome reprogramming in somatic cell nuclear transfer. Stem Cells 24: 805– 814 - PubMed
    1. Fujita N, Wade PA. 2004. Nuclear transfer: epigenetics pays a visit. Nat. Cell Biol. 6: 920– 922 - PubMed
    1. Morgan HD, Santos F, Green K, Dean W, Reik W. 2005. Epigenetic reprogramming in mammals. Hum. Mol. Genet. 14(Spec No. 1):R47–R58 - PubMed
    1. Rideout WM, III, Eggan K, Jaenisch R. 2001. Nuclear cloning and epigenetic reprogramming of the genome. Science 293: 1093– 1098 - PubMed
    1. Santos F, Dean W. 2004. Epigenetic reprogramming during early development in mammals. Reproduction 127: 643– 651 - PubMed

Publication types

MeSH terms