. 2013 Jan;64(2):495-505.
doi: 10.1093/jxb/ers347. Epub 2012 Dec 21.

Smaller, faster stomata: scaling of stomatal size, rate of response, and stomatal conductance

Affiliations

Smaller, faster stomata: scaling of stomatal size, rate of response, and stomatal conductance

Paul L Drake et al. J Exp Bot. 2013 Jan.

Abstract

Maximum and minimum stomatal conductance, as well as stomatal size and rate of response, are known to vary widely across plant species, but the functional relationship between these static and dynamic stomatal properties is unknown. The objective of this study was to test three hypotheses: (i) operating stomatal conductance under standard conditions (g (op)) correlates with minimum stomatal conductance prior to morning light [g (min(dawn))]; (ii) stomatal size (S) is negatively correlated with g (op) and the maximum rate of stomatal opening in response to light, (dg/dt)(max); and (iii) g (op) correlates negatively with instantaneous water-use efficiency (WUE) despite positive correlations with maximum rate of carboxylation (Vc (max)) and light-saturated rate of electron transport (J (max)). Using five closely related species of the genus Banksia, the above variables were measured, and it was found that all three hypotheses were supported by the results. Overall, this indicates that leaves built for higher rates of gas exchange have smaller stomata and faster dynamic characteristics. With the aid of a stomatal control model, it is demonstrated that higher g (op) can potentially expose plants to larger tissue water potential gradients, and that faster stomatal response times can help offset this risk.


Figures

Fig. 1.
Fig. 1.
The different phases of stomatal conductance examined in this study: g min, steady-state stomatal conductance in darkness, either at dawn [g min(dawn)] or after suddenly induced darkness [g min(day)]; (dg/dt)max, the maximum rate of change of g during light-induced stomatal opening; g op, steady-state operating stomatal conductance under standardized ideal conditions (see the Materials and methods); t 50, time taken to reach 50% of the range between g min and g op; g min(abs), the absolute minimum steady-state stomatal conductance after leaf excision, assumed to result from zero turgor in stomatal guard cells.
Fig. 2.
Fig. 2.
Idealized distribution of Banksia species on the Gnangara Groundwater Mound with respect to depth to groundwater (see Table 1) and unsaturated soil volume. Banksia littoralis occurs only in association with watercourses and wetland habitats, and is excluded from dune crests occupied by Banksia attenuata and Banksia menzeisii. Accordingly, B. littoralis has a highly restricted geographical distribution, while B. attenuata and B. menzeisii have a more extensive geographical distribution encompassing several hydrological habitats. Adapted from Lam et al. (2004) with kind permission of R.H. Froend. Inset: illustrating the range of leaf size and shape across the study species.
Fig. 3.
Fig. 3.
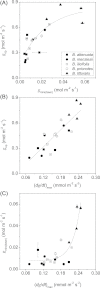
Relationship between g op, g min(dawn), and (dg/dt)max. (A) Across individuals, g op was positively correlated with g min(dawn). Each point represents the mean ±SE of n=6 consecutive steady-state records for an individual plant. The maximum rate of stomatal opening (dg/dt)max was positively correlated with maximum steady-state stomatal conductance, g op (B) and minimum stomatal conductance induced by darkness, gmin(day) (C).
Fig. 4.
Fig. 4.
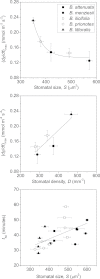
Smaller, faster stomata. The maximum rate of stomatal opening (dg/dt)max was negatively correlated with maximum stomatal size, S (A) and positively correlated with stomtal density, D (B). The time to reach 50% of the range between g min(dawn) and g op (t 50) was positively correlated with stomatal size (C).
Fig. 5.
Fig. 5.
Time-series of stomatal opening and CO2 assimilation rate in response to light. Each point is the mean ±SE stomatal conductance (g; A–E) and assimilation rate (A; F–J) measured at discrete time intervals (n=4 plants per species). The letter ‘I’ in each graph indicates the start of the illumination phase, when leaves were exposed to a PAR of 1500 µmol m–2 s–1. Prior to this point, leaves were darkened (PAR=0 µmol m–2 s–1).
Fig. 6.
Fig. 6.
Relationship between CO2 assimilation rate (A), stomatal conductance (g), and instantaneous water-use efficiency (WUE). (A) Instantaneous A versus instantaneous g; (B) instantaneous WUE versus g. Note the peak in WUE at around the same A for all species (~5 µmol m–2 s–1). (C) Negative correlation between WUE and steady-state operating stomatal conductance, g op.
Fig. 7.
Fig. 7.
The maximum (operating) photosynthetic rate A op was positively correlated with the maximum rate of carboxylation, Vc max (A) and the light-saturated rate of electron transport, J max (B).
Fig. 8.
Fig. 8.
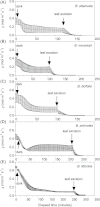
Incomplete stomatal closure in the dark. Following a sudden transition from 1500 to 0 PAR (indicated by the arrow labelled ‘dark’), stomatal conductance (g) declined to a steady-state minimum [g min(day), see Fig. 1]. Further reduction in g occurred after leaf excision (indicated by the arrow), reaching the absolute minimum conductance [g min(abs)] after desiccation induced the complete loss of guard cell turgor. (A–E) The time-series of g for each species (mean ±SE, n=4 plants per species).
Fig. 9.
Fig. 9.
Simulations based on the data and model in Franks (2006) show that following an increase in evaporative demand (leaf-to-air vapour pressure difference, VPD), plants that operate with higher stomtatal conductance (g op) are exposed to larger water potential gradients (shown here for leaves, ΔΨleaf; A), even though they have inherently larger maximum leaf hydraulic conductance, k leaf(max) (B). For illustrative purposes, two operating stomatal conductances are contrasted with one another (0.10mol m–2 s–1 and 0.20mol m–2 s–1 at 1 kPa VPD), with their initial and final values indicated by the start and end point (respectively) of the arrows. A faster response time reduces the duration of exposure to excessive water potential gradients.

Similar articles

Cited by

References

    1. Aasama K, Sõber A, Rahi M. 2001. Leaf anatomical characteristics associated with shoot hydraulic conductance, stomatal conductance and stomatal sensitivity to changes of leaf water status in temperate deciduous trees. Australian Journal of Plant Physiology 28, 765–774
    1. Anderson JE, Williams J, Kriedemann PE, Austin MP, Farquhar GD. 1996. Correlations between carbon isotope discrimination and climate of native habitats for diverse eucalypt taxa growing in a common garden. Australian Journal of Plant Physiology 23, 311–320
    1. Assmann SM, Grantz DA. 1990. Stomatal response to humidity in sugarcane and soybean: effect of vapour pressure difference on the kinetics of the blue light response. Plant, Cell and Environment 13, 163–169
    1. Barbour MM, Buckley TN. 2007. The stomatal response to evaporative demand persists at night in Ricinus communis plants with high nocturnal conductance. Plant, Cell and Environment 30, 711–721 - PubMed
    1. Barbour MM, Cernusak LA, Whitehead D, Griffin KL, Turnbull MH, Tissue DT, Farquhar GD. 2005. Nocturnal stomatal conductance and implications for modelling δ18O of leaf-respired CO2 in temperate tree species. Functional Plant Biology 32, 1107–1121 - PubMed

Publication types