. 2013 Mar;6(2):489-502.
doi: 10.1242/dmm.010884. Epub 2012 Dec 20.

A patient-derived stem cell model of hereditary spastic paraplegia with SPAST mutations

Affiliations

A patient-derived stem cell model of hereditary spastic paraplegia with SPAST mutations

Greger Abrahamsen et al. Dis Model Mech. 2013 Mar.

Erratum in

Abstract

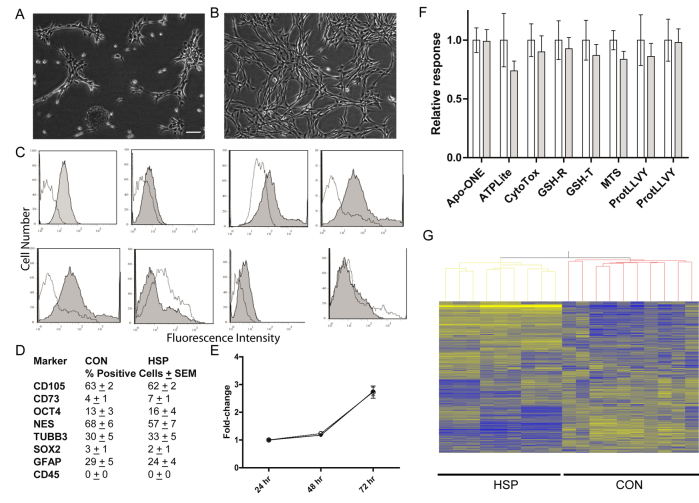
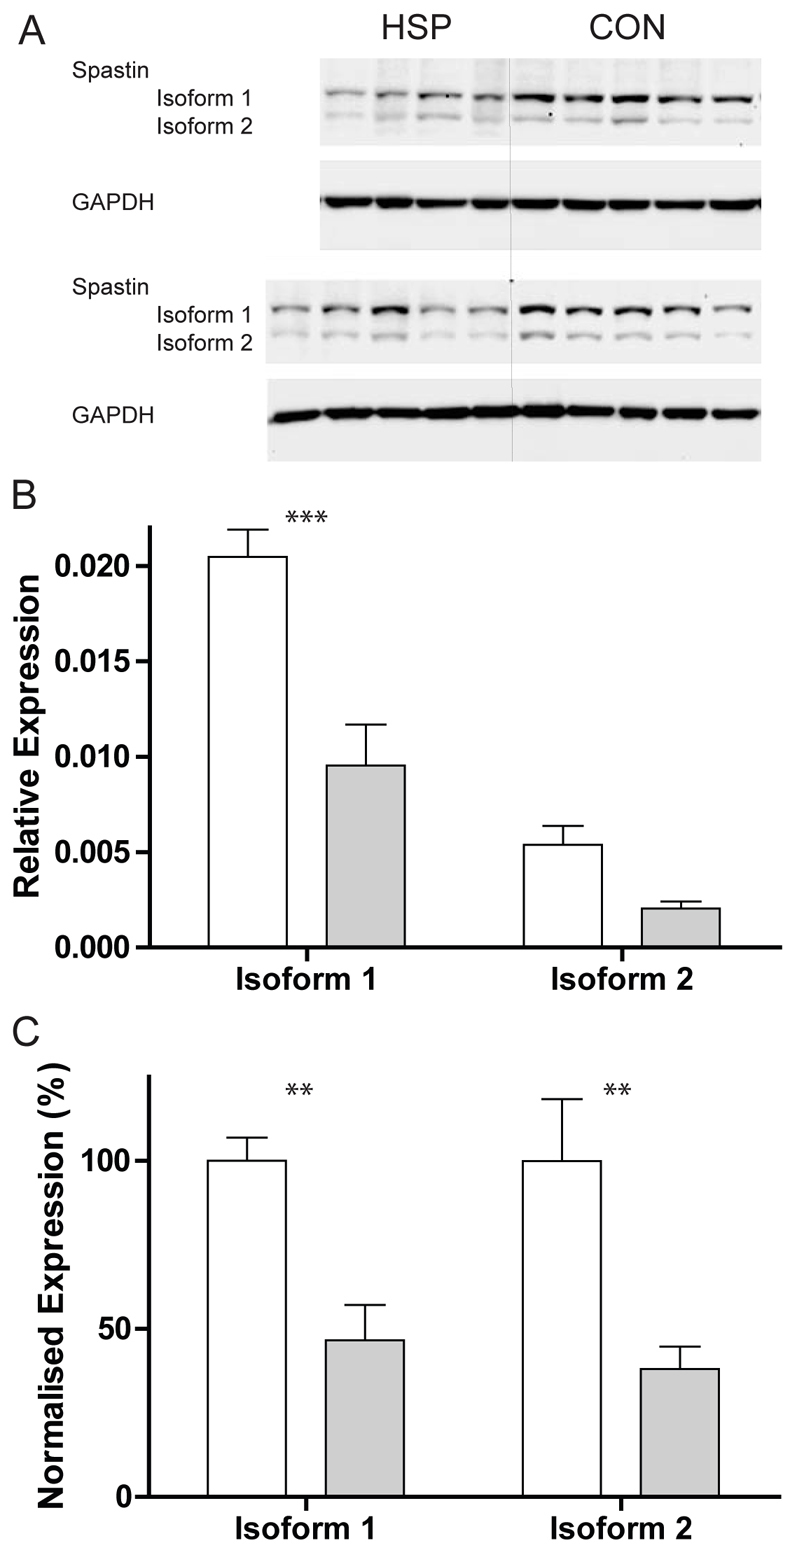
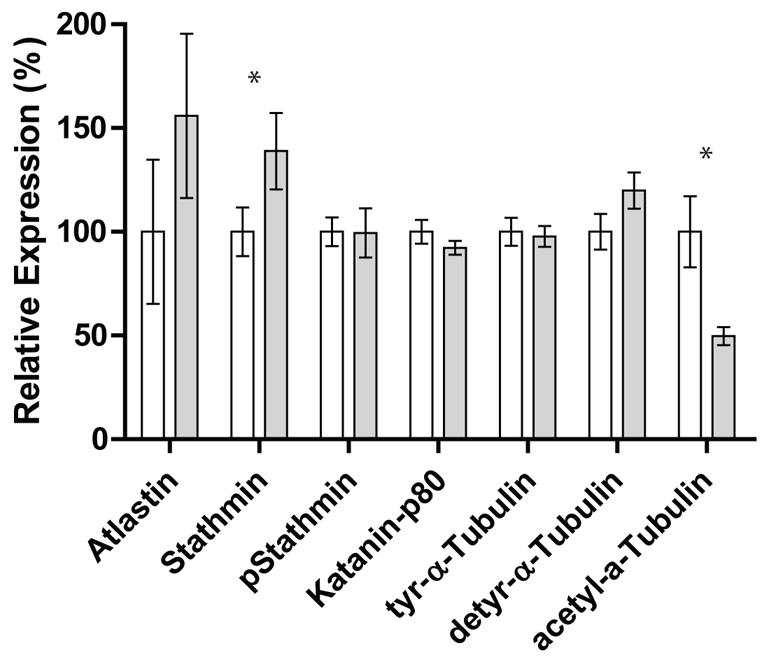
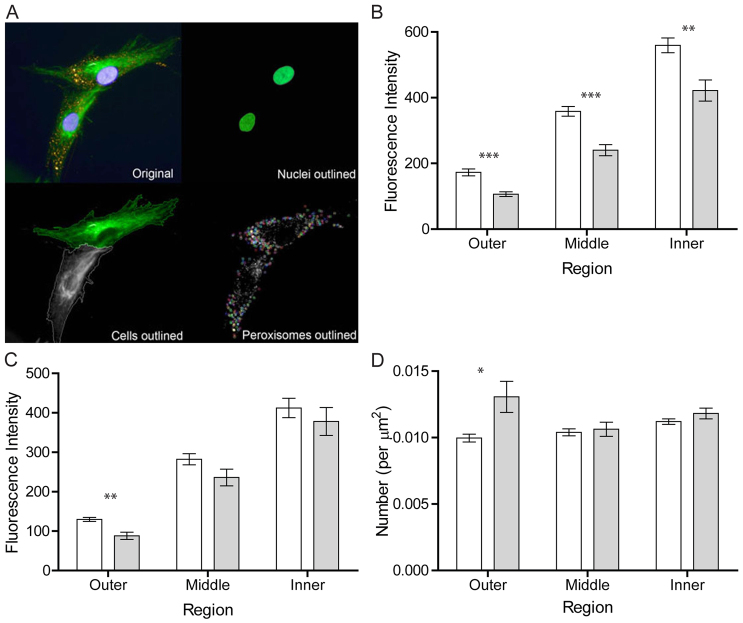
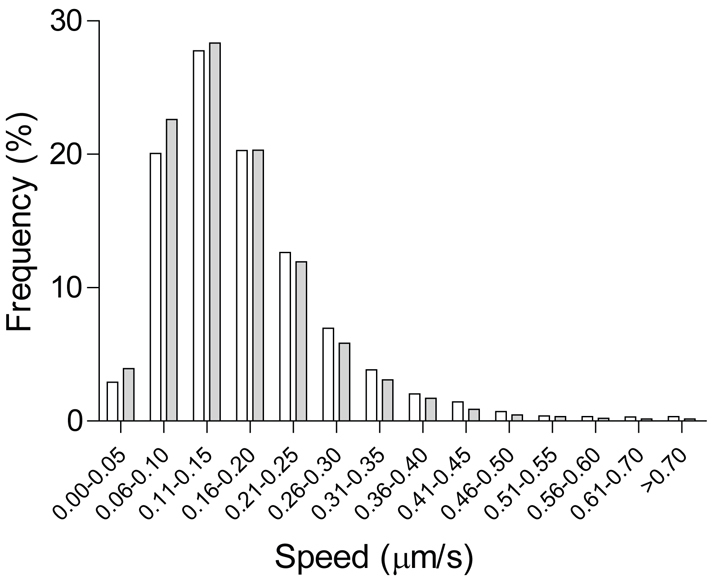
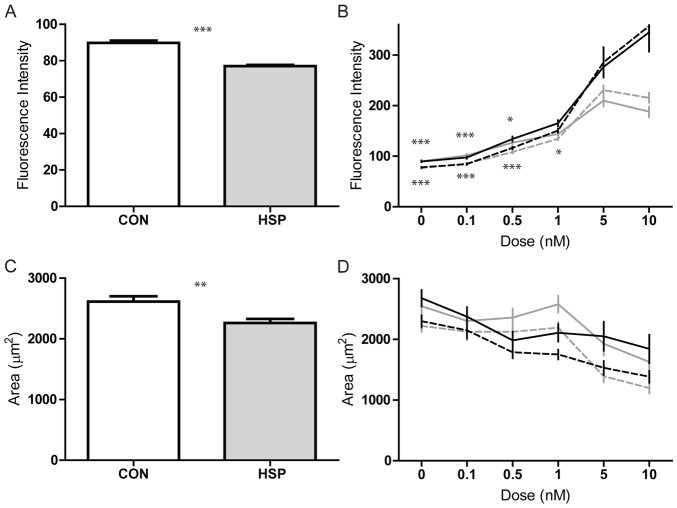
Hereditary spastic paraplegia (HSP) leads to progressive gait disturbances with lower limb muscle weakness and spasticity. Mutations in SPAST are a major cause of adult-onset, autosomal-dominant HSP. Spastin, the protein encoded by SPAST, is a microtubule-severing protein that is enriched in the distal axon of corticospinal motor neurons, which degenerate in HSP patients. Animal and cell models have identified functions of spastin and mutated spastin but these models lack the gene dosage, mutation variability and genetic background that characterize patients with the disease. In this study, this genetic variability is encompassed by comparing neural progenitor cells derived from biopsies of the olfactory mucosa from healthy controls with similar cells from HSP patients with SPAST mutations, in order to identify cell functions altered in HSP. Patient-derived cells were similar to control-derived cells in proliferation and multiple metabolic functions but had major dysregulation of gene expression, with 57% of all mRNA transcripts affected, including many associated with microtubule dynamics. Compared to control cells, patient-derived cells had 50% spastin, 50% acetylated α-tubulin and 150% stathmin, a microtubule-destabilizing enzyme. Patient-derived cells were smaller than control cells. They had altered intracellular distributions of peroxisomes and mitochondria and they had slower moving peroxisomes. These results suggest that patient-derived cells might compensate for reduced spastin, but their increased stathmin expression reduced stabilized microtubules and altered organelle trafficking. Sub-nanomolar concentrations of the microtubule-binding drugs, paclitaxel and vinblastine, increased acetylated α-tubulin levels in patient cells to control levels, indicating the utility of this cell model for screening other candidate compounds for drug therapies.


Figures

Fig. 1.
Fig. 1.
Patient and control ONS cells had very large differences in gene expression. (A) Example of neurospheres forming in vitro in serum-free medium containing EGF and FGF2. (B) Examples of adherent ONS cells after passage of dissociated neurospheres, in serum-containing medium. Scale bar: 100 μm. (C) Examples of flow cytometric plots quantifying the numbers of cells (y-axis) against fluorescence intensity for each cell (x-axis) for each of the antigens indicated. Shaded curve shows cells labeled with an antibody to the antigen indicated. Open curve shows cells labeled with an isotype control antibody. (D) Positive cells calculated as the mean percentage of antibody-labeled cells with fluorescence intensity greater than the most fluorescent isotype control (n=9 or 10). (E) Rates of proliferation of patient cells (dashed line) and control cells (continuous line), expressed as a fold-change from the number at 24 hours (y-axis). (F) Responses of patient and control ONS cells in eight cell function assays: patient (shaded bars) and control (open bars). The response of each ONS cell line is normalized against the mean of the control cells for each assay (n=10). (G) Unsupervised cluster analysis of differentially expressed genes sorts the ONS cells into patients and controls. Rows are genes. Columns are individuals. The level of gene expression is indicated by the tone of the lines from overexpressed (yellow) to underexpressed (blue). Data in D-F indicate mean ± s.e.m.
Fig. 2.
Fig. 2.
Patient cells expressed less spastin than controls. (A) Immunoblots showing spastin protein expression in nine patient cell lines (HSP, five left columns) and ten control cell lines (CON, five right columns) and associated loading controls (GAPDH). (B) The expression of each of the spastin isoforms was normalized against the GAPDH loading control and averaged for each group: patient (shaded bars) and control (open bars). (C) The data in B were normalized against the mean expression level of the control group for each isoform and are shown as mean ± s.e.m. Patient and control spastin expression was significantly different. Pair-wise comparisons were using t-tests; **P<0.001, ***P<0.001.
Fig. 3.
Fig. 3.
Microtubule-associated protein expression. Histograms indicate the expression of each of the proteins indicated, normalized against the GAPDH loading control, averaged for each group and normalized against the mean expression level of the control group for each protein: patient (shaded bars) and control (open bars). Values are means ± s.e.m. Pair-wise comparisons were using t-tests; *P<0.05. The immunoblots upon which the figure is based are shown in supplementary material Figs S2-S4.
Fig. 4.
Fig. 4.
Altered intracellular distributions of acetylated α-tubulin, mitochondria and peroxisomes. (A) Images of cells showing automated image analysis. Top left panel: Original image of two cells with nuclei (blue, DAPI), acetylated α-tubulin (green, immunofluorescence) and peroxisomes (yellow, PEX14-immunofluoresence). Top right: nuclei (green) identified. Bottom left: Cell boundaries identified; the non-green cell was rejected because it overlaps the edge. Bottom right: Peroxisomes (circles) identified. (B) Acetylated α-tubulin immunofluorescence (stable microtubules) within cellular subregions (outer, middle and inner). Patient cells (shaded bars) expressed significantly less acetylated α-tubulin overall than controls (open bars) (P<0.0001) and less in each region. Examples of images of acetylated α-tubulin immunofluorescence are shown in supplementary material Figs S5, S6. (C) MitoTracker fluorescence (mitochondria) within cytoplasm subregions (outer, middle and inner). Patient cells (shaded bars) had significantly less fluorescence overall than controls (open bars) (P<0.05) with the outer region more greatly affected. (D) PEX14 immunofluorescent peroxisomes within cytoplasm subregions (outer, middle and inner). Patient cells (shaded bars) had significantly more peroxisomes overall than controls (open bars) (P<0.05) with the outer region more greatly affected. Data indicate mean ± s.e.m. Post-hoc Bonferroni pair-wise comparisons: *P<0.05, **P<0.01, ***P<0.001.
Fig. 5.
Fig. 5.
Peroxisome speeds were slower in patient and control cells. Frequency distributions of peroxisomes in different speed classes are shown for control cells (open bars; n=7 individuals, 10 cells per individual) and patient cells (filled bars; n=6 individuals, 10 cells per individual). Peroxisome speeds were quantified every 2 seconds for 2 minutes and grouped in speed classes expressed as the percentage of peroxisomes in each speed class as a percentage of the total number of peroxisomes for each group (control cells, n=13,871 peroxisomes; patient cells, 10,529 peroxisomes).
Fig. 6.
Fig. 6.
Effects of paclitaxel and vinblastine. (A) Average intensity of acetylated α-tubulin immunofluorescence in control cells (open bar) and patient cells (shaded bar) at baseline. Control cells expressed significantly more acetylated α-tubulin than patient cells. (B) Effects of paclitaxel (black lines) and vinblastine (grey lines) at 0-10 nM on acetylated α-tubulin immunofluorescence in control cells (continuous lines) and HSP patient cells (dashed lines). Both drugs significantly increased acetylated α-tubulin immunofluorescence, but paclitaxel more so (P<0.0001). Control cells were significantly larger than patient cells at 0-0.5 nM paclitaxel (upper asterisks) and at 0-1 nM vinblastine (lower asterisks). (C) Average cell area calculated from acetylated α-tubulin immunofluorescence in control cells (open bar) and patient cells (shaded bar) at baseline. Control cells were significantly larger than patient cells. (D) Effects of paclitaxel (black lines) and vinblastine (grey lines) at 0-10 nM on cell area in control cells (continuous lines) and HSP patient cells (dashed lines). Both drugs reduced cell area in patient and control cells. Data indicate mean ± s.e.m. *P<0.05, **P<0.01, ***P<0.001.

References

    1. Blackstone C., O'Kane C. J., Reid E. (2011). Hereditary spastic paraplegias: membrane traffic and the motor pathway. Nat. Rev. Neurosci. 12, 31-42 - PMC - PubMed
    1. Brown A., Slaughter T., Black M. M. (1992). Newly assembled microtubules are concentrated in the proximal and distal regions of growing axons. J. Cell Biol. 119, 867-882 - PMC - PubMed
    1. Cassimeris L. (2002). The oncoprotein 18/stathmin family of microtubule destabilizers. Curr. Opin. Cell Biol. 14, 18-24 - PubMed
    1. Charvin D., Cifuentes-Diaz C., Fonknechten N., Joshi V., Hazan J., Melki J., Betuing S. (2003). Mutations of SPG4 are responsible for a loss of function of spastin, an abundant neuronal protein localized in the nucleus. Hum. Mol. Genet. 12, 71-78 - PubMed
    1. Claudiani P., Riano E., Errico A., Andolfi G., Rugarli E. I. (2005). Spastin subcellular localization is regulated through usage of different translation start sites and active export from the nucleus. Exp. Cell Res. 309, 358-369 - PubMed

Publication types

MeSH terms