. 2013 Feb 1;190(3):1250-63.
doi: 10.4049/jimmunol.1103060. Epub 2012 Dec 21.

Regulation of TLR2-mediated tolerance and cross-tolerance through IRAK4 modulation by miR-132 and miR-212

Affiliations

Regulation of TLR2-mediated tolerance and cross-tolerance through IRAK4 modulation by miR-132 and miR-212

Md A Nahid et al. J Immunol. .

Abstract

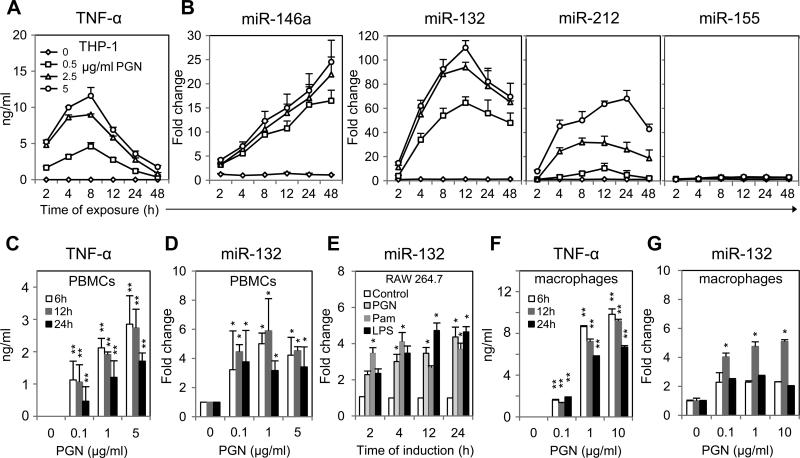
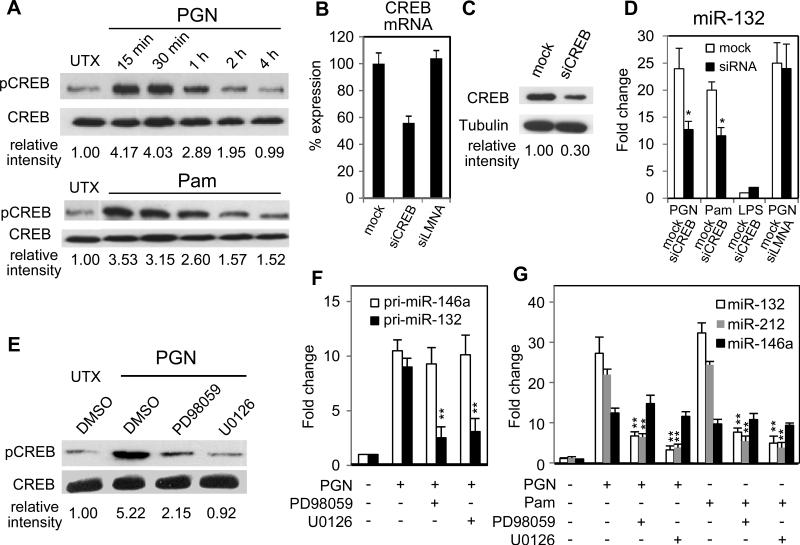
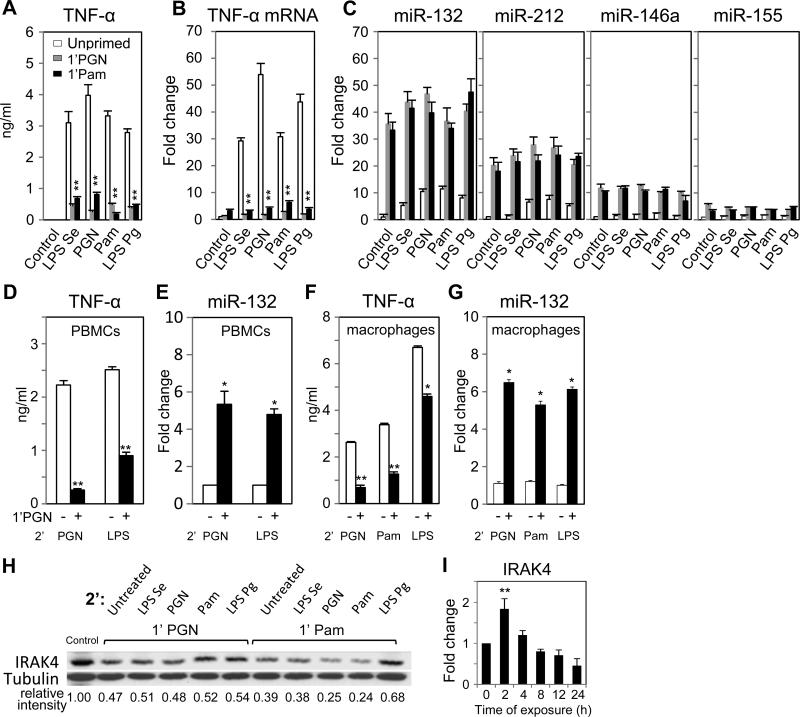
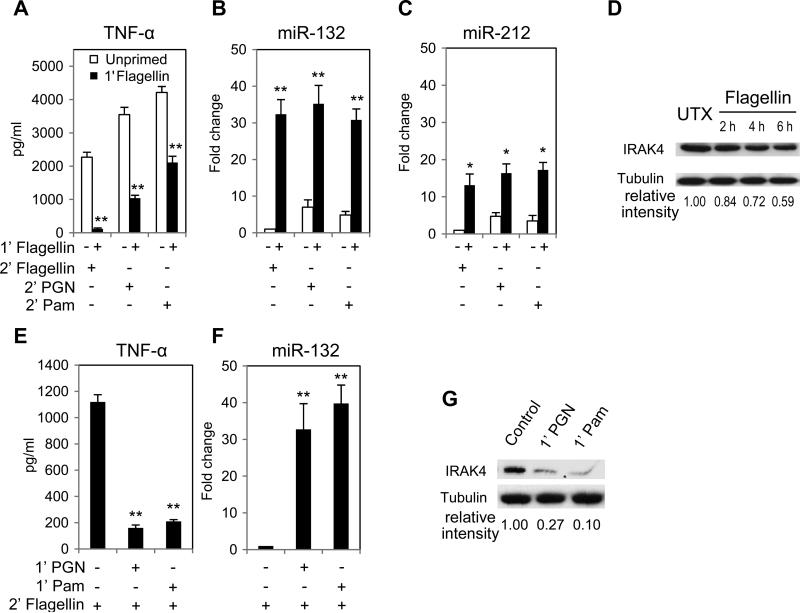
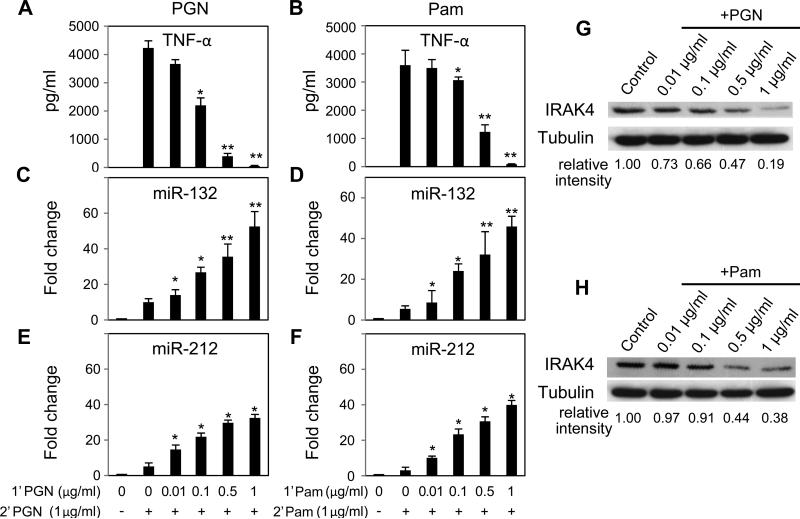
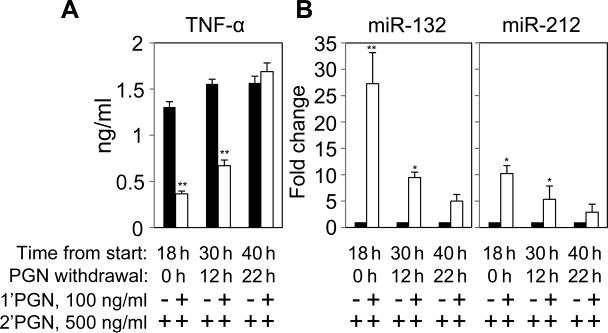
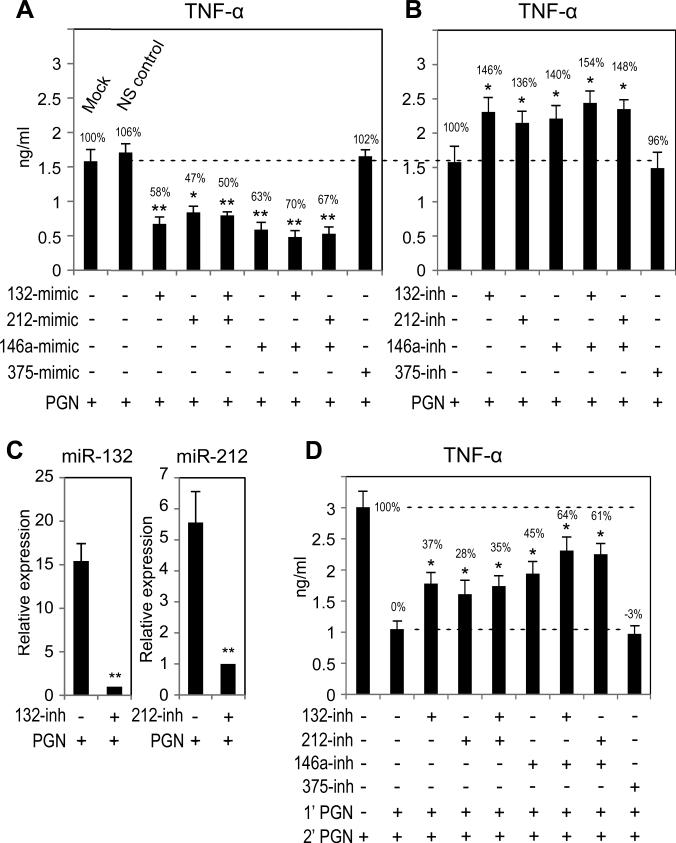
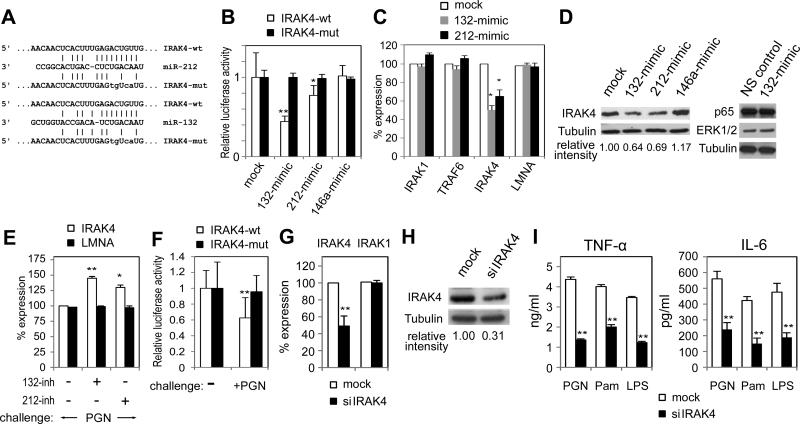
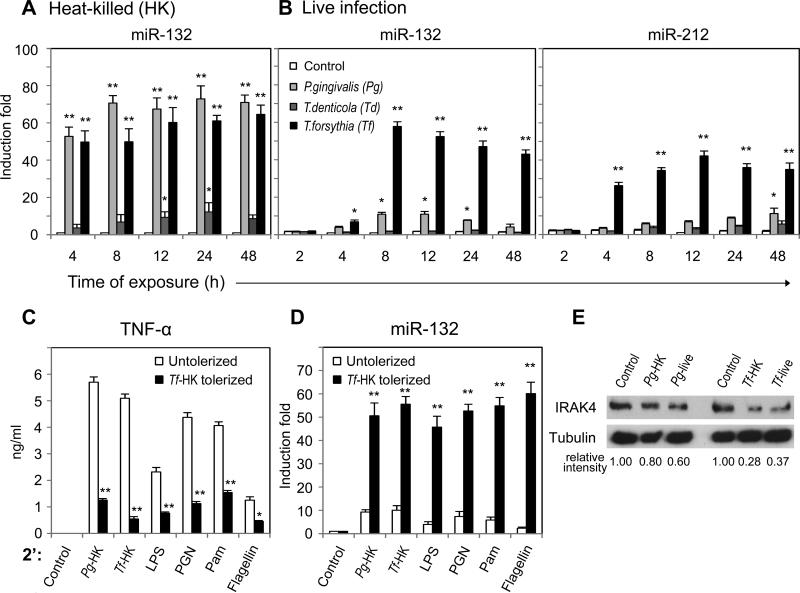
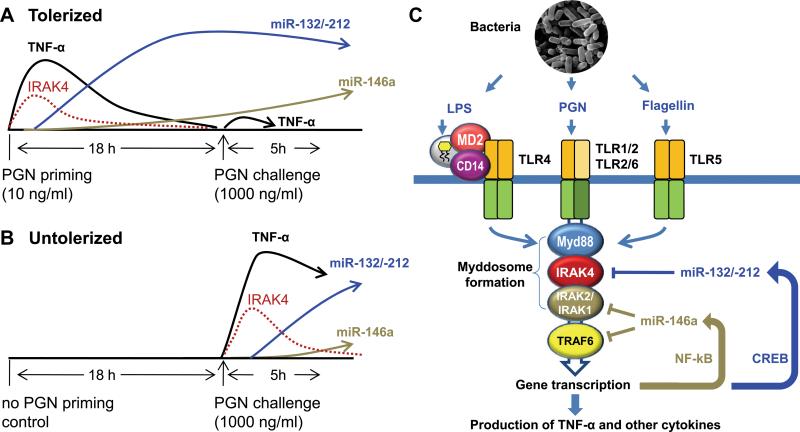
Innate immune response is the first defense against pathogens via recognition by various conserved pattern recognition receptors, such as TLRs, to initiate a rapid and strong cytokine alarm. TLR signaling-mediated cytokine production must be properly regulated to prevent pathological conditions deriving from overproduction of cytokines. In this study, the role of specific microRNAs in TLR-signaling pathway was investigated to reveal the cross-interaction and -regulation in the MyD88 pathway. In peptidoglycan (PGN)/TLR2-stimulated THP-1 monocytes, PBMCs, and primary macrophages showed rapid and dramatic miR-132 and miR-212 (miR-132/-212) upregulation. This newly identified response appeared earlier in time than the characteristic miR-146a response in LPS-TLR4 stimulation. The rapid induction of miR-132/-212 was transcription factor CREB dependent, and the sustained expression of miR-132/-212 was responsible for inducing tolerance to subsequent PGN challenge. Cross-tolerance was observed by TLR5 ligand flagellin and heat-killed or live bacteria resulting from miR-132/-212 upregulation. Mechanistically, IRAK4 was identified and validated as a target of miR-132/-212 by luciferase reporter assay and seed-sequence mutagenesis of the reporter. Transfection of miR-132 or miR-212 alone mimicked PGN tolerance in monocytes, whereas transfected specific miRNA inhibitors tampered the tolerance effect. During bacterial infection, PGN-mediated TLR2 signaling induces miR-132/-212 to downregulate IRAK4, an early component in the MyD88-dependent pathway, whereas LPS/TLR4-induced miR-146a downregulates downstream components of the same MyD88-dependent pathway. The identification of miR-132/-212 and miR-146a together to prevent damaging consequences from the overproduction of proinflammatory cytokines by targeting a common signaling pathway is significant and will provide insights into future design and development of therapeutics.


Figures

Figure 1
Figure 1
PGN induction of TNF-α and miRNA expression kinetics in monocytes/macrophages. (A) Dose-response and time-course analysis of TNF-α secretion in culture supernatant by THP-1 monocytes stimulated with 0–5 μg/ml PGN for 2–48 h (horizontal axis). TNF-α in culture supernatants at the indicated time points was measured by ELISA. (B) Quantitative RT-PCR (qRT-PCR) analysis of miR-146a, miR-132, miR-212, and miR-155 expression kinetics in respective PGN-treated THP-1 cells. (C,D) Dose- and time-dependent secretion of TNF-α and induction of miR-132 in human PBMCs stimulated with 0–5 μg/ml PGN for 6–24 h. At least 3 PBMCs from different healthy subjects were analyzed. (E) qRT-PCR analysis of miR-132 expression kinetics in mouse RAW264.7 cells stimulated for 2–24 h with 1 μg/ml PGN, Pam, or LPS. (F) TNF-α secretion by mouse primary macrophages treated for 6–24 h with 0–10 μg/ml PGN. Mouse macrophages were pooled from multiple animals and assays were analyzed in triplicate. (G) qRT-PCR analysis of miR-132 expression. Human and mouse miRNA expression was normalized with control RNU44 and SnoRNA202, respectively. Data are from three independent experiments (A–E, mean ± s.d.) or experiments were performed three times and a set of representative data is shown (F,G; mean ± s.d.). *P < 0.05; **P < 0.01 (two-tailed unpaired t-test) compared with untreated control.
Figure 2
Figure 2
Rapid induction of miR-132 and miR-212 in PGN-/Pam-stimulated THP-1 monocytes is mediated through CREB-dependent machinery. (A) Immunoblot analysis demonstrating phosphorylation of CREB (Ser 133, pCREB) within 15 min after PGN (top) or Pam (bottom) stimulation of THP-1 cells. Relative intensity is calculated as ratios of pCREB to total CREB in cell lysates. (B) qRT-PCR analysis of CREB mRNA expression in THP-1 cells transfected without (mock) siRNA, or with 100 nM siCREB or siLMNA. (C) Immunoblot analysis showing 70% reduction of CREB expression in THP-1 cells transfected with 100 nM siCREB using tubulin as a loading control. (D) miR-132 expression in siCREB-knockdown THP-1 cells stimulated for 5 h with PGN, Pam, and LPS. (E) Two-hour pre-treatment of synthetic kinase inhibitors PD98059 and U0126 blocked phosphorylation of CREB in THP-1 monocytes stimulated with 1 μg/ml PGN for 30 min. Immunoblot analysis showed 5.22-fold increase in relative intensity of pCREB in PGN-treated versus untreated control (UTX) with addition of DMSO alone and then stimulated for 30 min with 1 μg/ml PGN. (F,G) qRT-PCR analysis of primary- and mature-miR-132, miR-212, and miR-146a expression in THP-1 monocytes pre-treated for 2 h with inhibitors PD98059 and U0126 and then stimulated for 8 h with PGN or Pam. Data points and error bars represent three independent experiments (B,D,F,G, mean ± s.d.). *P < 0.05; **P < 0.01 (two-tailed unpaired t-test) compared with mock transfected THP-1 monocytes (D) or corresponding cells not treated with inhibitors (F, G). Western blot data are representatives of 2 independent experiments (A,C,E).
Figure 3
Figure 3
High levels of miR-132 and miR-212 may account for TLR2 ligand-induced tolerance via downregulation of IRAK4. (A) TNF-α production by THP-1 monocytes primed with or without (unprimed) PGN or Pam (500 ng/ml) for 18 h and then challenged with ligands (1 μg/ml) for 3 h. (B) qRT-PCR analysis of TNF-α mRNA in the PGN and Pam primed THP-1 cells as in A. (C) qRT-PCR analysis of miR-132, miR-212, miR-146a, and miR-155 expression in the same tolerized THP-1 cells as in B. (D) TNF-α secretion by human PBMCs primed with or without PGN (1 μg/ml) for 18 h and then challenged with PGN or LPS for 5 h. (E) qRT-PCR analysis of miR-132 in the PGN-primed and unprimed PBMCs as in D. (F) TNF-α production by mouse primary macrophages primed with or without PGN (1 μg/ml) for 18 h and then challenged with PGN, Pam, or LPS for 5 h. (G) qRT-PCR analysis of miR-132 in the same macrophages as in F. (H) Immunoblot analysis of IRAK4 protein levels showing reduction in PGN- or Pam-primed and unprimed THP-1 cells as in A–C and challenged with various TLR ligands for 2 h. Tubulin serves as a loading control. (I) Changes in IRAK4 mRNA detected in THP-1 cells stimulated with 500 ng/ml PGN using the same RNA samples from experiments shown in Figure 1B. Data are expressed as mean ± s.d. of three independent experiments (A–C and I), two independent experiments with three individuals, n=6 (D,E), or experiments were performed three times and a set of representative data is shown (F,G). *P < 0.05; **P < 0.01 (two-tailed unpaired t-test) compared with unprimed controls (A–B, F–G) or untreated cells (I). Western blot data (H) are representatives of 2 independent experiments. LPS Pg, LPS from P. gingivalis; LPS Se, LPS from S. enterica.
Figure 4
Figure 4
Flagellin-induced tolerance contributed by high level of miR-132 and miR-212 expression. (A) TNF-α production by THP-1 cells primed with or without flagellin (200 ng/ml) for 18 h and then challenged with flagellin (300 ng/ml), PGN (1000 ng/ml), or Pam (1000 ng/ml) for 3 h. (B,C) qRT-PCR analysis of miR-132 and miR-212 expression in the same THP-1 cells as in A. (D) Immunoblot analysis of IRAK4 in THP-1 monocytes stimulated for 2, 4, or 6 h with flagellin (200 ng/ml). Tubulin serves as a loading control. (E) TNF-α production by THP-1 cells primed with or without PGN or Pam (1000 ng/ml) for 12 h and then challenged with 300 ng/ml flagellin for 3 h. (F) qRT-PCR for miR-132 expression in the PGN or Pam primed THP-1 monocytes as described in E. (G) Immunoblot analysis of IRAK4 and tubulin (loading control) in THP-1 monocytes stimulated for 3 h with PGN and Pam (1000 ng/ml). Data are representative of three independent experiments (A–C,E,F, mean ± s.d.). Western blot data are representatives of 2 independent experiments (D,G). *P < 0.05; **P < 0.01 (two-tailed unpaired t-test) compared with unprimed controls.
Figure 5
Figure 5
Dose-dependent priming effect of PGN and Pam to induce efficient tolerance are inversely correlated to the levels of miR-132 and miR-212 expression. (A,B) TNF-α levels by THP-1 monocytes primed with 0–1 μg/ml PGN (1'PGN) or Pam (1'Pam) for 18 h and then challenged with high doses of PGN or Pam (1 μg/ml, 2' challenge) for 3 h. (C,D) miR-132 expression in the same PGN-treated THP-1 monocytes as in A and B. (E,F) miR-212 expression in the THP-1 monocytes as mentioned in A and B. (G,H) Immunoblot analyses for IRAK4, and tubulin (loading control) in the THP-1 cell lysates collected 2 h after PGN or Pam challenge (0–1 μg/ml). Data points and error bars represent of three independent experiments (A–F, mean ± s.d.). Western blot data are representatives of 2 independent experiments (G,H). *P < 0.05; **P < 0.01 (two-tailed unpaired t-test) compared with unprimed THP-1 cells challenged with 1 μg/ml PGN.
Figure 6
Figure 6
Reduction in miR-132 and miR-212 expression in PGN-tolerized THP-1 cells inversely correlated with TNF-α production. (A) TNF-α production by THP-1 cells cultured with (tolerized) or without (untolerized) PGN (100 ng/ml) for 18 h and then cells were washed with PBS and cultured in complete growth medium for an additional 0, 12, or 22 h (PGN withdrawal). At each time point, 8×10⁵ cells were challenged for 5 h with PGN (500 ng/ml) prior to analysis of TNF-α in culture supernatant. (B) qRT-PCR analysis of miR-132 and miR-212 in the same THP-1 cells as described in A. Values are mean ± s.d. from three independent experiments. *P < 0.05; **P < 0.01 (two-tailed unpaired t-test) compared with unprimed THP-1 cells challenged with 500 ng/ml PGN.
Figure 7
Figure 7
Overexpression of miR-132 or miR-212 alone can mimic TLR2 ligand priming while specific miRNA inhibitors tamper PGN-induced tolerance. (A) Reduction in TNF-α production by THP-1 cells transfected for 24 h with miRNA mimics or non-specific (NS) negative control (total 40 nM) and then challenged for 8 h with 500 ng/ml PGN. (B) Enhanced TNF-α production by THP-1 monocytes transfected in parallel as in A substituted only with miRNA inhibitor(s) (total 40 nM). (C) Effective inhibition of miR-132 and miR-212 expression in THP-1 cells transfected with 40 nM miRNA respective inhibitors (132-inh, 212-inh) for 24 h and then stimulated for 16 h with 100 ng/ml PGN. (D) Recovery of TNF-α production by THP-1 monocytes transfected for 24 h with miRNA inhibitor (total 40 nM) and primed/tolerized with PGN (100 ng/ml) for 8 h, and then challenged with 500 ng/ml PGN for 3 h. There was no apparent change in proliferation and cell survival in cells treated with miRNA-mimics and inhibitors differently from the controls. Data represent three independent experiments (A–C) or experiment with triplicate sample analyzed (D, mean ± s.d.). *P < 0.05; **P < 0.01 (two-tailed unpaired t-test) compared with mock transfected controls.
Figure 8
Figure 8
IRAK4 mRNA is a molecular target of miR-132 and miR-212 post-transcriptional silencing in TLR signaling. (A) Sequence alignment of miR-212 (top) and miR-132 (bottom) with putative target site in 3'UTR of IRAK4 (IRAK4-wt) and mutant construct (IRAK4-mut). (B) Luciferase activity in HEK293 cells cotransfected for 48 h with either wild type or mutant 3'UTR IRAK4-luciferase reporter and 100 nM miR-132-, miR-212-, or miR-146a-mimic. (C) qRT-PCR analysis of IRAK1, TRAF6, IRAK4, and lamin A/C (LMNA, a negative control) in THP-1 monocytes transfected for 48 h with 40 nM miR-132- and miR-212-mimic. (D) Immunoblot analysis of IRAK4 and tubulin (loading control) in THP-1 monocytes transfected with 40 nM miR-132- and miR-212-mimic for 48 h. Reduction of IRAK4 level was noted for cells transfected with miR-132-and miR-212-mimic, but not miR-146a-mimic (left). The levels of NF-kB p65 and ERK 1/2 were not affected in cells transfected by miR-132-mimic compared to cells transfected by NS control (right). (E) qRT-PCR analysis showing significant and specific elevated level of IRAK4 in THP-1 monocytes transfected with 40 nM miR-132 or miR-212 inhibitor for 48 h. LMNA was monitored as an unrelated negative control. (F) PGN-induced regulation of IRAK4 3'UTR in THP-1 cells. IRAK4-wt or IRAK4-mut reporter constructs were co-transfected with RL luciferase constructs into THP-1 monocytes for 6 h and cell lysates were harvested 12 h after PGN stimulation (2 μg/ml) to monitor for luciferase activities. (G) qRT-PCR analysis showing specific reduction of IRAK4 mRNA in THP-1 monocytes transfected with 100 nM IRAK4-specific siRNA (siIRAK4) for 48 h; IRAK1 mRNA served as a negative control. (H) Immunoblot analysis of IRAK4 and tubulin (loading control) in THP-1 monocytes transfected with 100 nM siIRAK4 for 48 h. (I) TNF-α and IL-6 production by THP-1 monocytes transfected with 100 nM siIRAK4 for 48 h and then treated for 3 to 24 h with PGN, Pam, or LPS (1000 ng/ml). Data points and error bars represent three independent experiments (B,C,E–G,I, mean ± s.d.). *P < 0.05; **P < 0.01 (two-tailed unpaired t-test) compared with mock transfected controls (B–C, E, H, I) or with IRAK4-mut (B, F). Western blot data are representatives of 2 independent experiments (D,H).
Figure 9
Figure 9
Heat-killed bacterial stimulation- or live bacterial infection-induced miR-132 and miR-212 contribute to resistance to recurrent bacterial challenge. (A,B) qRT-PCR analysis of miR-132 and miR-212 expression in THP-1 monocytes stimulated for 2–48 h with heat-killed (HK) and live P. gingivalis, T. denticola, and T. forsythia at MOI 100. (C) TNF-α production by THP-1 cells primed with or without HK T. forsythia (MOI 10) for 18 h and then challenged for 2 h with HK bacteria (MOI 100), 1000 ng/ml of LPS, PGN, and Pam and 300 ng/ml flagellin. (D) qRT-PCR of miR-132 expression in the same THP-1 monocytes as described in C. (E) Immunoblot analysis of IRAK4 and tubulin (loading control) in THP-1 monocytes treated for 4 h with HK and live P. gingivalis or T. forsythia (MOI 100). Data are representative of three independent experiments (A–D, mean ± s.d.) or two independent experiments (E). *P < 0.05; **P < 0.01 (two-tailed unpaired t-test) compared with untreated controls at the same time point (A–B) or untolerized controls (C–D).
Figure 10
Figure 10
PGN-induced miR-132 and miR-212 in TLR signaling. (A–B) A schematic summary of PGN-mediated induction of miR-132 and miR-212 targeting IRAK4 in tolerized and untolerized THP-1 monocytes. (C) LPS, PGN, and flagellin from bacterial infection bind to their respective TLRs and activate the MyD88-dependent pathway. This eventually leads to gene transcription with the production of TNF-α and other cytokines. The MyD88 pathway leads to activation of NF-kB and production of miR-146a whereas activation of CREB leads to miR-132/-212 production. miR-132/-212 targets IRAK4 whereas miR-146a targets IRAK2/1 and TRAF6. IRAK4 and IRAK2/1 are critical components of the myddosome which is in turn critical for activation of the MyD88-dependent pathway.

Similar articles

Cited by

References

    1. Akira S, Takeda K. Toll-like receptor signalling. Nat Rev Immunol. 2004;4:499–511. - PubMed
    1. Cook DN, Pisetsky DS, Schwartz DA. Toll-like receptors in the pathogenesis of human disease. Nat.Immunol. 2004;5:975–979. - PubMed
    1. de Vos AF, Pater JM, van den Pangaart PS, de Kruif MD, van 't Veer C, van der Poll T. In vivo lipopolysaccharide exposure of human blood leukocytes induces cross-tolerance to multiple TLR ligands. J. Immunol. 2009;183:533–542. - PubMed
    1. del Fresno C, Garcia-Rio F, Gomez-Pina V, Soares-Schanoski A, Fernandez-Ruiz I, Jurado T, Kajiji T, Shu C, Marin E, Gutierrez del Arroyo A, Prados C, Arnalich F, Fuentes-Prior P, Biswas SK, Lopez-Collazo E. Potent phagocytic activity with impaired antigen presentation identifying lipopolysaccharide-tolerant human monocytes: demonstration in isolated monocytes from cystic fibrosis patients. J. Immunol. 2009;182:6494–6507. - PubMed
    1. Foster SL, Hargreaves DC, Medzhitov R. Gene-specific control of inflammation by TLR-induced chromatin modifications. Nature. 2007;447:972–978. - PubMed

Publication types

MeSH terms

Substances

LinkOut - more resources