. 2013 Feb 1;190(3):1094-102.
doi: 10.4049/jimmunol.1202639. Epub 2012 Dec 21.

Focal adhesion kinase regulates the localization and retention of pro-B cells in bone marrow microenvironments

Affiliations

Focal adhesion kinase regulates the localization and retention of pro-B cells in bone marrow microenvironments

Shin-Young Park et al. J Immunol. .

Abstract

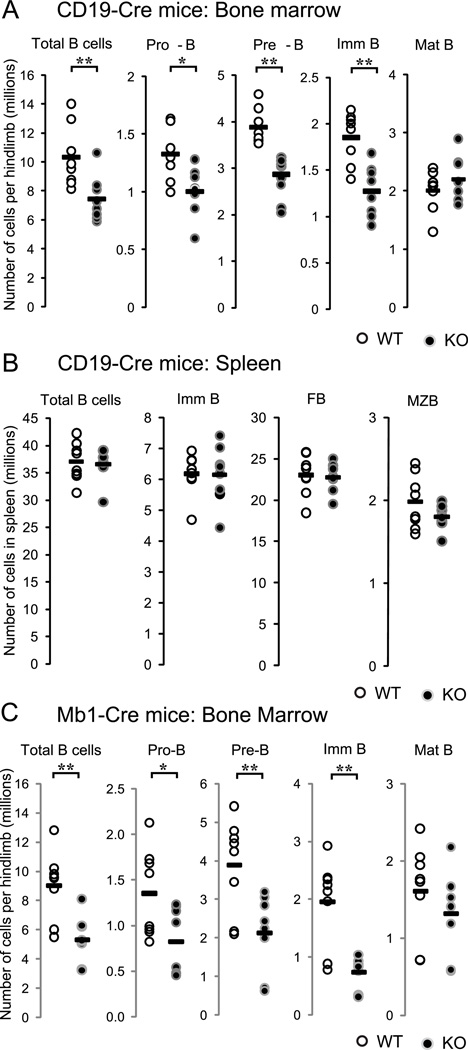
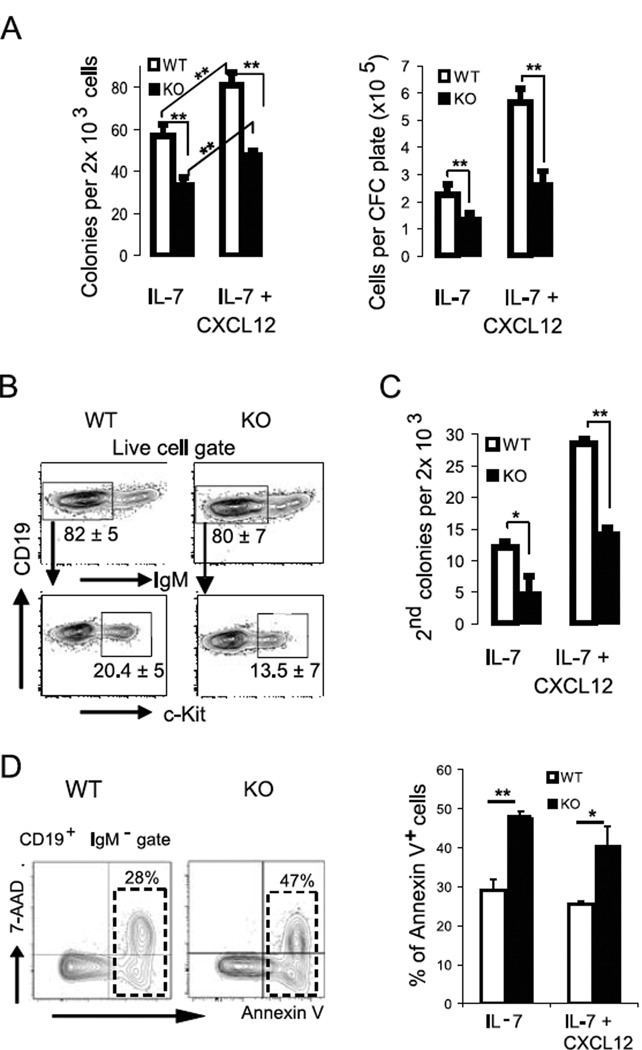
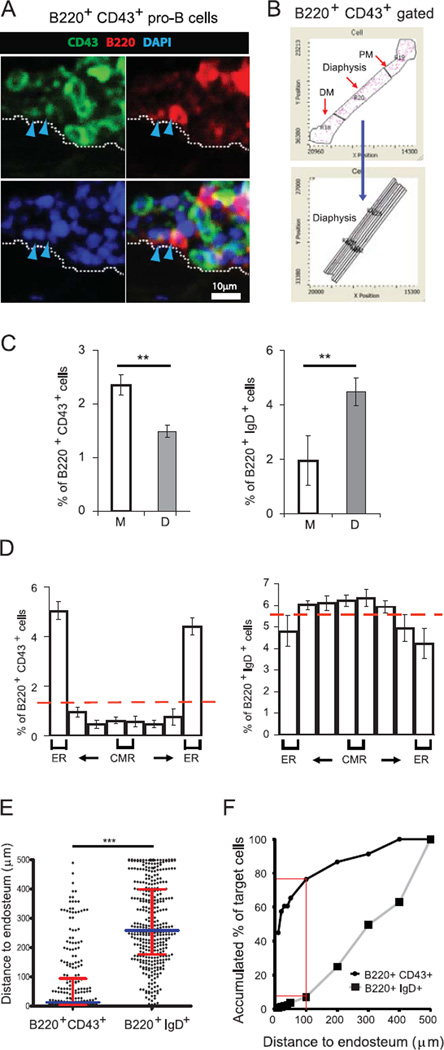
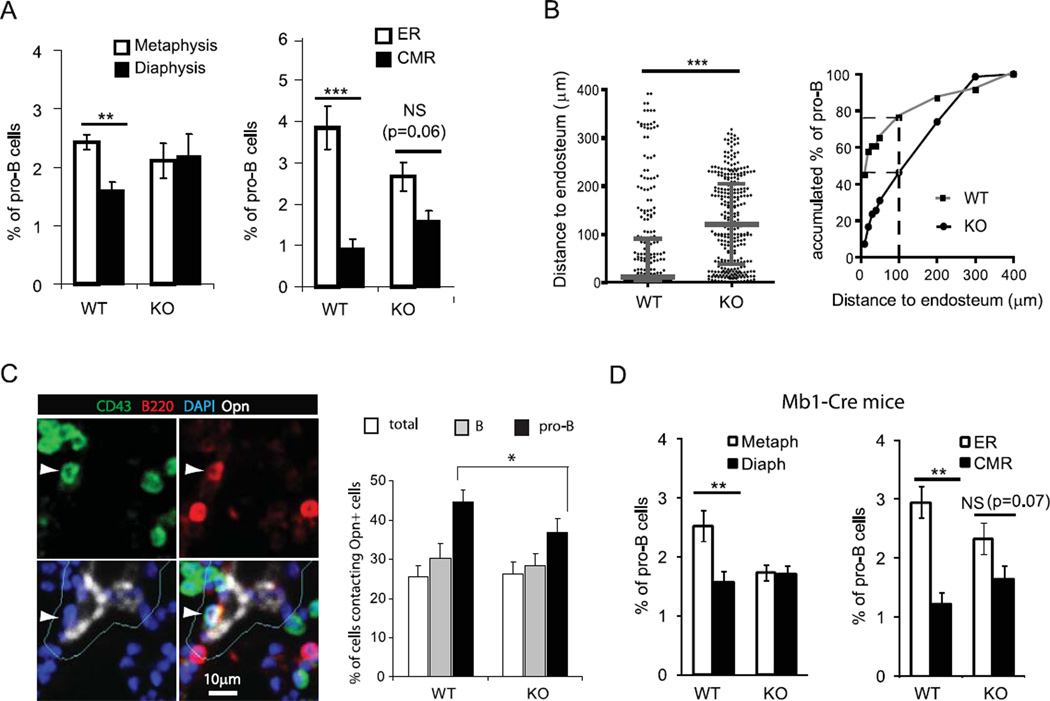
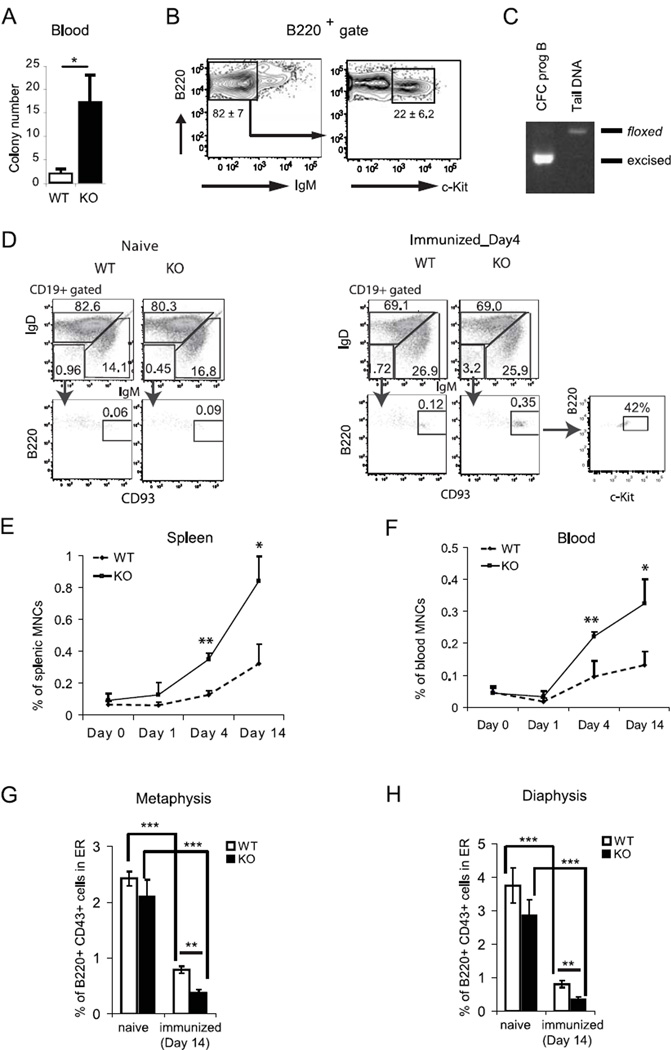
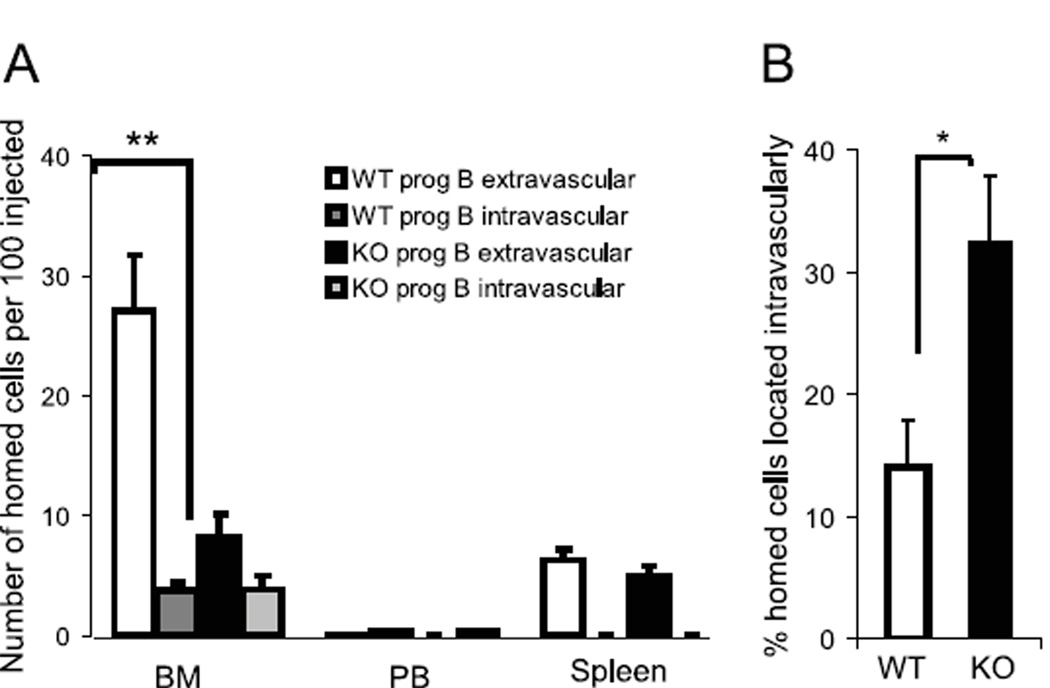
Progenitor B cells reside in complex bone marrow (BM) microenvironments where they receive signals for growth and maturation. We reported previously that the CXCL12-focal adhesion kinase (FAK)-VLA4 pathway plays an important role in progenitor B cell adhesion and migration. In this study, we have conditionally targeted in B cells FAK, and found that the numbers of progenitor pro-B, pre-B, and immature B cells are reduced by 30-40% in B cell-specific FAK knockout mice. When cultured in methylcellulose with IL-7 ± CXCL12, Fak-deleted pro-B cells yield significantly fewer cells and colonies. Using in situ quantitative imaging cytometry, we establish that in longitudinal femoral BM sections, pro-B cells are preferentially localized in close proximity to the endosteum of the metaphyses and the diaphysis. Fak deletion disrupts the nonrandom distribution of pro-B cells and induces the mobilization of pro-B cells to the periphery in vivo. These effects of Fak deletion on pro-B cell mobilization and localization in BM are amplified under inflammatory stress, that is, after immunization with nitrophenol-conjugated chicken γ-globulin in alum. Collectively, these studies suggest the importance of FAK in regulating pro-B cell homeostasis and maintenance of their spatial distribution in BM niches.


Figures

Figure 1
Figure 1. Selective decrease of progenitor B cell number in B cell specific FAK knockout mice
(A) BM cells from Cd19-Cre Fak KO or WT control mice, (B) spleen cells from Cd19-Cre Fak KO or WT control mice, or (C) BM cells from mb1-Cre Fak KO or littermate WT control mice were prepared and stained with monoclonal antibodies. Total numbers of each population per limb (one femur and one tibia) or per spleen were calculated using flow cytometry analysis and automated complete blood count. Student’s t-tests were performed as shown *, P<0.05, and **, P<0.01 (unpaired, two-tailed). n=8. Dots indicate individual mice; bar indicates the mean. BM cell gates: Total B cells (B220+ CD19+), Pro-B (B220lo CD19+ IgM CD43+), Pre-B (B220lo CD19+ IgM CD43), Imm B (immature B cells, B220lo CD19+ IgM+ AA4.1+), Mat B (mature B cells, B220hi CD19+ IgM+ AA4.1); spleen cell gates: Total B (CD19+), Imm B (immature B, CD19+ CD23 CD21/35), FB (follicular B cells, CD19+ CD23+ CD21/35mid), MZB (marginal zone B cells, CD19+ CD23−/lo CD21/35hi). Data are pooled from 4 independent experiments.
Figure 2
Figure 2. Fak deletion affects pro-B cell growth
(A – B) B220lo IgM CD43+ EGFP+ sorted BM pro-B cells (2×10³ per plate) were sorted from CD19-Cre+/− Fakfl/fl Rosa26-EGFP+/− KO mice or WT mice, and plated in CFC pre-B (IL-7) media in the presence or absence of CXCL12 (500 ng/ml). (A) Colony count on day 7, followed by total live cell count after staining with 7-Aminoactinomycin D (7-AAD). (B) A representative flow cytometry analysis of 7-day CFC colonies is shown; % of IgM cells and IgM c-Kit+ cells is marked under each gate as mean ± standard error of the mean (SEM). Data are pooled from 10 experiments. (C) B220lo IgM CD43+ EGFP+ BM cells (2×10³ per plate) were plated in CFC pre-B (IL-7) media in the presence or absence of CXCL12 (500 ng/ml). Colonies were recovered after 7 days and re-plated under the same culture conditions (2×10³ per plate). The number of secondary colonies was counted on day 7 (n=10). Data are pooled from 10 experiments. (D) Cells from the CFC colonies were analyzed by flow cytometry. The fraction of apoptotic (Annexin V+ 7-AAD) and dead (Annexin V+ 7-AAD+) cells were assessed among the CD19+ IgM cell population. % Annexin V+ (apoptotic and dead) cells were plotted (mean ± SEM). Data are pooled from 4 experiments. Student’s t-test, *P < 0.05, **P < 0.01.
Figure 3
Figure 3. Non-random gradient distribution of B220+ CD43+ pro-B cells in the endosteal region of the metaphyses and the diaphysis
Longitudinal femur sections from C57BL/6 wild type (WT) mice were stained for B220 (red), CD43 or IgD (green), and DAPI (blue) followed by iCys imaging cytometry analysis. (A) Representative field images show BM cells on the endosteal surface (white dotted line). Arrowheads indicate B220+ CD43+ pro-B cell. (B) DAPI-based cell contour events retain their positional information so that the distribution of discrete cell populations, i.e. B220+ IgD+ cells and B220+ CD43+ cells, can be visualized in a tissue map with specific gates across the diaphysis within different regions (proximal and distal metaphysis, diaphysis, and subregions of the diaphysis). (C) Frequencies (mean ± SEM) of fluorescently stained B220+ IgD+ and B220+ CD43+ cell subpopulations within the metaphyses and diaphysis. Student’s T-test, **P<0.01, n=4; NS, not significant. (D) The distribution of each population (B220+ IgD+ cells and B220+ CD43+ cells) is shown across the diaphysis. (ER=endosteal region; CMR=central medullary region). (E) The comparative distance of B220+ CD43+ cells and B220+ IgD+ cells to the bone surface in endosteal areas. Values plotted are values per cell. Scatter dot plots are shown with median ± interquartile range shown as broader and narrower horizontal lines, respectively. n = 4 mice. Two-tailed Mann-Whitney test: ***P < 0.0001. (F) Accumulated % of cells shows the preferential accumulation of B220+ CD43+ cells in endosteal areas compared to B220+ IgD+ cells. Red lines indicate the accumulated % of target cells within 100 µm distance to endosteum. Data are pooled from 4 independent experiments.
Figure 4
Figure 4. FAK regulates the distribution of pro-B cells in femoral BM microenvironments
Based on their frequency within specific BM regions of CD19-Cre Fak KO and WT control mice, B220+ CD43+ pro-B cells were graphed in the (A) metaphyses versus diaphysis of BM and in the ER (endosteal region) versus CMR (central medullary region) of diaphysis. Columns and error bars represent mean ± SEM. Student t-test: **, P<0.01; ***, P<0.001; NS, not significant. n=4. (B) The distances of CD19-Cre Fak KO and WT control B220+ CD43+ pro-B cells to endosteum in endosteal areas were measured and graphed (n = 4 mice). Dots indicate individual cells, n=262 (WT) and n=300 (KO). A scatter dot plot is shown with median ± interquartile range indicated as broader and narrower horizontal lines, respectively. Two-tailed Mann-Whitney test: ***P < 0.001. Accumulated % of B220+ CD43+ pro-B cells from WT or Fak KO mice is shown in endosteal areas. Numbers of cells analyzed for the Distance to endosteum, n=262 (WT) and n=300 (KO). Broken lines indicate the Accumulated % of target cells within 100 µm distance to endosteum. (C) Longitudinal femur sections were stained with antibodies against B220 (red), CD43 (green), and osteopontin (white), and DAPI (blue) followed by iCys imaging cytometry analysis. Representative field images show B220+ CD43+ pro-B cell (white arrowhead) on the osteopontin+ niche. Cellular events in osteopontin+ integration contour (within 5 µm outside of osteopontin+ signals; Cyan) are identified as cells contacting Opn+ cells. Percentages (mean ± SEM) of total cells, B220+ B cells, and B220+ CD43+ pro-B cells contacting osteopontin+ cells are shown in the metaphyses of CD19-Cre Fak WT and KO. Average of 39,683 (WT) and 38,354 (KO) cells in the metaphyses of femur sections were analyzed from 4 mice each. Student’s t-test, *P<0.05, n=4. Data are pooled from 4 independent experiments. (D) The frequency of B220+ CD43+ pro-B cells within specific BM regions of mb1-Cre Fak KO and WT control mice, were graphed in the metaphyses versus diaphysis of BM and in the ER (endosteal region) versus CMR (central medullary region) of diaphysis as shown in Fig. 4 (A). Student t-test: *, P<0.05; **, P<0.01; NS, not significant. n=3.
Figure 5
Figure 5. Fak deletion leads to mobilization of pro-B cells to the periphery
(A–C) Appearance of colony forming pro-B cells in the periphery of Fak KO mice under steady state condition. Representative data of four experiments are shown (n=8). (A) CFC assays were performed to detect pro-B cells from hemolyzed peripheral blood (0.25 ml per dish) in methylcellulose-based IL-7 containing CFC media. Colonies were counted on day 7 and plotted as colony number per 1 ml blood. Data are expressed as the mean ± SEM (n=12, *P<0.05). (B) Representative flow cytometry plot of B220+ gated cells is shown. Mean percentages of B220+ IgM and B220+ IgM c-Kit+ subpopulations are shown in the indicated gates. (C) The CFC cells from Fak KO mice were subjected to Fak genotyping as shown in Fig. S1. (D–F) Appearance of B220lo CD19+ IgM IgD CD93+ progenitor B cells in the spleen and peripheral blood (PB) of immunized WT and Fak KO mice at days 0–14 were characterized and enumerated by flow cytometry (n=4). (D) Representative flow cytometry profiles of B220lo CD19+ IgM IgD CD93+ progenitor B cells in WT spleen from naïve and immunized on day 4 are shown. The frequencies of CD93+ B220lo gated cells are indicated as % of total cells. The frequency of c-Kit+ progenitor B cells is indicated as % of CD93+ B220lo cells. Kinetics of B220lo CD19+ IgM IgD CD93+ progenitor B cell numbers in spleen (E) and PB (F) after immunization. (G and H) Localization of B220+ CD43+ pro-B cells were examined in the BM from naïve and NPCGG/alum-immunized femurs (n=4) by LSC as described in Fig.4. The frequency of B220+ CD43+ pro-B cells in the endosteal region (within 100 µm distance endosteal surface) are graphed (G) in the metaphyses and (H) in the diaphysis. Data are from 4 independent experiments. Asterisks indicate significant differences from controls: *, P < 0.05; **, P < 0.01; ***, P < 0.001.
Figure 6
Figure 6. Pro-B cell homing to the BM cavity is regulated by FAK
Sorted B220+ CD43+ EGFP+ pro-B cells from Fak KO or WT were differentially labeled with CMFDA and CMAC dyes, respectively, and intravenously transferred to wild type recipient mice. After 2 hrs, intravascular cells were labeled in vivo by PE-Cy7 conjugated B220 antibodies and the frequency of total cells that homed to BM as well as the fraction present intravascularly was determined by FACS. (A) Homing abilities are expressed as the number of homed cells per 100 injected cells. Columns and error bars represent mean ± SEM. n=6, p=0.004 (Student’s t-test). (B) The percentage of homed cells residing intravascularly is plotted for transferred WT and Fak KO cells. N=6, p=0.019 (Student’s t-test). Data are from 3 independent experiments. *P<0.05, **P<0.01

Similar articles

Cited by

References

    1. Hardy RR, Hayakawa K. B cell development pathways. Annu Rev Immunol. 2001;19:595–621. - PubMed
    1. Nagasawa T. Microenvironmental niches in the bone marrow required for B-cell development. Nat Rev Immunol. 2006;6:107–116. - PubMed
    1. Visnjic D, Kalajzic Z, Rowe DW, Katavic V, LorenzoH J, Aguila HL. Hematopoiesis is severely altered in mice with an induced osteoblast deficiency. Blood. 2004;103:3258–3264. - PubMed
    1. Wu JY, Purton LE, Rodda SJ, Chen M, Weinstein LS, McMahon AP, Scadden DT, Kronenberg HM. Osteoblastic regulation of B lymphopoiesis is mediated by Gs{alpha}-dependent signaling pathways. Proc Natl Acad Sci U S A. 2008;105:16976–16981. - PMC - PubMed
    1. Osmond DG, Kim N, Manoukian R, Phillips RA, Rico-Vargas SA, Jacobsen K. Dynamics and localization of early B-lymphocyte precursor cells (pro-B cells) in the bone marrow of scid mice. Blood. 1992;79:1695–1703. - PubMed

Publication types

MeSH terms