

Iron metabolism in aerobes: managing ferric iron hydrolysis and ferrous iron autoxidation
- PMID: 23264695
- PMCID: PMC3524981
- DOI: 10.1016/j.ccr.2012.06.030
Iron metabolism in aerobes: managing ferric iron hydrolysis and ferrous iron autoxidation
Abstract
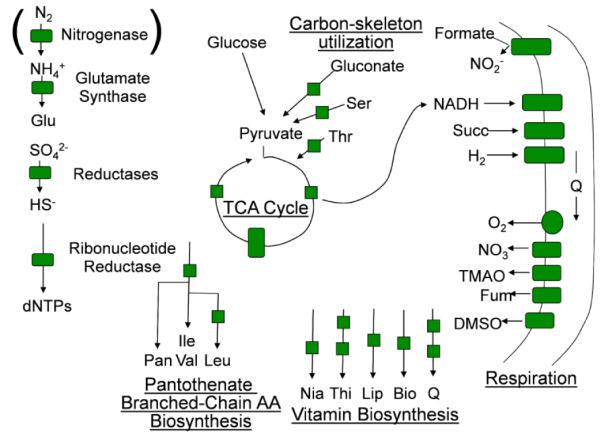
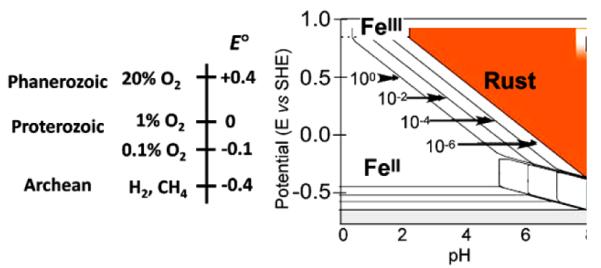
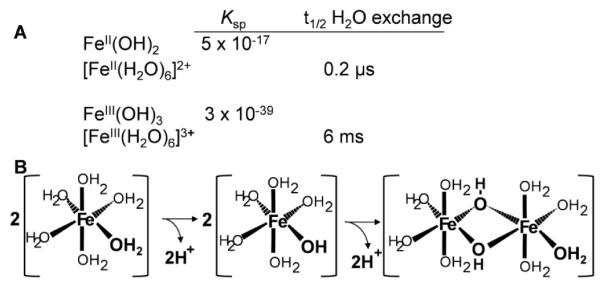
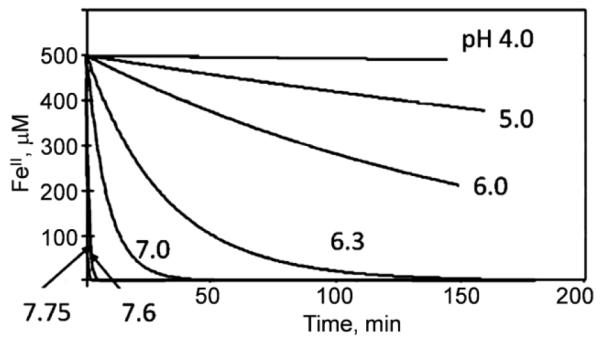
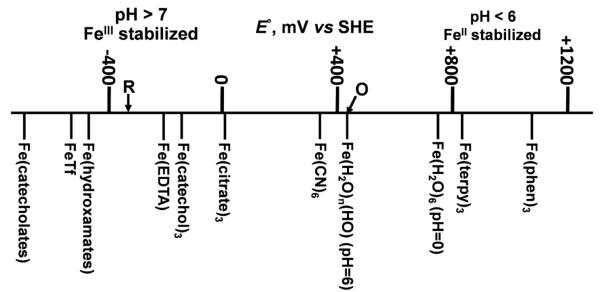
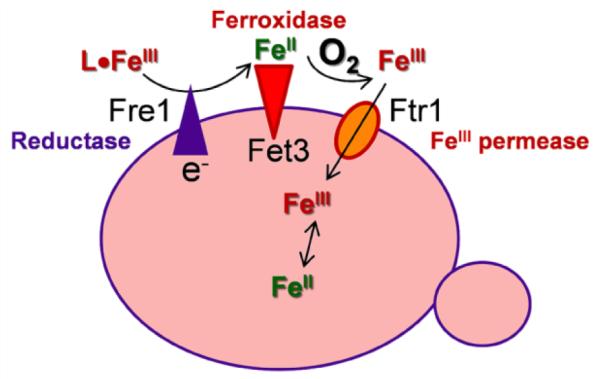
Aerobes and anaerobes alike express a plethora of essential iron enzymes; in the resting state, the iron atom(s) in these proteins are in the ferrous state. For aerobes, ferric iron is the predominant environmental valence form which, given ferric iron's aqueous chemistry, occurs as 'rust', insoluble, bio-inert polymeric ferric oxide that results from the hydrolysis of [Fe(H(2)O)(6)](3+). Mobilizing this iron requires bio-ferrireduction which in turn requires managing the rapid autoxidation of the resulting Fe(II) which occurs at pH > 6. This review examines the aqueous redox chemistry of iron and the mechanisms evolved in aerobes to suppress the 'rusting out' of Fe(III) and the ROS-generating autoxidation of Fe(II) so as to make this metal ion available as the most ubiquitous prosthetic group in metallobiology.
Figures

Similar articles
-
Anoxic and Oxic Oxidation of Rocks Containing Fe(II)Mg-Silicates and Fe(II)-Monosulfides as Source of Fe(III)-Minerals and Hydrogen. Geobiotropy.Orig Life Evol Biosph. 2017 Dec;47(4):453-480. doi: 10.1007/s11084-017-9534-5. Epub 2017 Mar 31. Orig Life Evol Biosph. 2017. PMID: 28361301
-
Redox cycling in iron uptake, efflux, and trafficking.J Biol Chem. 2010 Aug 27;285(35):26729-26735. doi: 10.1074/jbc.R110.113217. Epub 2010 Jun 3. J Biol Chem. 2010. PMID: 20522542 Free PMC article. Review.
-
Ferrous and Ferric Ion-Facilitated Dilute Acid Pretreatment of Lignocellulosic Biomass under Anaerobic or Aerobic Conditions: Observations of Fe Valence Interchange and the Role of Fenton Reaction.Molecules. 2020 Mar 20;25(6):1427. doi: 10.3390/molecules25061427. Molecules. 2020. PMID: 32245102 Free PMC article.
-
Iron autoxidation and free radical generation: effects of buffers, ligands, and chelators.Arch Biochem Biophys. 2002 Jan 15;397(2):360-9. doi: 10.1006/abbi.2001.2694. Arch Biochem Biophys. 2002. PMID: 11795895
-
Ferric iron reductases and their contribution to unicellular ferrous iron uptake.J Inorg Biochem. 2021 May;218:111407. doi: 10.1016/j.jinorgbio.2021.111407. Epub 2021 Feb 25. J Inorg Biochem. 2021. PMID: 33684686 Free PMC article. Review.
Cited by
-
The Cryptococcus neoformans alkaline response pathway: identification of a novel rim pathway activator.PLoS Genet. 2015 Apr 10;11(4):e1005159. doi: 10.1371/journal.pgen.1005159. eCollection 2015 Apr. PLoS Genet. 2015. PMID: 25859664 Free PMC article.
-
Iron Homeostasis in Insects.Annu Rev Entomol. 2023 Jan 23;68:51-67. doi: 10.1146/annurev-ento-040622-092836. Epub 2022 Sep 28. Annu Rev Entomol. 2023. PMID: 36170642 Free PMC article. Review.
-
Mitochondrial Iron-Sulfur Cluster Activity and Cytosolic Iron Regulate Iron Traffic in Saccharomyces cerevisiae.J Biol Chem. 2015 Nov 6;290(45):26968-26977. doi: 10.1074/jbc.M115.676668. Epub 2015 Aug 25. J Biol Chem. 2015. PMID: 26306041 Free PMC article.
-
Contributions to magnetic susceptibility of brain tissue.NMR Biomed. 2017 Apr;30(4):10.1002/nbm.3546. doi: 10.1002/nbm.3546. Epub 2016 May 30. NMR Biomed. 2017. PMID: 27240118 Free PMC article. Review.
-
Bacterial-type ferroxidase tunes iron-dependent phosphate sensing during Arabidopsis root development.Curr Biol. 2022 May 23;32(10):2189-2205.e6. doi: 10.1016/j.cub.2022.04.005. Epub 2022 Apr 25. Curr Biol. 2022. PMID: 35472311 Free PMC article.
References
Grants and funding
LinkOut - more resources
Full Text Sources
Other Literature Sources