. 2013 Jan 15;257(2):528-540.
doi: 10.1016/j.ccr.2012.06.003.

Recent advances in phenoxyl radical complexes of salen-type ligands as mixed-valent galactose oxidase models

Affiliations

Recent advances in phenoxyl radical complexes of salen-type ligands as mixed-valent galactose oxidase models

Christopher T Lyons et al. Coord Chem Rev. .

Abstract

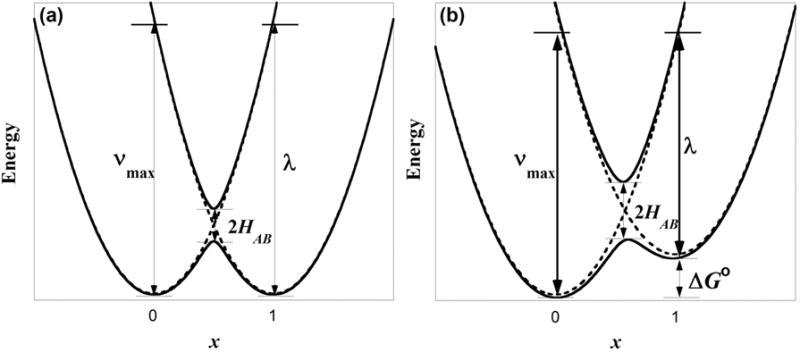
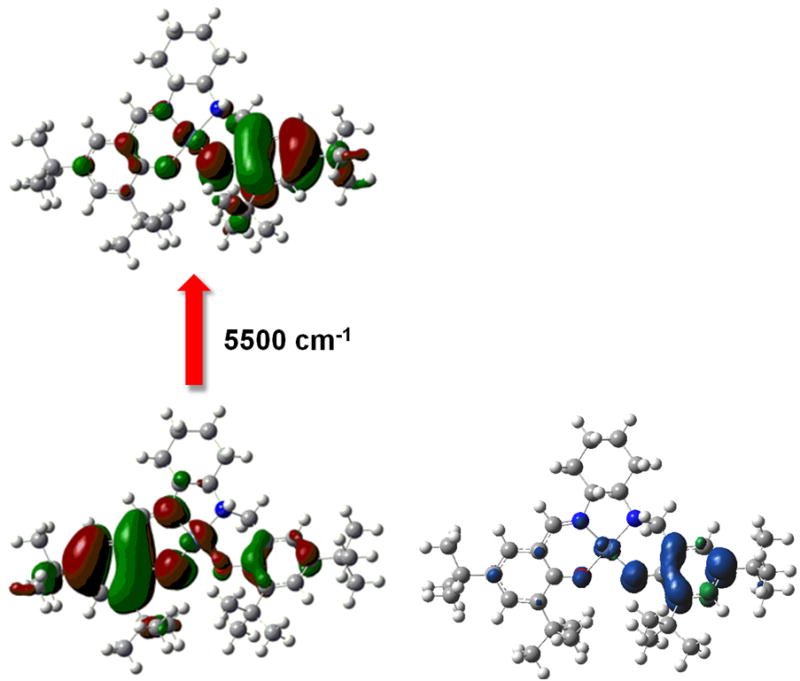
The interplay between redox-active transition metal ions and redox-active ligands in metalloenzyme sites is an area of considerable research interest. Galactose oxidase (GO) is the archetypical example, catalyzing the aerobic oxidation of primary alcohols to aldehydes via two one-electron cofactors: a copper atom and a cysteine-modified tyrosine residue. The electronic structure of the oxidized form of the enzyme (GO(ox)) has been investigated extensively through small molecule analogues including metal-salen phenoxyl radical complexes. Similar to GO(ox), one-electron oxidized metal-salen complexes are mixed-valent species, in which molecular orbitals (MOs) with predominantly phenolate and phenoxyl π-character act as redox-active centers bridged by mixing with metal d-orbitals. A detailed evaluation of the electronic distribution in these odd electron species using a variety of spectroscopic, electrochemical, and theoretical techniques has led to keen insights into the electronic structure of GO(ox).


Figures

Figure 1
Figure 1
Schemes of Marcus-Hush coupling in (a) symmetric and (b) non-symmetric mixed-valent complexes.
Figure 2
Figure 2
(left) TD-DFT β-HOMO → β-LUMO transition for [Ni11]+ and (right) spin density plot for [Ni11]+ showing radical localization on the amino-phenolate [35].
Figure 3
Figure 3
X-ray structure of Cr-tacn phenoxyl radical complex [42].
Figure 4
Figure 4
Metrical parameters of (a) neutral and (b) oxidized Cr-tacn phenolate complex [42].
Figure 5
Figure 5
X-ray structure of [Cu9]+SbF6 [45].
Figure 6
Figure 6
X-ray structure of [Cu3]+SbF6 [46].
Figure 7
Figure 7
Solid state Cu K-edge of Cu3 (black) and [Cu3]+SbF6 (red) inset: Cu pre-edge region (1s → 3d transition) [46].
Figure 8
Figure 8
Solid state sulfur K-edge of neutral (dotted) and oxidized (solid) complexes Cu12SMe2 and Cu12SiPr2[19] .
Figure 9
Figure 9
(a) UV-Vis spectra of [Cu9]+ (blue), [Cu12SiPr2]+ (red), and [Cu14SiPr,OMe]+ (black); (b) UV-Vis spectra of [Cu9]2+ (blue), [Cu12SiPr2]2+ (red), and [Cu14SiPrOMe]2+ (black). Conditions; 0.1mM complex in CH2Cl2 at 298 K [20].
Figure 10
Figure 10
UV-Vis-NIR spectra of Ni3 (black), [Ni3]+ (red), and [Ni3]+(py)2 (blue). Conditions, 0.08 mM complex in CH2Cl2 at 298 K. [Ni3]+(py)2 in 1:1 CH2Cl2:pyridine [40].
Figure 11
Figure 11
UV-Vis-NIR spectra of neutral (black) and one-electron oxidized (red) group 10 metal-salen series: (a) Ni, (b) Pd, (c) Pt. Conditions; 0.1 mM complex, CH2Cl2 at 298K [43].
Figure 12
Figure 12
UV-Vis-NIR of Ni11 (solid) and [Ni11]+ (dashed). Conditions, 0.08 mM complex in CH2Cl2 at 298 K [35].
Figure 13
Figure 13
X-band EPR spectra (solid: data; dashed: simulations) of (a) 1 mM [Ni3]+ , (b) 1 mM [Ni3]+ + 0.1 M tetrabutylammonium perchlorate, (c) 1 mM [Ni3]+ + 2 eq. pyridine. Conditions, 1 mM complex in frozen CH2Cl2 at 77 K [40].
Figure 14
Figure 14
X-band EPR spectra of (a) [Cu10]+ and (b) [Cu10H]2+. Conditions, 1 mM complex and 0.1 M tetrabutylammonium perchlorate in frozen CH2Cl2 at 77 K [54].
Figure 15
Figure 15
Resonance Raman (rR) spectra of GOox (λex = 875 nm) [55].
Figure 16
Figure 16
Resonance Raman (rR) spectra of (a) Cu3, and (b) [Cu3]+ at 298 K; rR spectra of (c) Cu4 and (d) [Cu4]+ at 213 K ex = 413 nm). Conditions, 1 mM complex in CH2Cl2 [46].
Figure 17
Figure 17
Resonance Raman of Ni11 (solid) and [Ni11]+ (dashed) in CH2Cl2 at 213 K ex = 413 nm). Solvent = • Conditions, 1 mM in CH2Cl2 at 213 K [35].
Scheme 1
Scheme 1
Consensus mechanism of GO.
Scheme 2
Scheme 2
Generic salen condensation reaction.
Scheme 3
Scheme 3
Salen ligands.
Scheme 4
Scheme 4
Synthesis of non-symmetric salen ligands.
Scheme 5
Scheme 5
Synthesis of “half-reduced” salen ligands.

References

    1. Fontecave M, Nordlund P, Eklund H, Reichard P. Adv Enzymol Relat Areas Mol Biol. 1992;65:147–183. - PubMed
    1. Stubbe J. Adv Enzymol Relat Areas Mol Biol. 1990;63:349–419. - PubMed
    1. Stubbe J, van der Donk WA. Chem Rev. 1998;98:705–762. - PubMed
    1. Frey PA, Hegeman AD, Reed GH. Chem Rev. 2006;106:3302–3316. - PubMed
    1. Barry BA, Babcock GT. Proc Natl Acad Sci. 1987;84:7099–7103. - PMC - PubMed

LinkOut - more resources