

Rabies virus glycoprotein is an important determinant for the induction of innate immune responses and the pathogenic mechanisms
- PMID: 23265241
- PMCID: PMC3568536
- DOI: 10.1016/j.vetmic.2012.11.031
Rabies virus glycoprotein is an important determinant for the induction of innate immune responses and the pathogenic mechanisms
Abstract
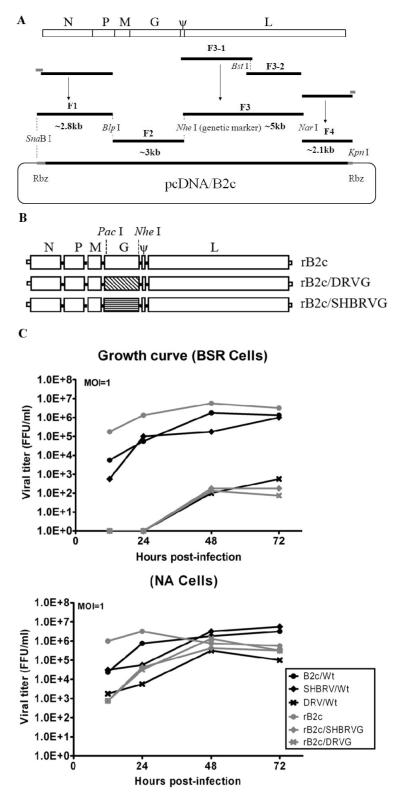
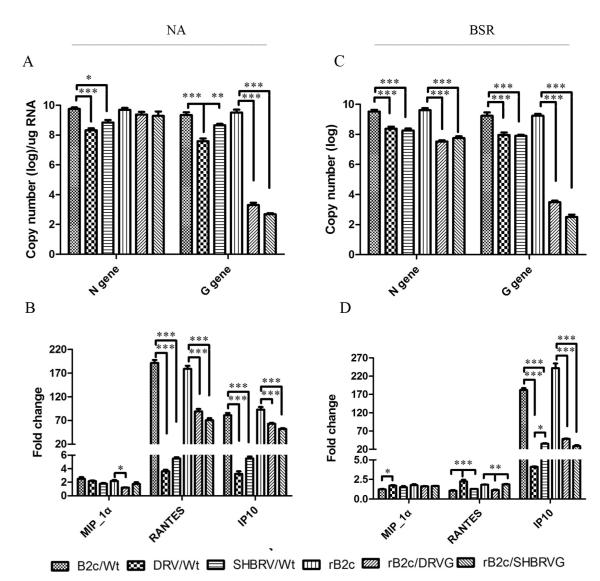
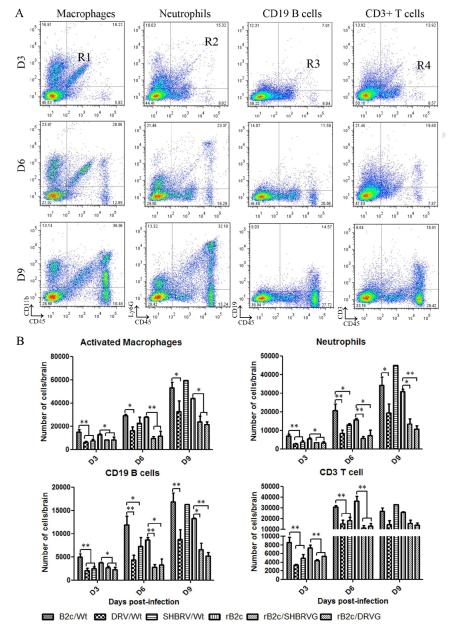
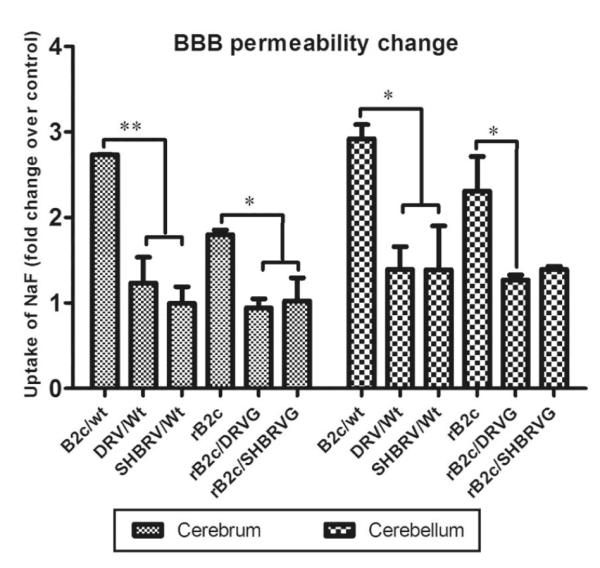
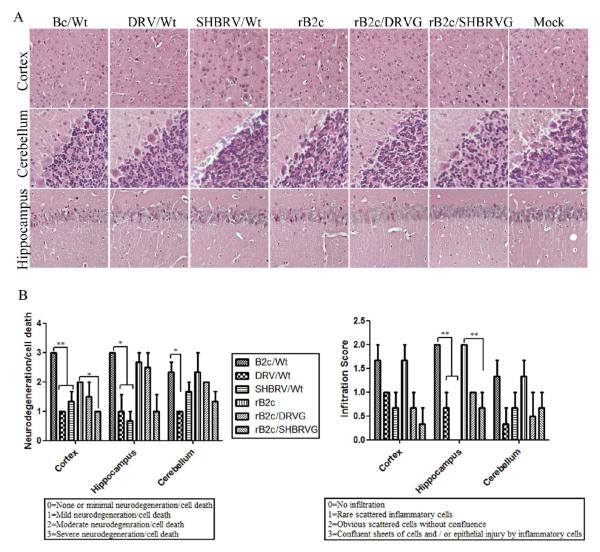
Our previous studies have suggested that street and fixed rabies viruses (RABVs) induce diseases in the mouse model via different mechanisms. In the present study, attempts were made to determine if it is the glycoprotein (G) that is responsible for the observed differences in the pathogenic mechanisms. To this end, an infectious clone from fixed virus B2c was established and used as a backbone for exchange of the G from street viruses. The rate of viral replication, expression of viral proteins, and the induction of innate immune responses were compared in cells or in mice infected with each of the viruses. Furthermore, the infiltration of inflammatory cells into the CNS and the enhancement of blood-brain barrier (BBB) permeability were also compared. It was found that fixed viruses induced stronger innate immune responses (expression of chemokines, infiltration of inflammatory cells, and enhancement of BBB permeability) than street RABV or recombinant viruses expressing the G from street RABVs. Fixed viruses induce disease via an immune-mediated pathogenic mechanism while street viruses or recombinant viruses expressing the G from street RABVs induce diseases via a mechanism other than immune-mediated pathogenesis. Therefore, RABV G is an important determinant for the induction of innate immune responses and consequently the pathogenic mechanisms.
Copyright © 2012 Elsevier B.V. All rights reserved.
Figures
Similar articles
-
Attenuated rabies virus activates, while pathogenic rabies virus evades, the host innate immune responses in the central nervous system.J Virol. 2005 Oct;79(19):12554-65. doi: 10.1128/JVI.79.19.12554-12565.2005. J Virol. 2005. PMID: 16160183 Free PMC article.
-
Role of chemokines in the enhancement of BBB permeability and inflammatory infiltration after rabies virus infection.Virus Res. 2009 Sep;144(1-2):18-26. doi: 10.1016/j.virusres.2009.03.014. Epub 2009 Apr 5. Virus Res. 2009. PMID: 19720239 Free PMC article.
-
Role of chemokines in rabies pathogenesis and protection.Adv Virus Res. 2011;79:73-89. doi: 10.1016/B978-0-12-387040-7.00005-6. Adv Virus Res. 2011. PMID: 21601043 Free PMC article. Review.
-
Enhancement of blood-brain barrier permeability and reduction of tight junction protein expression are modulated by chemokines/cytokines induced by rabies virus infection.J Virol. 2014 May;88(9):4698-710. doi: 10.1128/JVI.03149-13. Epub 2014 Feb 12. J Virol. 2014. PMID: 24522913 Free PMC article.
-
The Immune Escape Strategy of Rabies Virus and Its Pathogenicity Mechanisms.Viruses. 2024 Nov 14;16(11):1774. doi: 10.3390/v16111774. Viruses. 2024. PMID: 39599888 Free PMC article. Review.
Cited by
-
Deficient Incorporation of Rabies Virus Glycoprotein into Virions Enhances Virus-Induced Immune Evasion and Viral Pathogenicity.Viruses. 2019 Mar 4;11(3):218. doi: 10.3390/v11030218. Viruses. 2019. PMID: 30836694 Free PMC article.
-
Serine residues at positions 162 and 166 of the rabies virus phosphoprotein are critical for the induction of oxidative stress in rabies virus infection.J Neurovirol. 2017 Jun;23(3):358-368. doi: 10.1007/s13365-016-0506-8. Epub 2016 Dec 19. J Neurovirol. 2017. PMID: 27995576
-
The inability of wild-type rabies virus to activate dendritic cells is dependent on the glycoprotein and correlates with its low level of the de novo-synthesized leader RNA.J Virol. 2015 Feb;89(4):2157-69. doi: 10.1128/JVI.02092-14. Epub 2014 Dec 3. J Virol. 2015. PMID: 25473057 Free PMC article.
-
Novel Approaches to the Prevention and Treatment of Rabies.Int J Virol Stud Res. 2015 Apr;3(1):8-16. doi: 10.19070/2330-0027-150002. Epub 2015 Apr 7. Int J Virol Stud Res. 2015. PMID: 27891529 Free PMC article.
-
Gene order rearrangement of the M gene in the rabies virus leads to slower replication.Virusdisease. 2014;25(3):365-71. doi: 10.1007/s13337-014-0220-1. Epub 2014 Jun 7. Virusdisease. 2014. PMID: 25674605 Free PMC article.
References
-
- Conzelmann KK, Cox JH, Schneider LG, Thiel HJ. Molecular cloning and complete nucleotide sequence of the attenuated rabies virus SAD B19. Virology. 1990;175:485–499. - PubMed
-
- Dietzschold B, Morimoto K, Hooper DC, Smith JS, Rupprecht CE, Koprowski H. Genotypic and phenotypic diversity of rabies virus variants involved in human rabies: implications for postexposure prophylaxis. Journal of human virology. 2000;3:50–57. - PubMed
-
- Dietzschold B, Schnell M, Koprowski H. Pathogenesis of rabies. Current topics in microbiology and immunology. 2005;292:45–56. - PubMed
-
- Dietzschold ML, Faber M, Mattis JA, Pak KY, Schnell MJ, Dietzschold B. In vitro growth and stability of recombinant rabies viruses designed for vaccination of wildlife. Vaccine. 2004;23:518–524. - PubMed
Publication types
MeSH terms
Substances
Grants and funding
LinkOut - more resources
Full Text Sources
Other Literature Sources
Medical
