. 2013 Mar;120(3):535-543.
doi: 10.1016/j.ophtha.2012.09.055. Epub 2012 Dec 23.

Enhanced detection of open-angle glaucoma with an anatomically accurate optical coherence tomography-derived neuroretinal rim parameter

Affiliations

Enhanced detection of open-angle glaucoma with an anatomically accurate optical coherence tomography-derived neuroretinal rim parameter

Balwantray C Chauhan et al. Ophthalmology. 2013 Mar.

Abstract

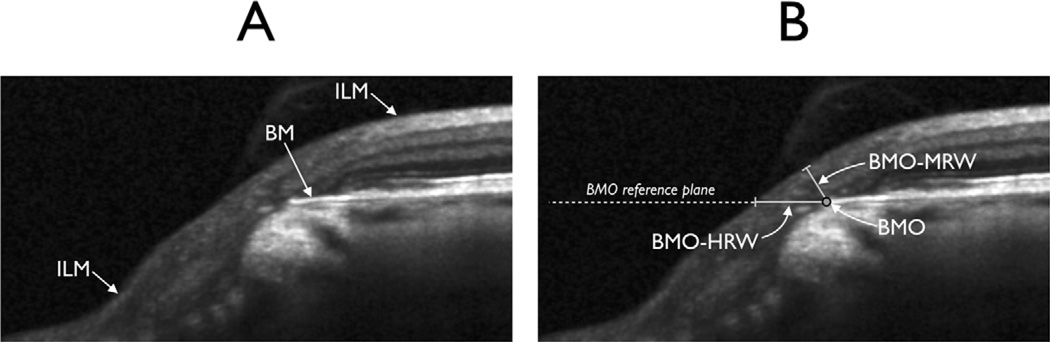
Objective: Neuroretinal rim assessment based on the clinical optic disc margin (DM) lacks a sound anatomic basis for 2 reasons: (1) The DM is not reliable as the outer border of rim tissue because of clinically and photographically invisible extensions of Bruch's membrane (BM) inside the DM and (2) nonaccountability of rim tissue orientation in the optic nerve head (ONH). The BM opening-minimum rim width (BMO-MRW) is a parameter that quantifies the rim from its true anatomic outer border, BMO, and accounts for its variable orientation. We report the diagnostic capability of BMO-MRW.

Design: Case control.

Participants: Patients with open-angle glaucoma (n = 107) and healthy controls (n = 48).

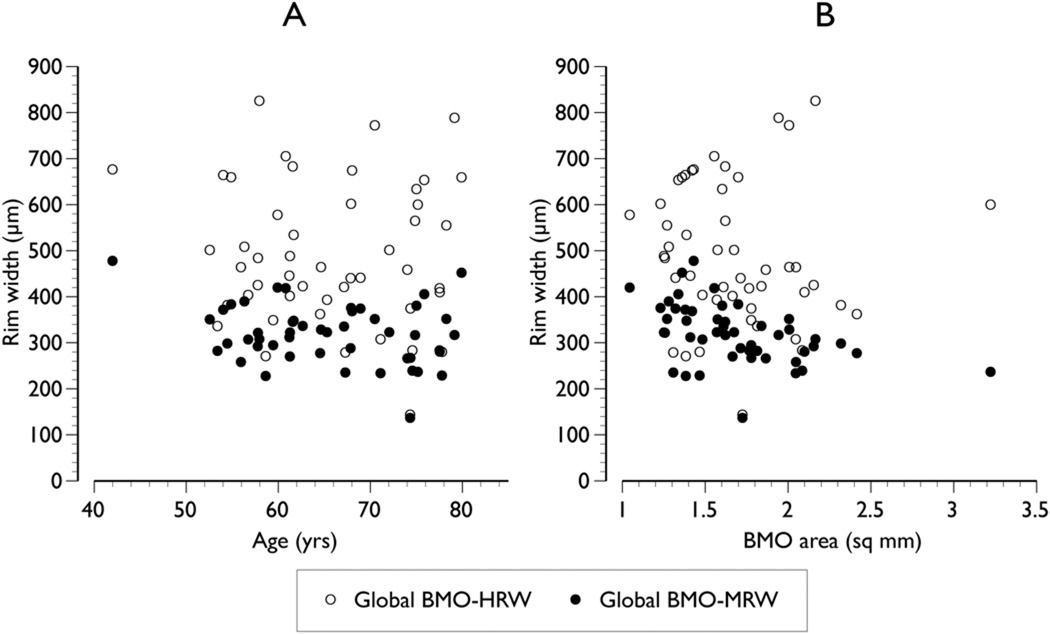
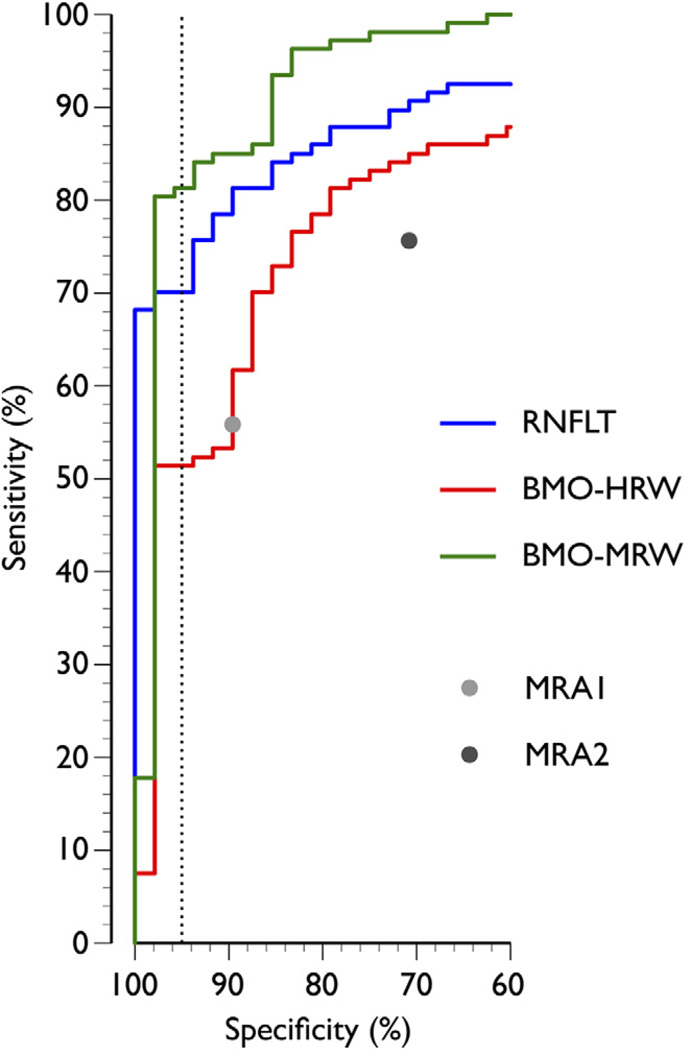
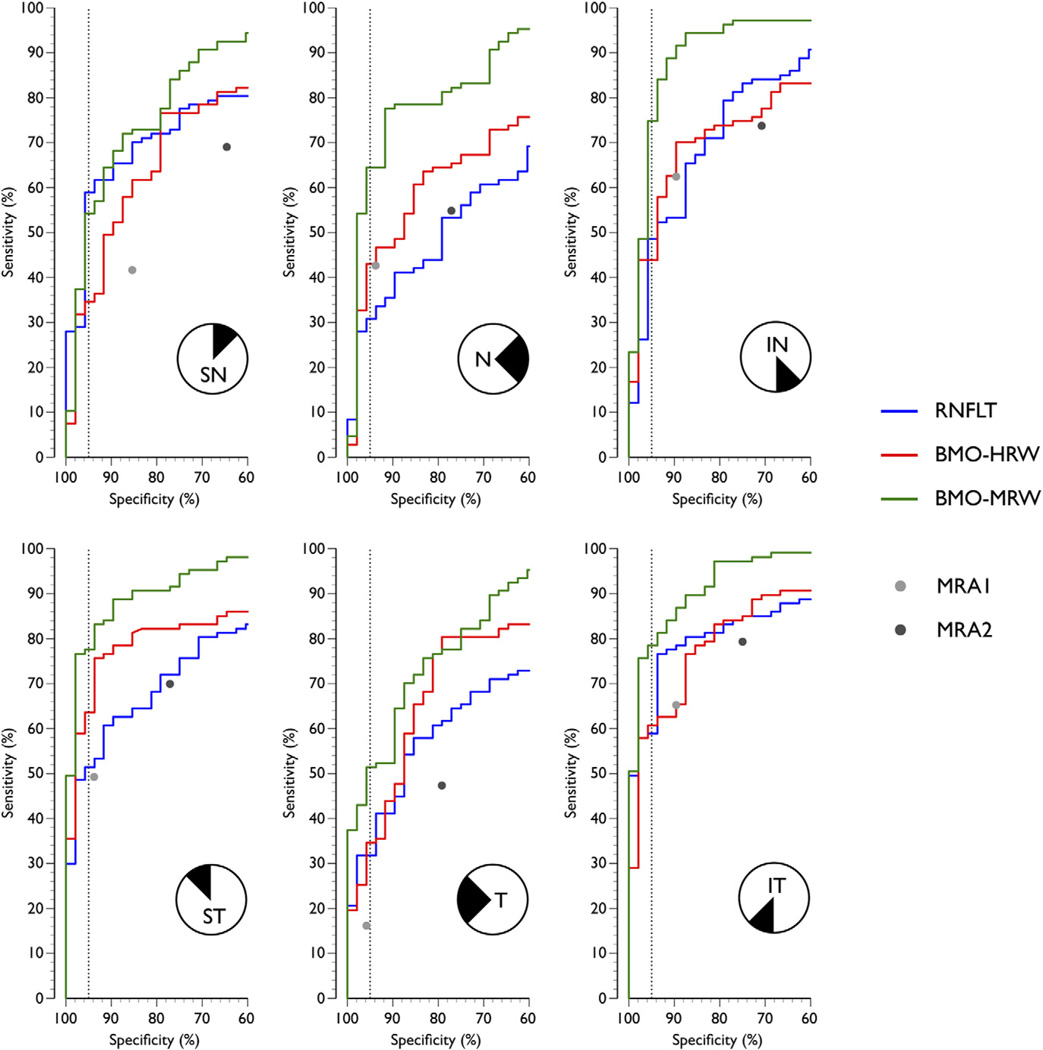
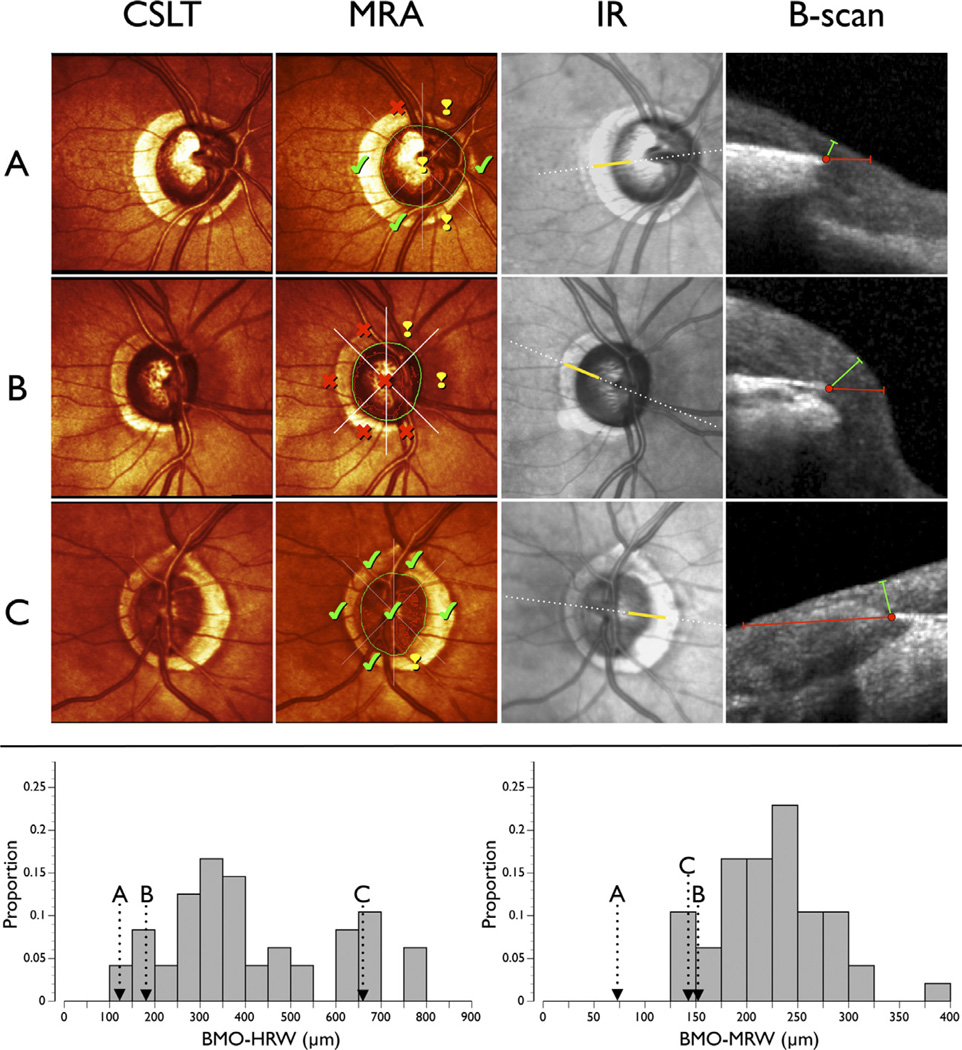
Methods: Spectral-domain optical coherence tomography (SD-OCT) with 24 radial and 1 circumpapillary B-scans, centered on the ONH, and confocal scanning laser tomography (CSLT) were performed. The internal limiting membrane (ILM) and BMO were manually segmented in each radial B-scan. Three SD-OCT parameters were computed globally and sectorally: (1) circumpapillary retinal nerve fiber layer thickness (RNFLT); (2) BMO-horizontal rim width (BMO-HRW), the distance between BMO and ILM in the BMO reference plane; and (3) BMO-MRW, the minimum distance between BMO and ILM. Moorfields Regression Analysis (MRA) with CLST was performed globally and sectorally to yield MRA1 and MRA2, where "borderline" was classified as normal and abnormal, respectively.

Main outcome measures: Sensitivity, specificity, and likelihood ratios (LRs) for positive and negative test results (LR+/LR-).

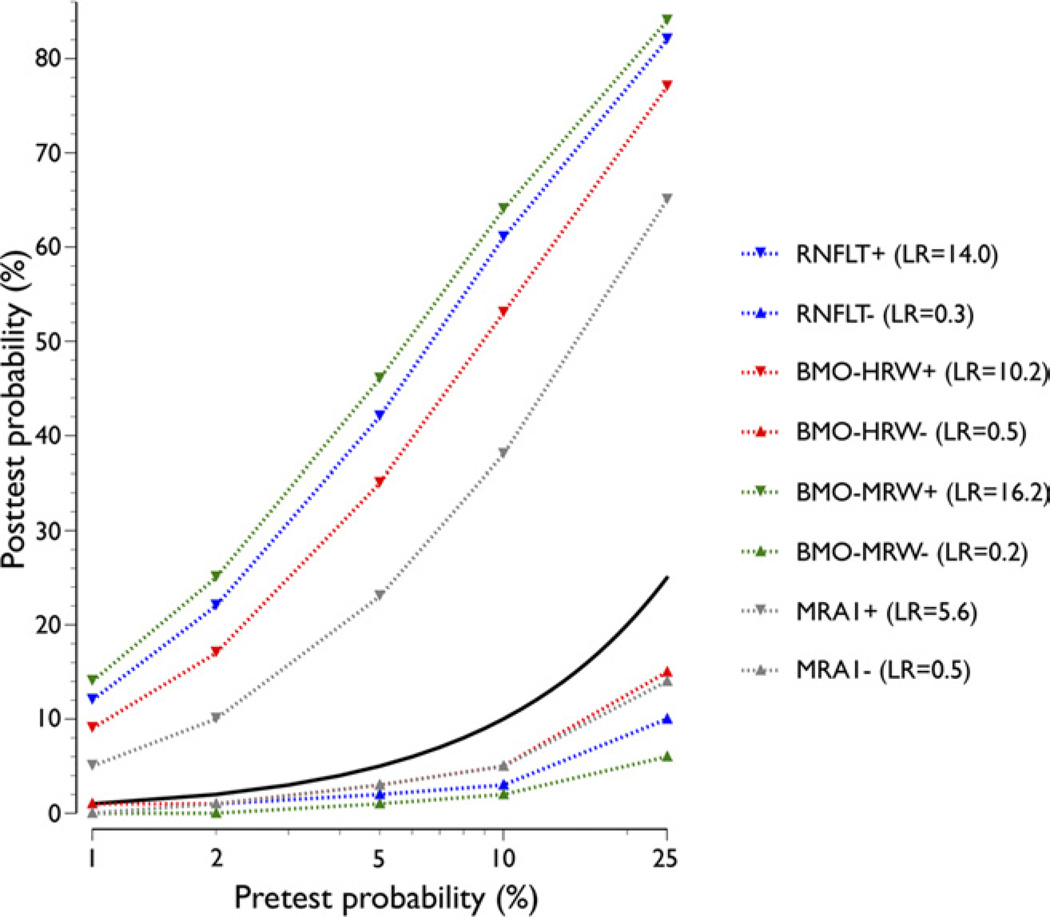
Results: The median (interquartile range) age and mean deviation of patients and controls were 69.9 (64.3-76.9) and 65.0 (58.1-74.3) years and -3.92 (-7.87 to -1.62) and 0.33 (-0.32 to 0.98) dB, respectively. Globally, BMO-MRW yielded better diagnostic performance than the other parameters. At 95% specificity, the sensitivity of RNFLT, BMO-HRW, and BMO-MRW was 70%, 51%, and 81%, respectively. The corresponding LR+/LR- was 14.0/0.3, 10.2/0.5, and 16.2/0.2. Sectorally, at 95% specificity, the sensitivity of RNFLT ranged from 31% to 59%, of BMO-HRW ranged from 35% to 64%, and of BMO-MRW ranged from 54% to 79%. Globally and in all sectors, BMO-MRW performed better than MRA1 or MRA2.

Conclusions: The higher sensitivity at 95% specificity in early glaucoma of BMO-MRW compared with current BMO methods is significant, indicating a new structural marker for the detection and risk profiling of glaucoma.


Figures

Figure 1
Figure 1
Neuroretinal rim parameters measured with spectral-domain optical coherence tomography (SD-OCT). A, Portion of a radial B-scan illustrating Bruch’s membrane (BM) and internal limiting membrane (ILM). B, Same portion of the B-scan illustrating Bruch’s membrane opening (BMO), BMO-horizontal rim width (BMO-HRW), the distance from BMO to the ILM along the BMO reference plane, and Bruch’s membrane opening-minimum rim width (BMO-MRW), the minimum distance from BMO to the ILM.
Figure 2
Figure 2
Relationship between the 2 Bruch’s membrane opening (BMO)–based parameters, Bruch’s membrane opening-horizontal rim width (BMO-HRW) and Bruch’s membrane opening-minimum rim width (BMO-MRW), and age (A) and BMO area (B) in healthy control subjects.
Figure 3
Figure 3
The receiver operating characteristic (ROC) curves illustrating the diagnostic performance of retinal nerve fiber layer thickness (RNFLT), Bruch’s membrane opening-horizontal rim width (BMO-HRW), and Bruch’s membrane opening-minimum rim width (BMO-MRW) computed globally. Also shown are the 2 discrete points of the global Moorfields Regression Analysis (MRA) from confocal scanning laser tomography (CSLT), MRA1 where “borderline” cases were classified as normal, and MRA2 where “borderline” cases were classified as abnormal. Dashed vertical line indicates specificity of 95%.
Figure 4
Figure 4
The confocal scanning laser tomography (ROC) curves illustrating the diagnostic performance of retinal nerve fiber layer thickness (RNFLT), Bruch’s membrane opening-horizontal rim width (BMO-HRW), and Bruch’s membrane opening-minimum rim width (BMO-MRW) computed for the 6 sectors. Also shown are the 2 discrete points of the sectoral Moorfields Regression Analysis (MRA) from confocal scanning laser tomography (CSLT), conservative Moorfields Regression Analysis (MRA1) where “borderline” cases were classified as normal, and liberal Moorfields Regression Analysis (MRA2) where “borderline” cases were classified as abnormal. Dashed vertical line indicates specificity of 95%. IN = inferonasal; IT = inferotemporal; N = nasal; SN = superonasal; ST = superotemporal; T = temporal.
Figure 5
Figure 5
Examples of patients with glaucoma illustrating the significant discordance between results of confocal scanning laser tomography (CSLT) and spectral-domain optical coherence tomography (SD-OCT). CSLT, pseudocolor optic nerve head (ONH) image; Moorfields Regression Analysis (MRA), results from the MRA where the closed green shape represents the clinical optic disc margin (DM). The MRA results indicate “within normal limits” (check mark), “borderline” (exclamation mark), and “outside normal limits” (cross) for each of the 6 sectors and globally. Infrared (IR) image from SD-OCT where the dotted white line indicates the position of the radial B-scan (shown in the next column). B-scan, portion of the B-scan (indicated by the solid yellow line in the previous column). Red dot shows BMO, red line shows Bruch’s membrane opening-horizontal rim width (BMO-HRW), and green line shows Bruch’s membrane opening-minimum rim width (BMO-MRW). Bottom: distribution of temporal BMO-HRW (left) and temoporal BMO-MRW (right) in healthy control subjects. A, Right ONH of a patient with MRA within normal limits in the temporal sector. The mean temporal BMO-HRW is less than the 5th percentile of the normal distribution (arrow), whereas the BMO-MRW value is less than half of the lowest value in the normal distribution. B, Right ONH of a patient with MRA outside normal limits in the temporal sector. The mean temporal BMO-HRW and BMO-MRW are approximately the 10th percentile of the normal distribution. C, Left ONH of a patient with MRA within normal limits in the temporal sector. The mean temporal BMO-HRW is approximately the 85th percentile of the normal distribution, but the mean temporal BMO-MRW is approximately the 5th percentile of the normal distribution.
Figure 6
Figure 6
Pre- and posttest probability of the various global parameters based on cutoff values yielding 95% specificity. Data comparing circumpapillary retinal nerve fiber layer thickness (RNFLT), Bruch’s membrane opening-horizontal rim width (BMO-HRW), and Bruch’s membrane opening-minimum rim width (BMO-MRW) and the more conservative conservative Moorfields Regression Analysis (MRA) cutoff (MRA1), which yields 90% specificity, are shown. Posttest probabilities for both positive (+) and negative (−) test results are indicated. The likelihood ratio (LRs) for positive and negative test results are shown. Solid black line indicates equal pre- and posttest probability.

Comment in

Similar articles

Cited by

References

    1. Hogan MJ, Alvarado JA, Weddell JE. Histology of the Human Eye: An Atlas and Textbook. Philadelphia, PA: Saunders; 1971. pp. 538–540.
    1. Reis AS, Sharpe GP, Yang H, et al. Optic disc margin anatomy in patients with glaucoma and normal controls with spectral domain optical coherence tomography. Ophthalmology. 2012;119:738–747. - PMC - PubMed
    1. Reis AS, O’Leary N, Yang H, et al. Influence of clinically invisible, but optical coherence tomography detected, optic disc margin anatomy on neuroretinal rim evaluation. Invest Ophthalmol Vis Sci. 2012;53:1852–1860. - PMC - PubMed
    1. Abramoff MD, Lee K, Niemeijer M, et al. Automated segmentation of the cup and rim from spectral domain OCT of the optic nerve head. Invest Ophthalmol Vis Sci. 2009;50:5778–5784. - PMC - PubMed
    1. Hu Z, Abramoff MD, Kwon YH, et al. Automated segmentation of neural canal opening and optic cup in 3D spectral optical coherence tomography volumes of the optic nerve head. Invest Ophthalmol Vis Sci. 2010;51:5708–5717. - PMC - PubMed

Publication types