. 2013 Mar;61(3):681-9.
doi: 10.1161/HYPERTENSIONAHA.111.00202. Epub 2012 Dec 24.

Angiotensin-converting enzyme 2 priming enhances the function of endothelial progenitor cells and their therapeutic efficacy

Affiliations

Angiotensin-converting enzyme 2 priming enhances the function of endothelial progenitor cells and their therapeutic efficacy

Ji Chen et al. Hypertension. 2013 Mar.

Abstract

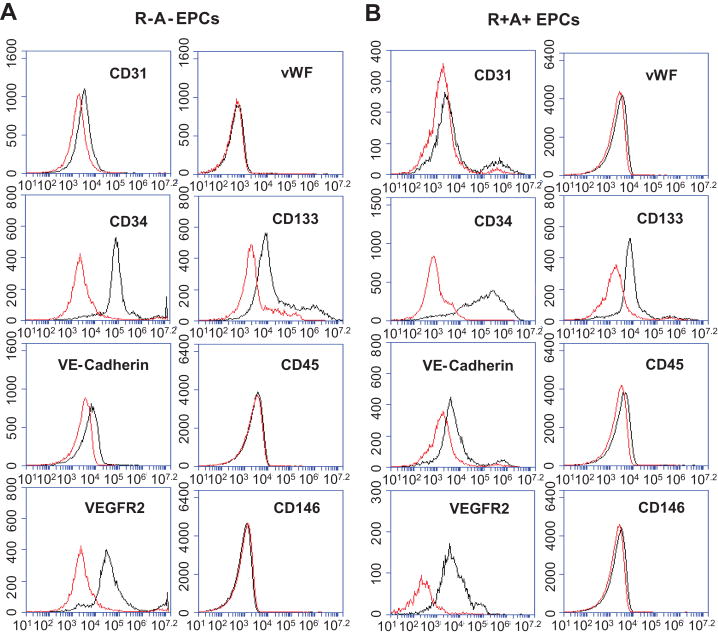
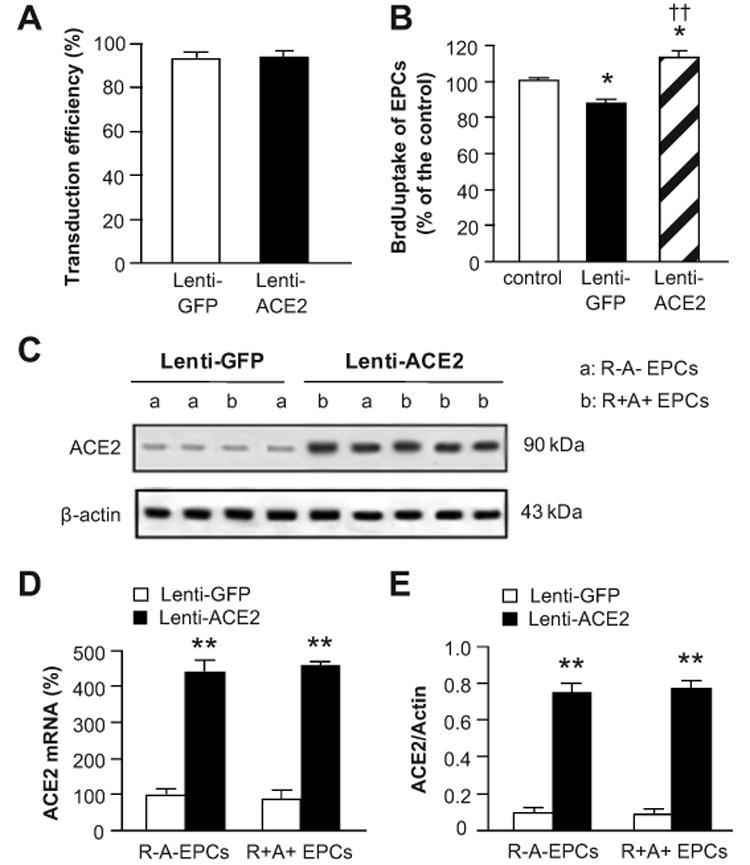
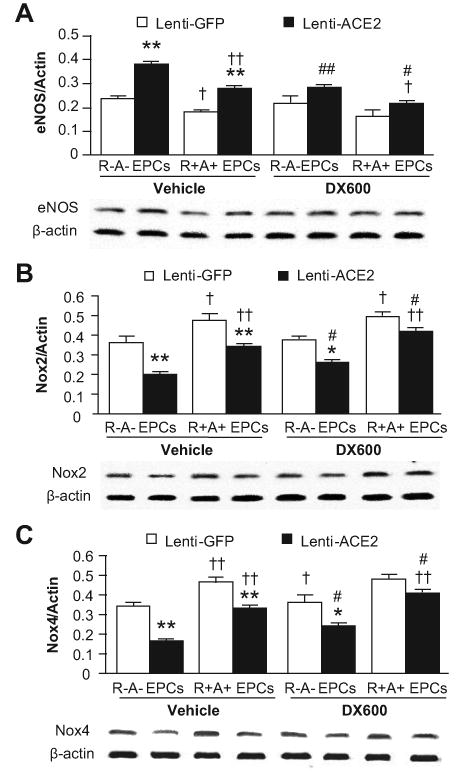
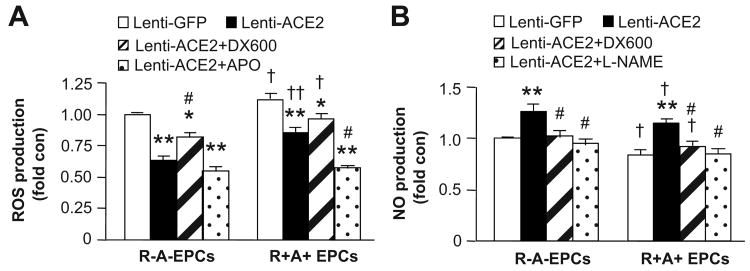
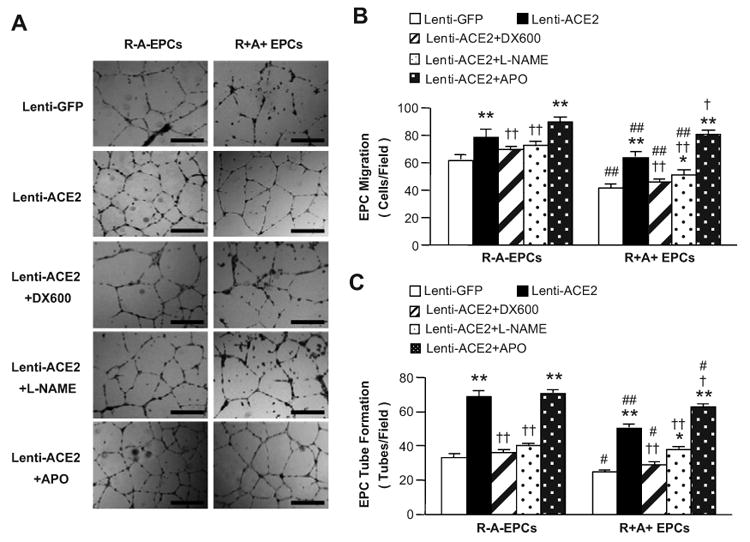
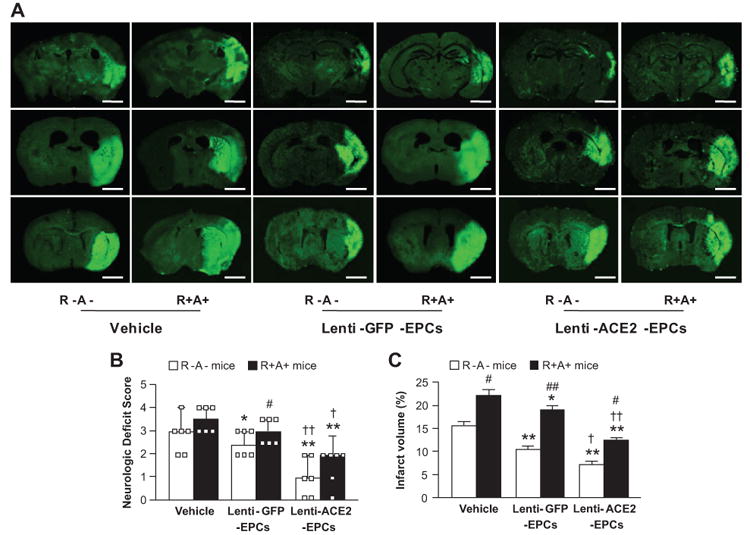
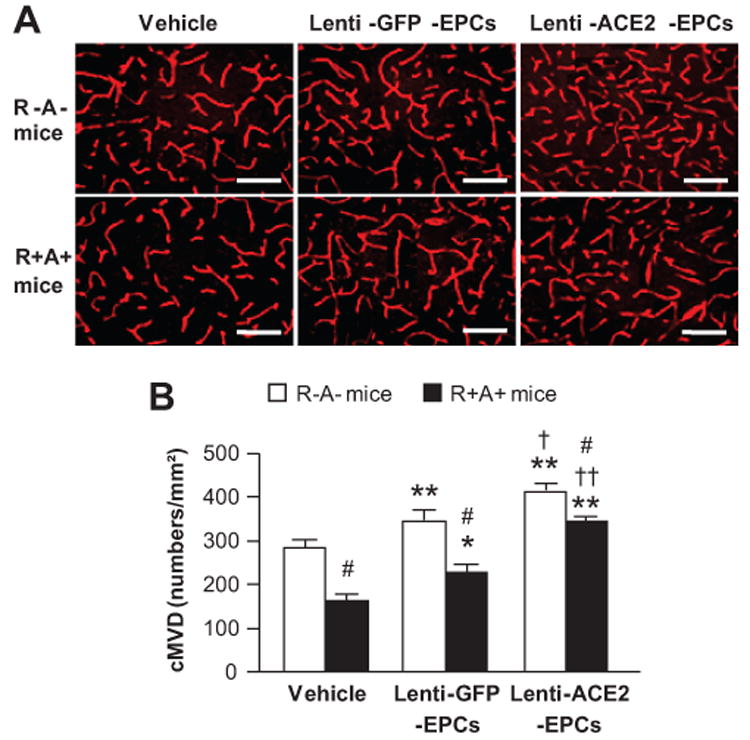
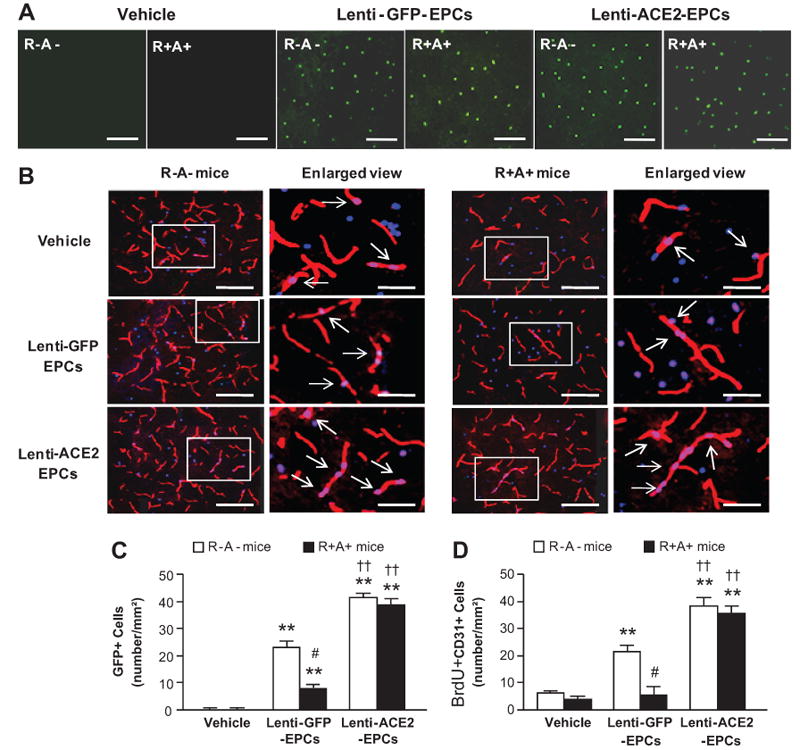
Angiotensin-converting enzyme 2 (ACE2) is a lately discovered enzyme catalyzing Angiotensin II into Angiotensin 1-7. Angiotensin II has been reported to impair endothelial progenitor cell (EPC) function and is detrimental to stroke. Here, we studied the role of ACE2 in regulating EPC function in vitro and in vivo. EPCs were cultured from human renin and angiotensinogen transgenic (R+A+) mice and their controls (R-A-). In in vitro experiments, EPCs were transduced with lentivirus-ACE2 or lentivirus-green fluorescence protein. The effects of ACE2 overexpression on EPC function and endothelial NO synthase (eNOS)/nicotinamide adenine dinucleotide phosphate oxidase (Nox) expression were determined. ACE2, eNOS, and Nox inhibitors were used for pathway validation. In in vivo studies, the therapeutic efficacy of EPCs overexpressing ACE2 was determined at day 7 after ischemic stroke induced by middle cerebral artery occlusion. We found that (1) lentivirus-ACE2 transduction resulted in a 4-fold increase of ACE2 expression in EPCs. This was accompanied with an increase in eNOS expression and NO production, and a decrease in Nox2 and -4 expression and reactive oxygen species production. (2) ACE2 overexpression improved the abilities of EPC migration and tube formation, which were impaired in R+A+ mice. These effects were inhibited by ACE2 or eNOS inhibitor and further enhanced by Nox inhibitor. (3) Transfusion of lentivirus-ACE2-primed EPCs reduced cerebral infarct volume and neurological deficits, and increased cerebral microvascular density and angiogenesis. Our data demonstrate that ACE2 improves EPC function, via regulating eNOS and Nox pathways, and enhances the efficacy of EPC-based therapy for ischemic stroke.


Conflict of interest statement

Conflict(s) of Interest/Disclosure(s): The authors declare no conflict of interest.

Figures

Figure 1
Figure 1
The phenotype of cultured EPCs. Representative flow plot showing the expression of CD34, VEGFR2, CD133, CD31, VE-Cadherin, vWF, CD45 and CD146 on the EPCs cultured from R-A- (A) and R+A+ mice (B).
Figure 2
Figure 2
Transduction efficiency, proliferation rate and ACE2 expression in EPCs. A, Transduction efficiency of lentivirus in EPCs. B, Proliferation rate of control, and EPCs transuded with Lenti-GFP or Lenti-ACE2. *P<0.05 versus control; ††P<0.01 versus Lenti-GFP. C, Representative Western blot bands showing the ACE2 expression in EPCs. Summarized data of ACE2 expression in EPCs at mRNA (D) and protein (E) levels. **P<0.01 versus Lenti-GFP, n=6/group. Control: untransduced EPCs.
Figure 3
Figure 3
The effects of ACE2 over-expression on gene expression. The eNOS (A), Nox2 (B) and Nox4 (C) expression in EPCs. EPCs were transduced with Lenti-GFP or Lenti-ACE2, and then incubated with or without DX600 (1 μmol/L). The protein expression was normalized to the expression of β-actin. *P<0.05, **P<0.01 versus Lenti-GFP; P<0.05, ††P<0.01 versus R-A- EPCs; #P<0.05 versus vehicle, n=6/group. eNOS: endothelial nitric oxide synthase; Nox: nicotinamide adenine dinucleotide phosphate (NADPH) oxidase.
Figure 4
Figure 4
The effects of ACE2 over-expression on ROS and NO production of EPCs. The ROS (A) and NO (B) production in EPCs transduced with Lenti-GFP or Lenti-ACE2. Cells were incubated with DX600 (1 μmol/L), APO (10 μmol/L) or L-NAME (1 mmol/L). *P<0.05, **P<0.01 versus Lenti-GFP; P<0.05, ††P<0.01 versus R-A- EPCs; #P<0.05 versus Lenti-ACE2, n=6/group. ROS: reactive oxygen species; NO: nitric oxygen.
Figure 5
Figure 5
ACE2 over-expression enhances the function of EPCs. A, Representative images of EPC tube formation. Scale bar: 600 μm. The abilities of EPC migration (B) and tube formation (C) in EPCs transduced with Lenti-GFP or Lenti-ACE2. Cells were incubated with DX600 (1 μmol/L), APO (10 μmol/L) or L-NAME (1 mmol/L). *P<0.05, **P<0.01 versus Lenti-GFP; P<0.05, ††P<0.01 versus Lenti-ACE2; #P<0.05, ##P<0.01 versus R-A- EPCs, n=6/group.
Figure 6
Figure 6
Effects of Lenti-ACE2-EPC infusion on infarct volume and neurologic deficit score. A, Representative pictures of Fluoro-J staining 7 days after EPC infusion. Scale bar: 2 mm. Summarized data on neurologic deficit scores (B) and infarct volume (C). Transfusion of Lenti-ACE2-EPCs has better efficacy than Lenti-GFP-EPCs in decreasing infarct volume and improving neurologic deficit. *P<0.05, **P<0.01 versus vehicle; P<0.05, ††P<0.01 versus Lenti-GFP-EPCs; #P<0.05, ##P<0.01 versus R-A- mice, n=6/group.
Figure 7
Figure 7
Effects of Lenti-ACE2-EPC infusion on cMVD in cerebral microvasculature in the peri-infarct area. A, Representative pictures of cMVD (CD31 immunostaining) on day 7 following MCAO and EPC infusion. Scale bar: 50 μm. B, Summarized data of cMVD. *P<0.05, **P<0.01 versus vehicle; P<0.05, ††P<0.01 versus Lenti-GFP-EPCs; #P<0.05 versus R-A- mice, n=6/group. cMVD: cerebral microvascular density.
Figure 8
Figure 8
Effect of Lenti-ACE2-EPC infusion on angiogenesis in the peri-infarct area. A, Representative pictures of in vivo tracking of transfused EPCs 7 days after EPC infusion. Green: GFP for transfused EPCs. Scale bar: 50 μm. B, Representative pictures of angiogenesis (BrdU+CD31+ cells). Red: CD31 for vessel; Blue: BrdU for new generated cells; Pink: double staining. Scale bar: 50 μm. The enlarged view of double staining cells is in the left panel of each image. The arrows indicate the double staining cells. Scale bar: 20 μm. Histogram showing the number of GFP+ cells (C) and BrdU+CD31+ cells (D). **P<0.01 versus vehicle; ††P<0.01 versus Lenti-GFP-EPCs; #P<0.05 versus R-A- mice, n=6/group.

References

    1. Guo YJ, Li WH, Wu R, Xie Q, Cui LQ. ACE2 overexpression inhibits angiotensin II-induced monocyte chemoattractant protein-1 expression in macrophages. Arch Med Res. 2008;39:149–154. - PubMed
    1. Xia H, Lazartigues E. Angiotensin-converting enzyme 2 in the brain: properties and future directions. J Neurochem. 2008;107:1482–1494. - PMC - PubMed
    1. Ferreira AJ, Raizada MK. Genomic and proteomic approaches for targeting of angiotensin-converting enzyme2 for cardiovascular diseases. Curr Opin Cardiol. 2008;23:364–369. - PubMed
    1. Zhang C, Zhao YX, Zhang YH, Zhu L, Deng BP, Zhou ZL, Li SY, Lu XT, Song LL, Lei XM, Tang WB, Wang N, Pan CM, Song HD, Liu CX, Dong B, Zhang Y, Cao Y. Angiotensin-converting enzyme 2 attenuates atherosclerotic lesions by targeting vascular cells. Proc Natl Acad Sci U S A. 2010;107:15886–15891. - PMC - PubMed
    1. Doughan AK, Harrison DG, Dikalov SI. Molecular mechanisms of angiotensin II-mediated mitochondrial dysfunction: linking mitochondrial oxidative damage and vascular endothelial dysfunction. Circ Res. 2008;102:488–496. - PubMed

Publication types

MeSH terms